
Poland - Electric Ovens, Cookers, Cooking Plates, Boiling Rings, Grillers And Roasters - Market Analysis, Forecast, Size, Trends and Insights
Get instant access to more than 2 million reports, dashboards, and datasets on the IndexBox Platform.
View PricingPrice of Electric Oven and Cooker Increases Slightly to $60.6 per Unit in Poland
Poland Electric Oven And Cooker Export Price in May 2023
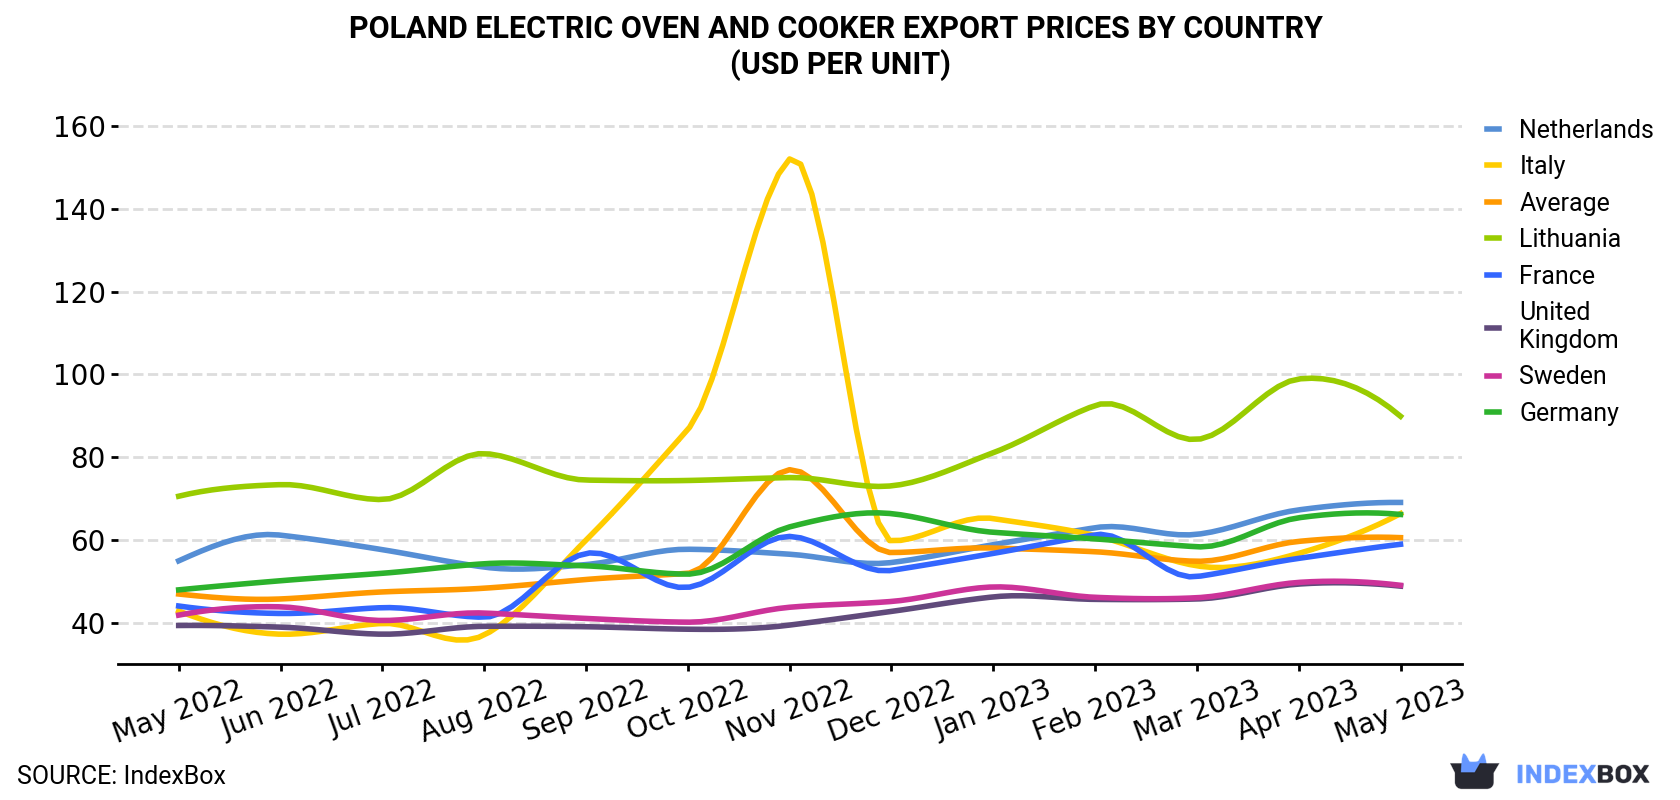
In May 2023, the electric oven and cooker price stood at $60.6 per unit (FOB, Poland), rising by 1.5% against the previous month. Over the last twelve months, it increased at an average monthly rate of +2.1%. The most prominent rate of growth was recorded in November 2022 when the average export price increased by 48% against the previous month. As a result, the export price reached the peak level of $77,031 per thousand units. From December 2022 to May 2023, the the average export prices remained at a somewhat lower figure.
Prices varied noticeably by the country of destination: the country with the highest price was Lithuania ($89.9 per unit), while the average price for exports to the UK ($48.9 per unit) was amongst the lowest.
From May 2022 to May 2023, the most notable rate of growth in terms of prices was recorded for supplies to Italy (+3.7%), while the prices for the other major destinations experienced more modest paces of growth.
| COUNTRY | Export Price of Electric Oven And Cooker in Poland (USD per unit) | ||||||||||||
|---|---|---|---|---|---|---|---|---|---|---|---|---|---|
| May 2022 | Jun 2022 | Jul 2022 | Aug 2022 | Sep 2022 | Oct 2022 | Nov 2022 | Dec 2022 | Jan 2023 | Feb 2023 | Mar 2023 | Apr 2023 | May 2023 | |
| Lithuania | 70.6 | 73.4 | 69.8 | 80.9 | 74.5 | 74.4 | 75.1 | 73.1 | 81.1 | 92.5 | 84.3 | 98.9 | 89.9 |
| Netherlands | 55.0 | 61.2 | 57.7 | 53.5 | 54.1 | 57.8 | 56.6 | 54.6 | 58.9 | 63.0 | 61.4 | 67.3 | 69.1 |
| Italy | 42.9 | 37.3 | 39.9 | 37.1 | 60.0 | 86.7 | 152 | 59.8 | 65.2 | 61.1 | 53.8 | 56.8 | 66.4 |
| Germany | 48.0 | 50.2 | 52.0 | 54.3 | 53.8 | 51.8 | 63.2 | 66.4 | 61.9 | 60.3 | 58.4 | 65.4 | 66.2 |
| France | 44.1 | 42.3 | 43.7 | 41.4 | 56.8 | 48.6 | 60.9 | 52.7 | 56.8 | 61.3 | 51.2 | 55.6 | 59.0 |
| Sweden | 41.9 | 43.9 | 40.6 | 42.4 | 41.1 | 40.2 | 43.8 | 45.2 | 48.7 | 46.2 | 46.1 | 49.8 | 49.1 |
| United Kingdom | 39.4 | 39.0 | 37.3 | 39.2 | 39.1 | 38.5 | 39.5 | 42.8 | 46.3 | 45.7 | 45.8 | 49.4 | 48.9 |
| Average | 47.0 | 45.8 | 47.5 | 48.4 | 50.5 | 52.0 | 77.0 | 57.0 | 58.1 | 57.2 | 54.9 | 59.7 | 60.6 |
Poland Electric Oven And Cooker Exports
In May 2023, overseas shipments of electric ovens, cookers, cooking plates, boiling rings, grillers and roasters decreased by -5.2% to 1.2M units, falling for the second consecutive month after three months of growth. Overall, exports saw a mild slump. The growth pace was the most rapid in September 2022 with an increase of 31% month-to-month. Over the period under review, the exports attained the peak figure at 1.7M units in November 2022; however, from December 2022 to May 2023, the exports failed to regain momentum.
In value terms, electric oven and cooker exports fell modestly to $70M (IndexBox estimates) in May 2023. Over the period under review, exports, however, recorded a relatively flat trend pattern. The most prominent rate of growth was recorded in November 2022 when exports increased by 56% against the previous month. As a result, the exports reached the peak of $130M. From December 2022 to May 2023, the growth of the exports remained at a somewhat lower figure.
Poland Electric Oven And Cooker Exports by Country
Germany (283K units), the UK (239K units) and Sweden (105K units) were the main destinations of electric oven and cooker exports from Poland, with a combined 54% share of total exports. Italy, France, Ukraine, the Netherlands, Denmark, Russia, Greece and Lithuania lagged somewhat behind, together accounting for a further 26%.
From May 2022 to May 2023, the biggest increases were in Russia (with a CAGR of +23.5%), while shipments for the other leaders experienced more modest paces of growth.
In value terms, Germany ($19M), the UK ($12M) and Italy ($5.3M) appeared to be the largest markets for electric oven and cooker exported from Poland worldwide, together comprising 51% of total exports. Sweden, France, the Netherlands, Ukraine, Denmark, Lithuania, Russia and Greece lagged somewhat behind, together comprising a further 27%.
Russia, with a CAGR of +19.7%, saw the highest rates of growth with regard to the value of exports, among the main countries of destination over the period under review, while shipments for the other leaders experienced more modest paces of growth.
This report provides an in-depth analysis of the market for electric oven and cooker in Poland. Within it, you will discover the latest data on market trends and opportunities by country, consumption, production and price developments, as well as the global trade (imports and exports). The forecast exhibits the market prospects through 2030.
Product coverage:
- Prodcom 27512810 - Domestic electric cookers with at least an oven and a hob (including combined gas-electric appliances)
- Prodcom 27512830 - Electric cooking plates, boiling rings and hobs for domestic use
- Prodcom 27512850 - Domestic electric grills and roasters
- Prodcom 27512870 - Domestic electric ovens for building-in
- Prodcom 27512890 - Domestic electric ovens (excluding those for building-in, m icrowave ovens)
Country coverage:
- Poland
Data coverage:
- Market volume and value
- Per Capita consumption
- Forecast of the market dynamics in the medium term
- Trade (exports and imports) in Poland
- Export and import prices
- Market trends, drivers and restraints
- Key market players and their profiles
Reasons to buy this report:
- Take advantage of the latest data
- Find deeper insights into current market developments
- Discover vital success factors affecting the market
This report is designed for manufacturers, distributors, importers, and wholesalers, as well as for investors, consultants and advisors.
In this report, you can find information that helps you to make informed decisions on the following issues:
- How to diversify your business and benefit from new market opportunities
- How to load your idle production capacity
- How to boost your sales on overseas markets
- How to increase your profit margins
- How to make your supply chain more sustainable
- How to reduce your production and supply chain costs
- How to outsource production to other countries
- How to prepare your business for global expansion
While doing this research, we combine the accumulated expertise of our analysts and the capabilities of artificial intelligence. The AI-based platform, developed by our data scientists, constitutes the key working tool for business analysts, empowering them to discover deep insights and ideas from the marketing data.
-
1. INTRODUCTION
Making Data-Driven Decisions to Grow Your Business
- REPORT DESCRIPTION
- RESEARCH METHODOLOGY AND AI PLATFORM
- DATA-DRIVEN DECISIONS FOR YOUR BUSINESS
- GLOSSARY AND SPECIFIC TERMS
-
2. EXECUTIVE SUMMARY
A Quick Overview of Market Performance
- KEY FINDINGS
- MARKET TRENDS This Chapter is Available Only for the Professional Edition PRO
-
3. MARKET OVERVIEW
Understanding the Current State of The Market and Its Prospects
- MARKET SIZE
- MARKET STRUCTURE
- TRADE BALANCE
- PER CAPITA CONSUMPTION
- MARKET FORECAST TO 2030
-
4. MOST PROMISING PRODUCT
Finding New Products to Diversify Your Business
This Chapter is Available Only for the Professional Edition PRO- TOP PRODUCTS TO DIVERSIFY YOUR BUSINESS
- BEST-SELLING PRODUCTS
- MOST CONSUMED PRODUCT
- MOST TRADED PRODUCT
- MOST PROFITABLE PRODUCT FOR EXPORT
-
5. MOST PROMISING SUPPLYING COUNTRIES
Choosing the Best Countries to Establish Your Sustainable Supply Chain
This Chapter is Available Only for the Professional Edition PRO- TOP COUNTRIES TO SOURCE YOUR PRODUCT
- TOP PRODUCING COUNTRIES
- TOP EXPORTING COUNTRIES
- LOW-COST EXPORTING COUNTRIES
-
6. MOST PROMISING OVERSEAS MARKETS
Choosing the Best Countries to Boost Your Exports
This Chapter is Available Only for the Professional Edition PRO- TOP OVERSEAS MARKETS FOR EXPORTING YOUR PRODUCT
- TOP CONSUMING MARKETS
- UNSATURATED MARKETS
- TOP IMPORTING MARKETS
- MOST PROFITABLE MARKETS
7. PRODUCTION
The Latest Trends and Insights into The Industry
- PRODUCTION VOLUME AND VALUE
8. IMPORTS
The Largest Import Supplying Countries
- IMPORTS FROM 2012–2023
- IMPORTS BY COUNTRY
- IMPORT PRICES BY COUNTRY
9. EXPORTS
The Largest Destinations for Exports
- EXPORTS FROM 2012–2023
- EXPORTS BY COUNTRY
- EXPORT PRICES BY COUNTRY
-
10. PROFILES OF MAJOR PRODUCERS
The Largest Producers on The Market and Their Profiles
This Chapter is Available Only for the Professional Edition PRO -
LIST OF TABLES
- Key Findings In 2023
- Market Volume, In Physical Terms, 2012–2023
- Market Value, 2012–2023
- Per Capita Consumption In 2012-2023
- Imports, In Physical Terms, By Country, 2012–2023
- Imports, In Value Terms, By Country, 2012–2023
- Import Prices, By Country Of Origin, 2012–2023
- Exports, In Physical Terms, By Country, 2012–2023
- Exports, In Value Terms, By Country, 2012–2023
- Export Prices, By Country Of Destination, 2012–2023
-
LIST OF FIGURES
- Market Volume, In Physical Terms, 2012–2023
- Market Value, 2012–2023
- Market Structure – Domestic Supply vs. Imports, In Physical Terms, 2012-2023
- Market Structure – Domestic Supply vs. Imports, In Value Terms, 2012-2023
- Trade Balance, In Physical Terms, 2012-2023
- Trade Balance, In Value Terms, 2012-2023
- Per Capita Consumption, 2012-2023
- Market Volume Forecast to 2030
- Market Value Forecast to 2030
- Products: Market Size And Growth, By Type
- Products: Average Per Capita Consumption, By Type
- Products: Exports And Growth, By Type
- Products: Export Prices And Growth, By Type
- Production Volume And Growth
- Exports And Growth
- Export Prices And Growth
- Market Size And Growth
- Per Capita Consumption
- Imports And Growth
- Import Prices
- Production, In Physical Terms, 2012–2023
- Production, In Value Terms, 2012–2023
- Imports, In Physical Terms, 2012–2023
- Imports, In Value Terms, 2012–2023
- Imports, In Physical Terms, By Country, 2023
- Imports, In Physical Terms, By Country, 2012–2023
- Imports, In Value Terms, By Country, 2012–2023
- Import Prices, By Country Of Origin, 2012–2023
- Exports, In Physical Terms, 2012–2023
- Exports, In Value Terms, 2012–2023
- Exports, In Physical Terms, By Country, 2023
- Exports, In Physical Terms, By Country, 2012–2023
- Exports, In Value Terms, By Country, 2012–2023
- Export Prices, By Country Of Destination, 2012–2023


