
Netherlands - Tufted Carpets And Other Tufted Textile Floor Coverings - Market Analysis, Forecast, Size, Trends And Insights
Get instant access to more than 2 million reports, dashboards, and datasets on the IndexBox Platform.
View PricingDramatic Decline: Netherlands' August 2023 Carpet Export Plummets to $5M
Netherlands Tufted Carpet Exports
In August 2023, after three months of growth, there was significant decline in shipments abroad of tufted carpets and other tufted textile floor coverings, when their volume decreased by -38% to 363K square meters. Over the period under review, exports continue to indicate a relatively flat trend pattern. The pace of growth appeared the most rapid in March 2023 when exports increased by 77% m-o-m. As a result, the exports reached the peak of 888K square meters. From April 2023 to August 2023, the growth of the exports remained at a lower figure.
In value terms, tufted carpet exports shrank markedly to $5M (IndexBox estimates) in August 2023. In general, exports continue to indicate a mild reduction. The most prominent rate of growth was recorded in March 2023 when exports increased by 40% m-o-m. The exports peaked at 8.1M square meters in November 2022; however, from December 2022 to August 2023, the exports remained at a lower figure.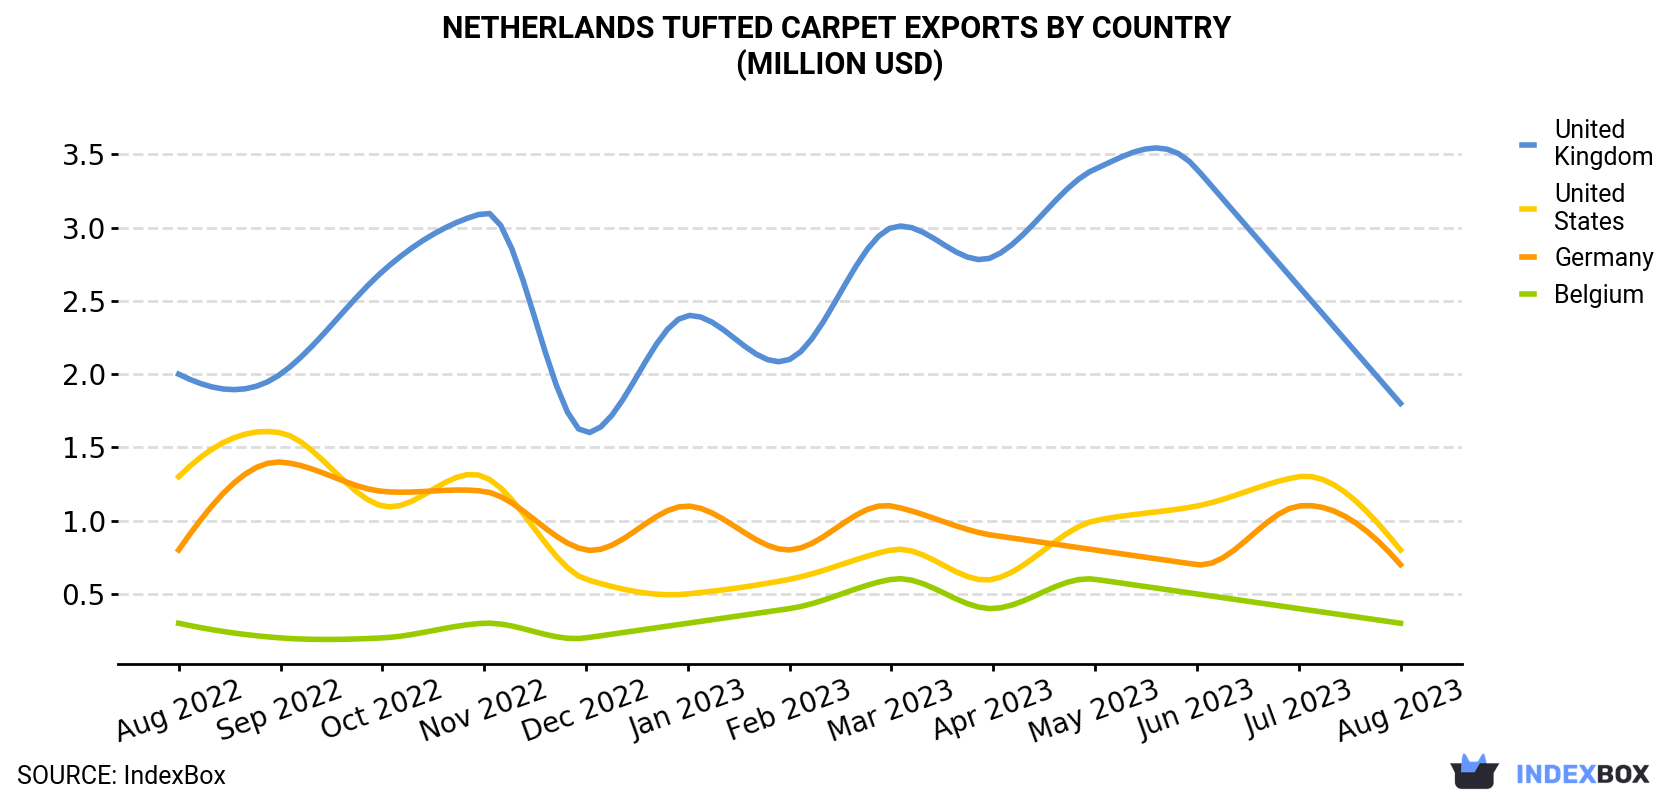
| COUNTRY | Export Value of Tufted Carpet in Netherlands (million USD) | ||||||||||||
|---|---|---|---|---|---|---|---|---|---|---|---|---|---|
| Aug 2022 | Sep 2022 | Oct 2022 | Nov 2022 | Dec 2022 | Jan 2023 | Feb 2023 | Mar 2023 | Apr 2023 | May 2023 | Jun 2023 | Jul 2023 | Aug 2023 | |
| United Kingdom | 2.0 | 2.0 | 2.7 | 3.1 | 1.6 | 2.4 | 2.1 | 3.0 | 2.8 | 3.4 | 3.4 | 2.6 | 1.8 |
| United States | 1.3 | 1.6 | 1.1 | 1.3 | 0.6 | 0.5 | 0.6 | 0.8 | 0.6 | 1.0 | 1.1 | 1.3 | 0.8 |
| Germany | 0.8 | 1.4 | 1.2 | 1.2 | 0.8 | 1.1 | 0.8 | 1.1 | 0.9 | 0.8 | 0.7 | 1.1 | 0.7 |
| Belgium | 0.3 | 0.2 | 0.2 | 0.3 | 0.2 | 0.3 | 0.4 | 0.6 | 0.4 | 0.6 | 0.5 | 0.4 | 0.3 |
| Others | 1.5 | 1.9 | 2.3 | 2.2 | 1.6 | 1.8 | 1.8 | 2.6 | 1.8 | 1.6 | 2.1 | 1.6 | 1.5 |
| Total | 5.9 | 7.2 | 7.5 | 8.1 | 4.8 | 6.2 | 5.8 | 8.1 | 6.4 | 7.4 | 7.9 | 7.0 | 5.0 |
Exports by Country
Belgium (137K square meters), the UK (93K square meters) and the United States (39K square meters) were the main destinations of tufted carpet exports from the Netherlands, together comprising 74% of total exports.
From August 2022 to August 2023, the biggest increases were in Belgium (with a CAGR of +7.3%), while shipments for the other leaders experienced a decline.
In value terms, the UK ($1.8M) remains the key foreign market for tufted carpet exports from the Netherlands, comprising 35% of total exports. The second position in the ranking was held by the United States ($795K), with a 16% share of total exports. It was followed by Germany, with a 13% share.
From August 2022 to August 2023, the average monthly growth rate of value to the UK was relatively modest. Exports to the other major destinations recorded the following average monthly rates of exports growth: the United States (-4.3% per month) and Germany (-1.3% per month).
Exports by Type
Carpets and other textile floor coverings; tufted, of textile materials (other than man-made, wool or fine animal hair), whether or not made up (206K square meters) and carpets and other textile floor coverings; tufted, of wool or fine animal hair, whether or not made up (157K square meters) were the main products of tufted carpet exports from the Netherlands.
From August 2022 to August 2023, the biggest increases were in carpets and other textile floor coverings; tufted, of textile materials (other than man-made, wool or fine animal hair), whether or not made up (with a CAGR of +1.1%).
In value terms, carpets and other textile floor coverings; tufted, of wool or fine animal hair, whether or not made up ($3.8M) remains the largest type of tufted carpet exported from the Netherlands, comprising 76% of total exports. The second position in the ranking was taken by carpets and other textile floor coverings; tufted, of textile materials (other than man-made, wool or fine animal hair), whether or not made up ($1.2M), with a 24% share of total exports.
From August 2022 to August 2023, the average monthly rate of growth in terms of the export volume of carpets and other textile floor coverings; tufted, of wool or fine animal hair, whether or not made up totaled -1.1%.
Export Prices by Country
In August 2023, the tufted carpet price stood at $13.6 per square meter (FOB, Netherlands), with an increase of 13% against the previous month. Overall, the export price, however, recorded a slight downturn. The most prominent rate of growth was recorded in December 2022 an increase of 75% m-o-m. As a result, the export price reached the peak level of $23,470 per thousand square meters. From January 2023 to August 2023, the the average export prices remained at a lower figure.
There were significant differences in the average prices for the major external markets. In August 2023, the country with the highest price was Australia ($26.8 per square meter), while the average price for exports to Belgium ($1.9 per square meter) was amongst the lowest.
From August 2022 to August 2023, the most notable rate of growth in terms of prices was recorded for supplies to Germany (+1.7%), while the prices for the other major destinations experienced more modest paces of growth.
This report provides an in-depth analysis of the tufted carpet market in the Netherlands. Within it, you will discover the latest data on market trends and opportunities by country, consumption, production and price developments, as well as the global trade (imports and exports). The forecast exhibits the market prospects through 2030.
Product coverage:
- Prodcom 13931300 - Tufted carpets and other tufted textile floor coverings
Country coverage:
- Netherlands
Data coverage:
- Market volume and value
- Per Capita consumption
- Forecast of the market dynamics in the medium term
- Trade (exports and imports) in the Netherlands
- Export and import prices
- Market trends, drivers and restraints
- Key market players and their profiles
Reasons to buy this report:
- Take advantage of the latest data
- Find deeper insights into current market developments
- Discover vital success factors affecting the market
This report is designed for manufacturers, distributors, importers, and wholesalers, as well as for investors, consultants and advisors.
In this report, you can find information that helps you to make informed decisions on the following issues:
- How to diversify your business and benefit from new market opportunities
- How to load your idle production capacity
- How to boost your sales on overseas markets
- How to increase your profit margins
- How to make your supply chain more sustainable
- How to reduce your production and supply chain costs
- How to outsource production to other countries
- How to prepare your business for global expansion
While doing this research, we combine the accumulated expertise of our analysts and the capabilities of artificial intelligence. The AI-based platform, developed by our data scientists, constitutes the key working tool for business analysts, empowering them to discover deep insights and ideas from the marketing data.
-
1. INTRODUCTION
Making Data-Driven Decisions to Grow Your Business
- REPORT DESCRIPTION
- RESEARCH METHODOLOGY AND AI PLATFORM
- DATA-DRIVEN DECISIONS FOR YOUR BUSINESS
- GLOSSARY AND SPECIFIC TERMS
-
2. EXECUTIVE SUMMARY
A Quick Overview of Market Performance
- KEY FINDINGS
- MARKET TRENDS This Chapter is Available Only for the Professional Edition PRO
-
3. MARKET OVERVIEW
Understanding the Current State of The Market and Its Prospects
- MARKET SIZE
- MARKET STRUCTURE
- TRADE BALANCE
- PER CAPITA CONSUMPTION
- MARKET FORECAST TO 2030
-
4. MOST PROMISING PRODUCT
Finding New Products to Diversify Your Business
This Chapter is Available Only for the Professional Edition PRO- TOP PRODUCTS TO DIVERSIFY YOUR BUSINESS
- BEST-SELLING PRODUCTS
- MOST CONSUMED PRODUCT
- MOST TRADED PRODUCT
- MOST PROFITABLE PRODUCT FOR EXPORT
-
5. MOST PROMISING SUPPLYING COUNTRIES
Choosing the Best Countries to Establish Your Sustainable Supply Chain
This Chapter is Available Only for the Professional Edition PRO- TOP COUNTRIES TO SOURCE YOUR PRODUCT
- TOP PRODUCING COUNTRIES
- TOP EXPORTING COUNTRIES
- LOW-COST EXPORTING COUNTRIES
-
6. MOST PROMISING OVERSEAS MARKETS
Choosing the Best Countries to Boost Your Exports
This Chapter is Available Only for the Professional Edition PRO- TOP OVERSEAS MARKETS FOR EXPORTING YOUR PRODUCT
- TOP CONSUMING MARKETS
- UNSATURATED MARKETS
- TOP IMPORTING MARKETS
- MOST PROFITABLE MARKETS
7. PRODUCTION
The Latest Trends and Insights into The Industry
- PRODUCTION VOLUME AND VALUE
8. IMPORTS
The Largest Import Supplying Countries
- IMPORTS FROM 2012–2023
- IMPORTS BY COUNTRY
- IMPORT PRICES BY COUNTRY
9. EXPORTS
The Largest Destinations for Exports
- EXPORTS FROM 2012–2023
- EXPORTS BY COUNTRY
- EXPORT PRICES BY COUNTRY
-
10. PROFILES OF MAJOR PRODUCERS
The Largest Producers on The Market and Their Profiles
This Chapter is Available Only for the Professional Edition PRO -
LIST OF TABLES
- Key Findings In 2023
- Market Volume, In Physical Terms, 2012–2023
- Market Value, 2012–2023
- Per Capita Consumption In 2012-2023
- Imports, In Physical Terms, By Country, 2012–2023
- Imports, In Value Terms, By Country, 2012–2023
- Import Prices, By Country Of Origin, 2012–2023
- Exports, In Physical Terms, By Country, 2012–2023
- Exports, In Value Terms, By Country, 2012–2023
- Export Prices, By Country Of Destination, 2012–2023
-
LIST OF FIGURES
- Market Volume, In Physical Terms, 2012–2023
- Market Value, 2012–2023
- Market Structure – Domestic Supply vs. Imports, In Physical Terms, 2012-2023
- Market Structure – Domestic Supply vs. Imports, In Value Terms, 2012-2023
- Trade Balance, In Physical Terms, 2012-2023
- Trade Balance, In Value Terms, 2012-2023
- Per Capita Consumption, 2012-2023
- Market Volume Forecast to 2030
- Market Value Forecast to 2030
- Products: Market Size And Growth, By Type
- Products: Average Per Capita Consumption, By Type
- Products: Exports And Growth, By Type
- Products: Export Prices And Growth, By Type
- Production Volume And Growth
- Exports And Growth
- Export Prices And Growth
- Market Size And Growth
- Per Capita Consumption
- Imports And Growth
- Import Prices
- Production, In Physical Terms, 2012–2023
- Production, In Value Terms, 2012–2023
- Imports, In Physical Terms, 2012–2023
- Imports, In Value Terms, 2012–2023
- Imports, In Physical Terms, By Country, 2023
- Imports, In Physical Terms, By Country, 2012–2023
- Imports, In Value Terms, By Country, 2012–2023
- Import Prices, By Country Of Origin, 2012–2023
- Exports, In Physical Terms, 2012–2023
- Exports, In Value Terms, 2012–2023
- Exports, In Physical Terms, By Country, 2023
- Exports, In Physical Terms, By Country, 2012–2023
- Exports, In Value Terms, By Country, 2012–2023
- Export Prices, By Country Of Destination, 2012–2023


