
Netherlands - Loudspeakers - Market Analysis, Forecast, Size, Trends and Insights
Get instant access to more than 2 million reports, dashboards, and datasets on the IndexBox Platform.
View PricingDecline in Loudspeaker Exports From the Netherlands to $1.1B by 2023
Netherlands Loudspeaker Exports
In 2023, overseas shipments of loudspeakers decreased by -6% to 22M units for the first time since 2019, thus ending a three-year rising trend. In general, exports, however, continue to indicate a prominent expansion. The pace of growth appeared the most rapid in 2020 with an increase of 142% against the previous year. The exports peaked at 24M units in 2022, and then reduced in the following year.
In value terms, loudspeaker exports shrank notably to $1.1B (IndexBox estimates) in 2023. Over the period under review, exports, however, showed buoyant growth. The most prominent rate of growth was recorded in 2020 when exports increased by 317% against the previous year. The exports peaked at $1.3B in 2022, and then declined sharply in the following year.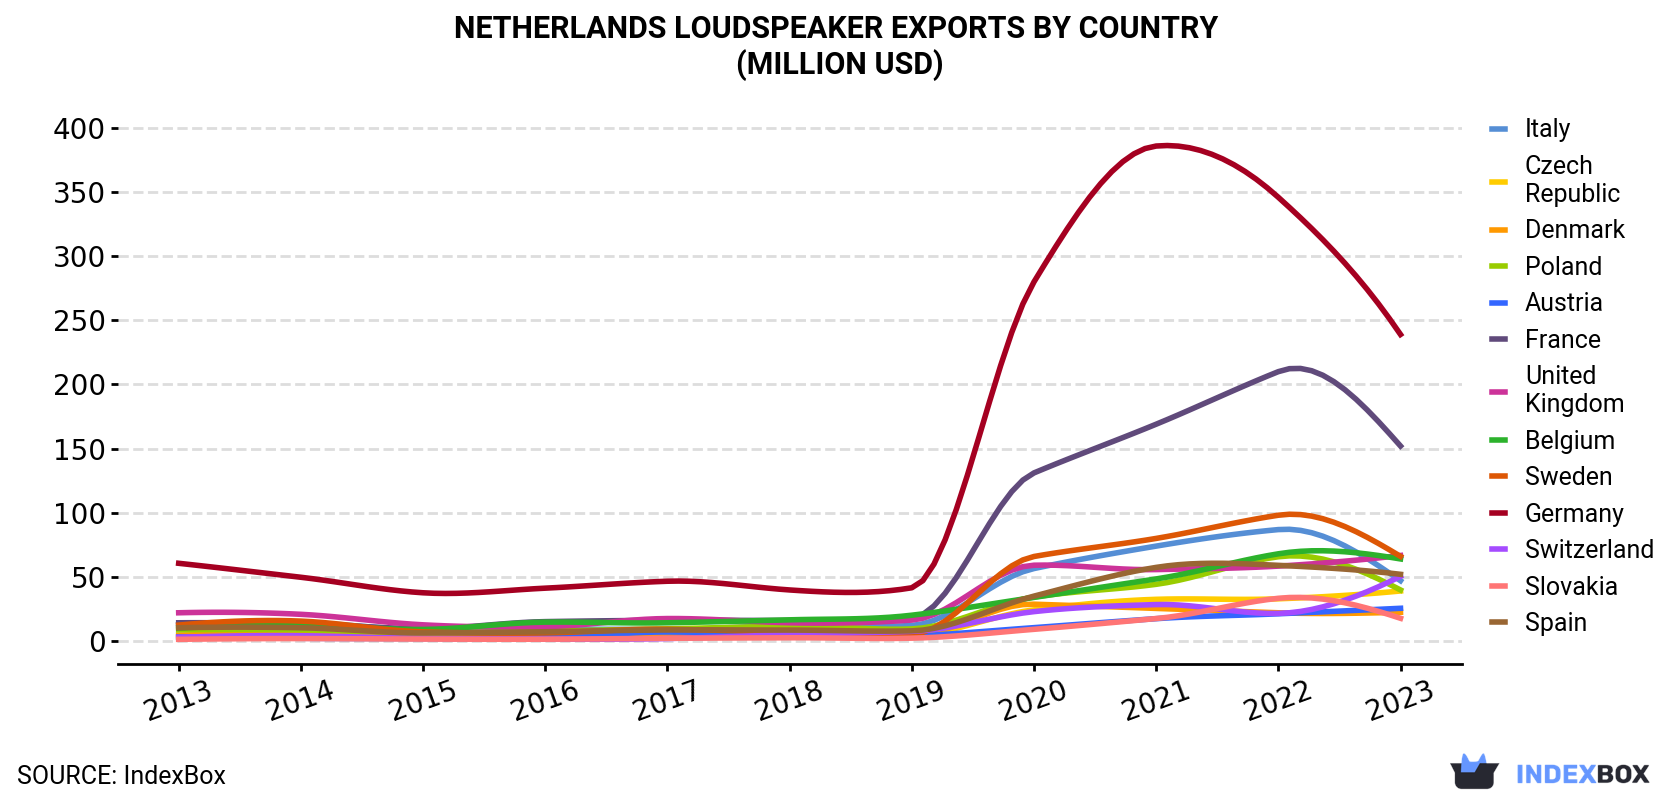
| COUNTRY | Export Value of Loudspeaker in Netherlands (million USD) | ||||||||||
|---|---|---|---|---|---|---|---|---|---|---|---|
| 2013 | 2014 | 2015 | 2016 | 2017 | 2018 | 2019 | 2020 | 2021 | 2022 | 2023 | |
| Germany | 60.5 | 49.6 | 37.5 | 41.1 | 46.5 | 39.7 | 41.4 | 280 | 386 | 346 | 239 |
| France | 14.1 | 13.3 | 9.5 | 15.0 | 16.0 | 15.9 | 17.9 | 131 | 169 | 210 | 152 |
| United Kingdom | 21.9 | 20.7 | 12.5 | 11.1 | 17.4 | 14.1 | 16.2 | 59.0 | 55.6 | 58.3 | 66.6 |
| Sweden | 12.3 | 15.4 | 7.0 | 6.2 | 9.0 | 6.9 | 5.4 | 65.8 | 79.9 | 98.0 | 65.9 |
| Belgium | 10.0 | 12.0 | 8.9 | 14.6 | 14.1 | 16.4 | 20.0 | 33.9 | 48.3 | 67.9 | 63.9 |
| Spain | 10.2 | 10.2 | 6.2 | 7.1 | 8.5 | 8.4 | 7.8 | 34.9 | 57.3 | 58.9 | 51.9 |
| Switzerland | 2.8 | 4.0 | 1.9 | 1.4 | 1.8 | 4.9 | 7.4 | 22.8 | 28.3 | 21.4 | 50.3 |
| Italy | 12.6 | 14.3 | 8.9 | 9.2 | 8.9 | 12.5 | 12.0 | 56.4 | 73.9 | 86.8 | 46.9 |
| Poland | 8.6 | 8.6 | 6.4 | 7.6 | 9.4 | 11.6 | 9.3 | 34.2 | 44.1 | 65.6 | 39.7 |
| Czech Republic | 3.0 | 3.7 | 2.0 | 2.2 | 3.5 | 3.6 | 4.5 | 24.2 | 32.4 | 32.8 | 38.9 |
| Austria | 3.0 | 2.0 | 1.8 | 2.4 | 6.9 | 5.5 | 3.4 | 10.3 | 17.3 | 21.1 | 25.4 |
| Denmark | 4.5 | 5.1 | 2.8 | 2.8 | 3.0 | 3.3 | 4.0 | 28.6 | 25.3 | 21.9 | 22.3 |
| Slovakia | 1.2 | 1.8 | 1.4 | 1.3 | 2.0 | 2.4 | 2.1 | 9.0 | 17.4 | 33.2 | 17.6 |
| Others | 48.9 | 44.1 | 36.5 | 34.8 | 43.4 | 62.9 | 75.3 | 155 | 199 | 199 | 184 |
| Total | 214 | 205 | 143 | 157 | 190 | 208 | 227 | 946 | 1,234 | 1,322 | 1,064 |
Exports by Country
Germany (5.8M units), France (3.7M units) and Belgium (2.1M units) were the main destinations of loudspeaker exports from the Netherlands, with a combined 52% share of total exports. the UK, Poland, Sweden, Spain, Italy, Switzerland, the Czech Republic, Slovakia, Austria and Denmark lagged somewhat behind, together comprising a further 35%.
From 2013 to 2023, the most notable rate of growth in terms of shipments, amongst the main countries of destination, was attained by Switzerland (with a CAGR of +33.9%), while the other leaders experienced more modest paces of growth.
In value terms, the largest markets for loudspeaker exported from the Netherlands were Germany ($239M), France ($152M) and the UK ($67M), with a combined 43% share of total exports. Sweden, Belgium, Spain, Switzerland, Italy, Poland, the Czech Republic, Austria, Denmark and Slovakia lagged somewhat behind, together comprising a further 40%.
Switzerland, with a CAGR of +33.7%, saw the highest rates of growth with regard to the value of exports, in terms of the main countries of destination over the period under review, while shipments for the other leaders experienced more modest paces of growth.
Exports by Type
Multiple loudspeakers (in enclosure) (11M units), single loudspeakers (in enclosure) (8.2M units) and loudspeakers (not in enclosure) (3.5M units) were the main products of loudspeaker exports from the Netherlands, together comprising 99.9% of total exports.
From 2013 to 2023, the most notable rate of growth in terms of shipments, amongst the major product types, was attained by multiple loudspeakers (in enclosure) (with a CAGR of +18.3%), while the other products experienced more modest paces of growth.
In value terms, multiple loudspeakers (in enclosure) ($736M) remains the largest type of loudspeakers exported from the Netherlands, comprising 69% of total exports. The second position in the ranking was held by single loudspeakers (in enclosure) ($253M), with a 24% share of total exports.
From 2013 to 2023, the average annual growth rate of the value of multiple loudspeakers (in enclosure) exports totaled +18.2%. With regard to the other exported products, the following average annual rates of growth were recorded: single loudspeakers (in enclosure) (+17.5% per year) and loudspeakers (not in enclosure) (+11.7% per year).
Export Prices by Country
In 2023, the loudspeaker price stood at $47 per unit (FOB, Netherlands), falling by -14.3% against the previous year. In general, the export price, however, showed mild growth. The growth pace was the most rapid in 2020 when the average export price increased by 72%. The export price peaked at $55 per unit in 2022, and then shrank in the following year.
Prices varied noticeably by country of destination: amid the top suppliers, the country with the highest price was Switzerland ($78 per unit), while the average price for exports to Belgium ($30 per unit) was amongst the lowest.
From 2013 to 2023, the most notable rate of growth in terms of prices was recorded for supplies to the Czech Republic (+9.9%), while the prices for the other major destinations experienced more modest paces of growth.
This report provides an in-depth analysis of the loudspeaker market in the Netherlands. Within it, you will discover the latest data on market trends and opportunities by country, consumption, production and price developments, as well as the global trade (imports and exports). The forecast exhibits the market prospects through 2030.
Product coverage:
- Prodcom 26404235 - Single loudspeakers mounted in their enclosures (including frames or cabinets mainly designed for mounting loudspeakers)
- Prodcom 26404237 - Multiple loudspeakers mounted in the same enclosure (including frames or cabinets mainly designed for mounting loudspeakers)
- Prodcom 26404239 - Loudspeakers (including speaker drive units, frames or cabinets mainly designed for mounting loudspeakers) (excluding those mounted in their enclosures)
Country coverage:
- Netherlands
Data coverage:
- Market volume and value
- Per Capita consumption
- Forecast of the market dynamics in the medium term
- Trade (exports and imports) in the Netherlands
- Export and import prices
- Market trends, drivers and restraints
- Key market players and their profiles
Reasons to buy this report:
- Take advantage of the latest data
- Find deeper insights into current market developments
- Discover vital success factors affecting the market
This report is designed for manufacturers, distributors, importers, and wholesalers, as well as for investors, consultants and advisors.
In this report, you can find information that helps you to make informed decisions on the following issues:
- How to diversify your business and benefit from new market opportunities
- How to load your idle production capacity
- How to boost your sales on overseas markets
- How to increase your profit margins
- How to make your supply chain more sustainable
- How to reduce your production and supply chain costs
- How to outsource production to other countries
- How to prepare your business for global expansion
While doing this research, we combine the accumulated expertise of our analysts and the capabilities of artificial intelligence. The AI-based platform, developed by our data scientists, constitutes the key working tool for business analysts, empowering them to discover deep insights and ideas from the marketing data.
-
1. INTRODUCTION
Making Data-Driven Decisions to Grow Your Business
- REPORT DESCRIPTION
- RESEARCH METHODOLOGY AND AI PLATFORM
- DATA-DRIVEN DECISIONS FOR YOUR BUSINESS
- GLOSSARY AND SPECIFIC TERMS
-
2. EXECUTIVE SUMMARY
A Quick Overview of Market Performance
- KEY FINDINGS
- MARKET TRENDS This Chapter is Available Only for the Professional Edition PRO
-
3. MARKET OVERVIEW
Understanding the Current State of The Market and Its Prospects
- MARKET SIZE
- MARKET STRUCTURE
- TRADE BALANCE
- PER CAPITA CONSUMPTION
- MARKET FORECAST TO 2030
-
4. MOST PROMISING PRODUCT
Finding New Products to Diversify Your Business
This Chapter is Available Only for the Professional Edition PRO- TOP PRODUCTS TO DIVERSIFY YOUR BUSINESS
- BEST-SELLING PRODUCTS
- MOST CONSUMED PRODUCT
- MOST TRADED PRODUCT
- MOST PROFITABLE PRODUCT FOR EXPORT
-
5. MOST PROMISING SUPPLYING COUNTRIES
Choosing the Best Countries to Establish Your Sustainable Supply Chain
This Chapter is Available Only for the Professional Edition PRO- TOP COUNTRIES TO SOURCE YOUR PRODUCT
- TOP PRODUCING COUNTRIES
- TOP EXPORTING COUNTRIES
- LOW-COST EXPORTING COUNTRIES
-
6. MOST PROMISING OVERSEAS MARKETS
Choosing the Best Countries to Boost Your Exports
This Chapter is Available Only for the Professional Edition PRO- TOP OVERSEAS MARKETS FOR EXPORTING YOUR PRODUCT
- TOP CONSUMING MARKETS
- UNSATURATED MARKETS
- TOP IMPORTING MARKETS
- MOST PROFITABLE MARKETS
7. PRODUCTION
The Latest Trends and Insights into The Industry
- PRODUCTION VOLUME AND VALUE
8. IMPORTS
The Largest Import Supplying Countries
- IMPORTS FROM 2012–2023
- IMPORTS BY COUNTRY
- IMPORT PRICES BY COUNTRY
9. EXPORTS
The Largest Destinations for Exports
- EXPORTS FROM 2012–2023
- EXPORTS BY COUNTRY
- EXPORT PRICES BY COUNTRY
-
10. PROFILES OF MAJOR PRODUCERS
The Largest Producers on The Market and Their Profiles
This Chapter is Available Only for the Professional Edition PRO -
LIST OF TABLES
- Key Findings In 2023
- Market Volume, In Physical Terms, 2012–2023
- Market Value, 2012–2023
- Per Capita Consumption In 2012-2023
- Imports, In Physical Terms, By Country, 2012–2023
- Imports, In Value Terms, By Country, 2012–2023
- Import Prices, By Country Of Origin, 2012–2023
- Exports, In Physical Terms, By Country, 2012–2023
- Exports, In Value Terms, By Country, 2012–2023
- Export Prices, By Country Of Destination, 2012–2023
-
LIST OF FIGURES
- Market Volume, In Physical Terms, 2012–2023
- Market Value, 2012–2023
- Market Structure – Domestic Supply vs. Imports, In Physical Terms, 2012-2023
- Market Structure – Domestic Supply vs. Imports, In Value Terms, 2012-2023
- Trade Balance, In Physical Terms, 2012-2023
- Trade Balance, In Value Terms, 2012-2023
- Per Capita Consumption, 2012-2023
- Market Volume Forecast to 2030
- Market Value Forecast to 2030
- Products: Market Size And Growth, By Type
- Products: Average Per Capita Consumption, By Type
- Products: Exports And Growth, By Type
- Products: Export Prices And Growth, By Type
- Production Volume And Growth
- Exports And Growth
- Export Prices And Growth
- Market Size And Growth
- Per Capita Consumption
- Imports And Growth
- Import Prices
- Production, In Physical Terms, 2012–2023
- Production, In Value Terms, 2012–2023
- Imports, In Physical Terms, 2012–2023
- Imports, In Value Terms, 2012–2023
- Imports, In Physical Terms, By Country, 2023
- Imports, In Physical Terms, By Country, 2012–2023
- Imports, In Value Terms, By Country, 2012–2023
- Import Prices, By Country Of Origin, 2012–2023
- Exports, In Physical Terms, 2012–2023
- Exports, In Value Terms, 2012–2023
- Exports, In Physical Terms, By Country, 2023
- Exports, In Physical Terms, By Country, 2012–2023
- Exports, In Value Terms, By Country, 2012–2023
- Export Prices, By Country Of Destination, 2012–2023


