Hong Kong SAR, China - Loudspeakers - Market Analysis, Forecast, Size, Trends and Insights
Get instant access to more than 2 million reports, dashboards, and datasets on the IndexBox Platform.
View PricingHong Kongs Loudspeaker Price Decreases by 6%, With Average Unit Price of $3.4
Hong Kong Loudspeaker Export Price in June 2023
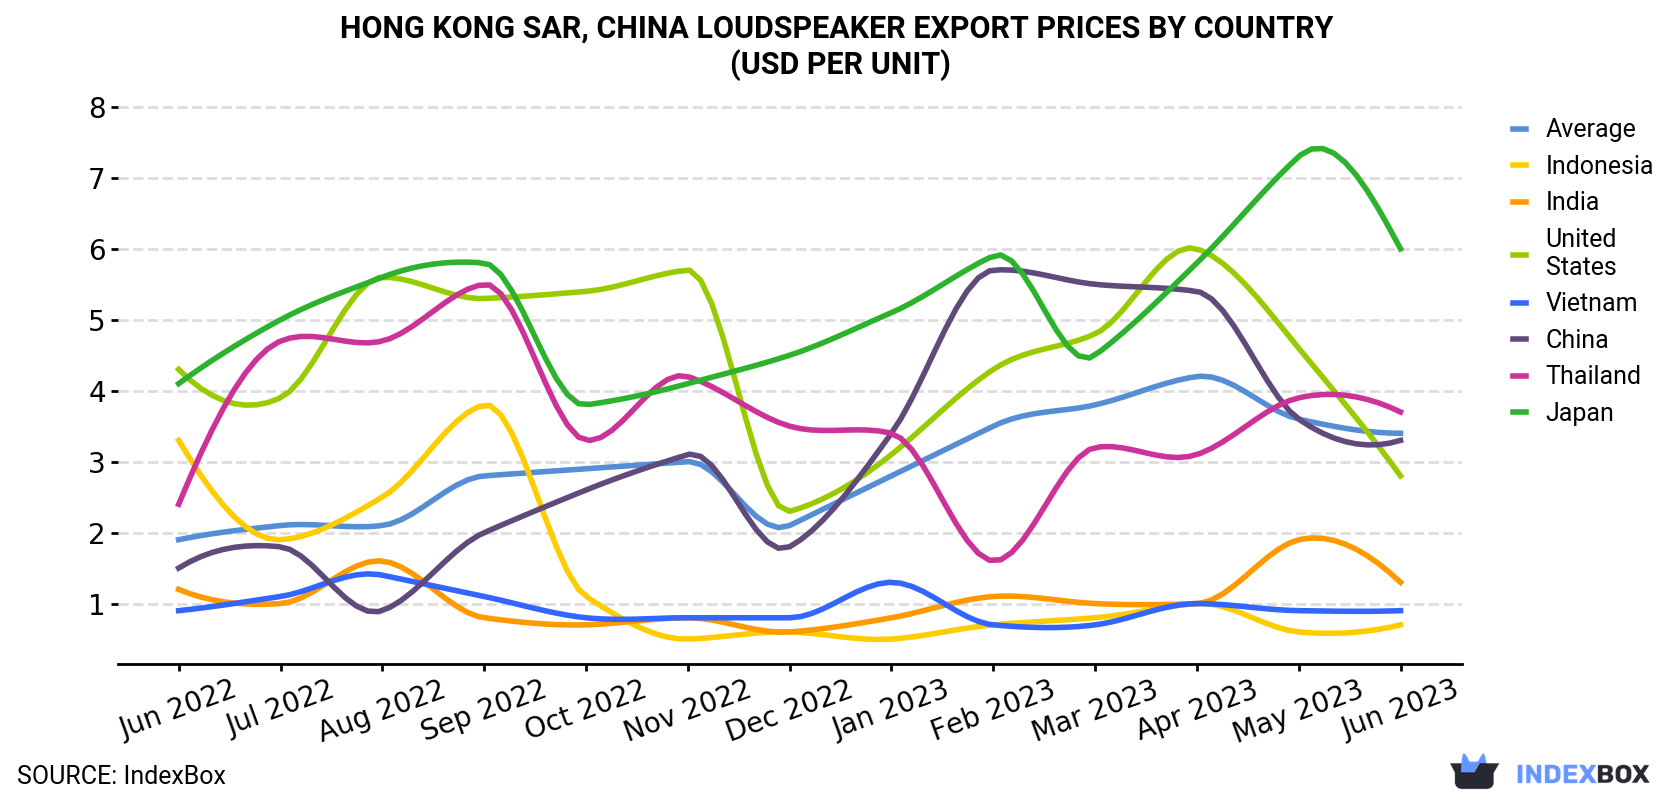
In June 2023, the loudspeaker price stood at $3.4 per unit (FOB, Hong Kong), dropping by -6.4% against the previous month. Over the period under review, export price indicated notable growth from June 2022 to June 2023: its price increased at an average monthly rate of +4.9% over the last twelve-month period. The trend pattern, however, indicated some noticeable fluctuations being recorded throughout the analyzed period. Based on June 2023 figures, loudspeaker export price decreased by -20.7% against April 2023 indices. The pace of growth appeared the most rapid in January 2023 when the average export price increased by 31% m-o-m. The export price peaked at $4.2 per unit in April 2023; however, from May 2023 to June 2023, the export prices remained at a lower figure.
There were significant differences in the average prices for the major export markets. In June 2023, the country with the highest price was Japan ($6.0 per unit), while the average price for exports to Indonesia ($741 per thousand units) was amongst the lowest.
From June 2022 to June 2023, the most notable rate of growth in terms of prices was recorded for supplies to China (+7.2%), while the prices for the other major destinations experienced more modest paces of growth.
| COUNTRY | Export Price of Loudspeaker in Hong Kong (USD per unit) | ||||||||||||
|---|---|---|---|---|---|---|---|---|---|---|---|---|---|
| Jun 2022 | Jul 2022 | Aug 2022 | Sep 2022 | Oct 2022 | Nov 2022 | Dec 2022 | Jan 2023 | Feb 2023 | Mar 2023 | Apr 2023 | May 2023 | Jun 2023 | |
| Japan | 4.1 | 5.0 | 5.6 | 5.8 | 3.8 | 4.1 | 4.5 | 5.1 | 5.9 | 4.5 | 5.8 | 7.3 | 6.0 |
| Thailand | 2.4 | 4.7 | 4.7 | 5.5 | 3.3 | 4.2 | 3.5 | 3.4 | 1.6 | 3.2 | 3.1 | 3.9 | 3.7 |
| China | 1.5 | 1.8 | 0.9 | 2.0 | 2.6 | 3.1 | 1.8 | 3.4 | 5.7 | 5.5 | 5.4 | 3.6 | 3.3 |
| United States | 4.3 | 3.9 | 5.6 | 5.3 | 5.4 | 5.7 | 2.3 | 3.1 | 4.3 | 4.8 | 6.0 | 4.6 | 2.8 |
| India | 1.2 | 1.0 | 1.6 | 0.8 | 0.7 | 0.8 | 0.6 | 0.8 | 1.1 | 1.0 | 1.0 | 1.9 | 1.3 |
| Vietnam | 0.9 | 1.1 | 1.4 | 1.1 | 0.8 | 0.8 | 0.8 | 1.3 | 0.7 | 0.7 | 1.0 | 0.9 | 0.9 |
| Indonesia | 3.3 | 1.9 | 2.5 | 3.8 | 1.1 | 0.5 | 0.6 | 0.5 | 0.7 | 0.8 | 1.0 | 0.6 | 0.7 |
| Average | 1.9 | 2.1 | 2.1 | 2.8 | 2.9 | 3.0 | 2.1 | 2.8 | 3.5 | 3.8 | 4.2 | 3.6 | 3.4 |
Hong Kong Loudspeaker Export Prices by Type
There were significant differences in the average prices for the major types of exported product. In June 2023, the product with the highest price was multiple loudspeakers (in enclosure) ($44.6 per unit), while the average price for exports of loudspeakers (not in enclosure) ($1.3 per unit) was amongst the lowest.
From June 2022 to June 2023, the most notable rate of growth in terms of prices was recorded for the following types: loudspeaker (+6.1%), while the prices for the other products experienced mixed trend patterns.
Hong Kong Loudspeaker Exports
In June 2023, the amount of loudspeakers exported from Hong Kong skyrocketed to 16M units, increasing by 17% compared with the month before. Overall, exports, however, saw a noticeable reduction. The pace of growth appeared the most rapid in March 2023 with an increase of 27% month-to-month. Over the period under review, the exports reached the maximum at 28M units in June 2022; however, from July 2022 to June 2023, the exports remained at a lower figure.
In value terms, loudspeaker exports expanded remarkably to $53M (IndexBox estimates) in June 2023. Over the period under review, exports continue to indicate a relatively flat trend pattern. The growth pace was the most rapid in March 2023 with an increase of 37% month-to-month. Over the period under review, the exports reached the peak figure at 56M units in August 2022; however, from September 2022 to June 2023, the exports failed to regain momentum.
Hong Kong Loudspeaker Exports by Type
Loudspeakers (not in enclosure) (15M units) was the largest type of loudspeaker exported from Hong Kong, accounting for a 92% share of total exports. Moreover, loudspeakers (not in enclosure) exceeded the volume of the second product type, single loudspeakers (in enclosure) (813K units), more than tenfold.
From June 2022 to June 2023, the average monthly rate of growth in terms of the volume of export of loudspeakers (not in enclosure) stood at -4.9%. With regard to the other exported products, the following average monthly rates of growth were recorded: single loudspeakers (in enclosure) (+4.3% per month) and multiple loudspeakers (in enclosure) (-1.9% per month).
In value terms, the most traded types of loudspeakers in Hong Kong were loudspeakers (not in enclosure) ($19M), multiple loudspeakers (in enclosure) ($18M) and single loudspeakers (in enclosure) ($17M).
Loudspeaker, with a CAGR of +10.7%, saw the highest growth rate of the value of exports, among the main product categories over the period under review, while shipments for the other products experienced a decline.
Hong Kong Loudspeaker Exports by Country
China (5.9M units) was the main destination for loudspeaker exports from Hong Kong, with a 37% share of total exports. Moreover, loudspeaker exports to China exceeded the volume sent to the second major destination, Vietnam (2.1M units), threefold. The third position in this ranking was taken by Malaysia (1.6M units), with a 10% share.
From June 2022 to June 2023, the average monthly rate of growth in terms of volume to China totaled -5.5%. Exports to the other major destinations recorded the following average monthly rates of exports growth: Vietnam (-9.6% per month) and Malaysia (+10.7% per month).
In value terms, China ($20M) remains the key foreign market for loudspeaker exports from Hong Kong, comprising 37% of total exports. The second position in the ranking was taken by Japan ($4.2M), with a 7.9% share of total exports. It was followed by the United States, with a 6.4% share.
From June 2022 to June 2023, the average monthly rate of growth in terms of value to China totaled +1.2%. Exports to the other major destinations recorded the following average monthly rates of exports growth: Japan (+3.0% per month) and the United States (-4.7% per month).
This report provides an in-depth analysis of the loudspeaker market in Hong Kong SAR, China. Within it, you will discover the latest data on market trends and opportunities by country, consumption, production and price developments, as well as the global trade (imports and exports). The forecast exhibits the market prospects through 2030.
Product coverage:
- Prodcom 26404235 - Single loudspeakers mounted in their enclosures (including frames or cabinets mainly designed for mounting loudspeakers)
- Prodcom 26404237 - Multiple loudspeakers mounted in the same enclosure (including frames or cabinets mainly designed for mounting loudspeakers)
- Prodcom 26404239 - Loudspeakers (including speaker drive units, frames or cabinets mainly designed for mounting loudspeakers) (excluding those mounted in their enclosures)
Country coverage:
- Hong Kong SAR
Data coverage:
- Market volume and value
- Per Capita consumption
- Forecast of the market dynamics in the medium term
- Trade (exports and imports) in Hong Kong SAR, China
- Export and import prices
- Market trends, drivers and restraints
- Key market players and their profiles
Reasons to buy this report:
- Take advantage of the latest data
- Find deeper insights into current market developments
- Discover vital success factors affecting the market
This report is designed for manufacturers, distributors, importers, and wholesalers, as well as for investors, consultants and advisors.
In this report, you can find information that helps you to make informed decisions on the following issues:
- How to diversify your business and benefit from new market opportunities
- How to load your idle production capacity
- How to boost your sales on overseas markets
- How to increase your profit margins
- How to make your supply chain more sustainable
- How to reduce your production and supply chain costs
- How to outsource production to other countries
- How to prepare your business for global expansion
While doing this research, we combine the accumulated expertise of our analysts and the capabilities of artificial intelligence. The AI-based platform, developed by our data scientists, constitutes the key working tool for business analysts, empowering them to discover deep insights and ideas from the marketing data.
-
1. INTRODUCTION
Making Data-Driven Decisions to Grow Your Business
- REPORT DESCRIPTION
- RESEARCH METHODOLOGY AND AI PLATFORM
- DATA-DRIVEN DECISIONS FOR YOUR BUSINESS
- GLOSSARY AND SPECIFIC TERMS
-
2. EXECUTIVE SUMMARY
A Quick Overview of Market Performance
- KEY FINDINGS
- MARKET TRENDS This Chapter is Available Only for the Professional Edition PRO
-
3. MARKET OVERVIEW
Understanding the Current State of The Market and Its Prospects
- MARKET SIZE
- MARKET STRUCTURE
- TRADE BALANCE
- PER CAPITA CONSUMPTION
- MARKET FORECAST TO 2030
-
4. MOST PROMISING PRODUCT
Finding New Products to Diversify Your Business
This Chapter is Available Only for the Professional Edition PRO- TOP PRODUCTS TO DIVERSIFY YOUR BUSINESS
- BEST-SELLING PRODUCTS
- MOST CONSUMED PRODUCT
- MOST TRADED PRODUCT
- MOST PROFITABLE PRODUCT FOR EXPORT
-
5. MOST PROMISING SUPPLYING COUNTRIES
Choosing the Best Countries to Establish Your Sustainable Supply Chain
This Chapter is Available Only for the Professional Edition PRO- TOP COUNTRIES TO SOURCE YOUR PRODUCT
- TOP PRODUCING COUNTRIES
- TOP EXPORTING COUNTRIES
- LOW-COST EXPORTING COUNTRIES
-
6. MOST PROMISING OVERSEAS MARKETS
Choosing the Best Countries to Boost Your Exports
This Chapter is Available Only for the Professional Edition PRO- TOP OVERSEAS MARKETS FOR EXPORTING YOUR PRODUCT
- TOP CONSUMING MARKETS
- UNSATURATED MARKETS
- TOP IMPORTING MARKETS
- MOST PROFITABLE MARKETS
7. PRODUCTION
The Latest Trends and Insights into The Industry
- PRODUCTION VOLUME AND VALUE
8. IMPORTS
The Largest Import Supplying Countries
- IMPORTS FROM 2012–2023
- IMPORTS BY COUNTRY
- IMPORT PRICES BY COUNTRY
9. EXPORTS
The Largest Destinations for Exports
- EXPORTS FROM 2012–2023
- EXPORTS BY COUNTRY
- EXPORT PRICES BY COUNTRY
-
10. PROFILES OF MAJOR PRODUCERS
The Largest Producers on The Market and Their Profiles
This Chapter is Available Only for the Professional Edition PRO -
LIST OF TABLES
- Key Findings In 2023
- Market Volume, In Physical Terms, 2012–2023
- Market Value, 2012–2023
- Per Capita Consumption In 2012-2023
- Imports, In Physical Terms, By Country, 2012–2023
- Imports, In Value Terms, By Country, 2012–2023
- Import Prices, By Country Of Origin, 2012–2023
- Exports, In Physical Terms, By Country, 2012–2023
- Exports, In Value Terms, By Country, 2012–2023
- Export Prices, By Country Of Destination, 2012–2023
-
LIST OF FIGURES
- Market Volume, In Physical Terms, 2012–2023
- Market Value, 2012–2023
- Market Structure – Domestic Supply vs. Imports, In Physical Terms, 2012-2023
- Market Structure – Domestic Supply vs. Imports, In Value Terms, 2012-2023
- Trade Balance, In Physical Terms, 2012-2023
- Trade Balance, In Value Terms, 2012-2023
- Per Capita Consumption, 2012-2023
- Market Volume Forecast to 2030
- Market Value Forecast to 2030
- Products: Market Size And Growth, By Type
- Products: Average Per Capita Consumption, By Type
- Products: Exports And Growth, By Type
- Products: Export Prices And Growth, By Type
- Production Volume And Growth
- Exports And Growth
- Export Prices And Growth
- Market Size And Growth
- Per Capita Consumption
- Imports And Growth
- Import Prices
- Production, In Physical Terms, 2012–2023
- Production, In Value Terms, 2012–2023
- Imports, In Physical Terms, 2012–2023
- Imports, In Value Terms, 2012–2023
- Imports, In Physical Terms, By Country, 2023
- Imports, In Physical Terms, By Country, 2012–2023
- Imports, In Value Terms, By Country, 2012–2023
- Import Prices, By Country Of Origin, 2012–2023
- Exports, In Physical Terms, 2012–2023
- Exports, In Value Terms, 2012–2023
- Exports, In Physical Terms, By Country, 2023
- Exports, In Physical Terms, By Country, 2012–2023
- Exports, In Value Terms, By Country, 2012–2023
- Export Prices, By Country Of Destination, 2012–2023


