
Latin America and the Caribbean - Mixes And Doughs - Market Analysis, Forecast, Size, Trends And Insights
Get instant access to more than 2 million reports, dashboards, and datasets on the IndexBox Platform.
View PricingLatin America and the Caribbean's Mixes and Doughs Market to Reach 2 Million Tons and $3.3 Billion by 2035
IndexBox has just published a new report: Latin America and the Caribbean - Mixes And Doughs - Market Analysis, Forecast, Size, Trends And Insights.
The Latin America and Caribbean mixes and doughs market reached 1.9 million tons ($2.9B) in 2024, with Brazil, Mexico, and Argentina as top consumers. Driven by regional demand, the market is forecast to grow to 2 million tons ($3.3B) by 2035. Mexico is the largest importer by value, while Brazil, Argentina, and Mexico lead exports. Production is concentrated in Brazil, Mexico, and Argentina. Notable growth is seen in countries like Guatemala for consumption and Paraguay for exports.
Key Findings
- Market forecast to grow to 2M tons ($3.3B) by 2035 from 1.9M tons ($2.9B) in 2024
- Brazil, Mexico, and Argentina are the largest consuming countries by volume, accounting for 57% of the total
- Mexico is the dominant importer, constituting 49% of the region's import value
- Brazil, Argentina, and Mexico are the leading exporters, together representing 64% of export volume
- Guatemala and Paraguay show the highest growth rates in consumption and export value, respectively
Market Forecast
Driven by increasing demand for mixes and doughs in Latin America and the Caribbean, the market is expected to continue an upward consumption trend over the next decade. Market performance is forecast to retain its current trend pattern, expanding with an anticipated CAGR of +0.5% for the period from 2024 to 2035, which is projected to bring the market volume to 2M tons by the end of 2035.
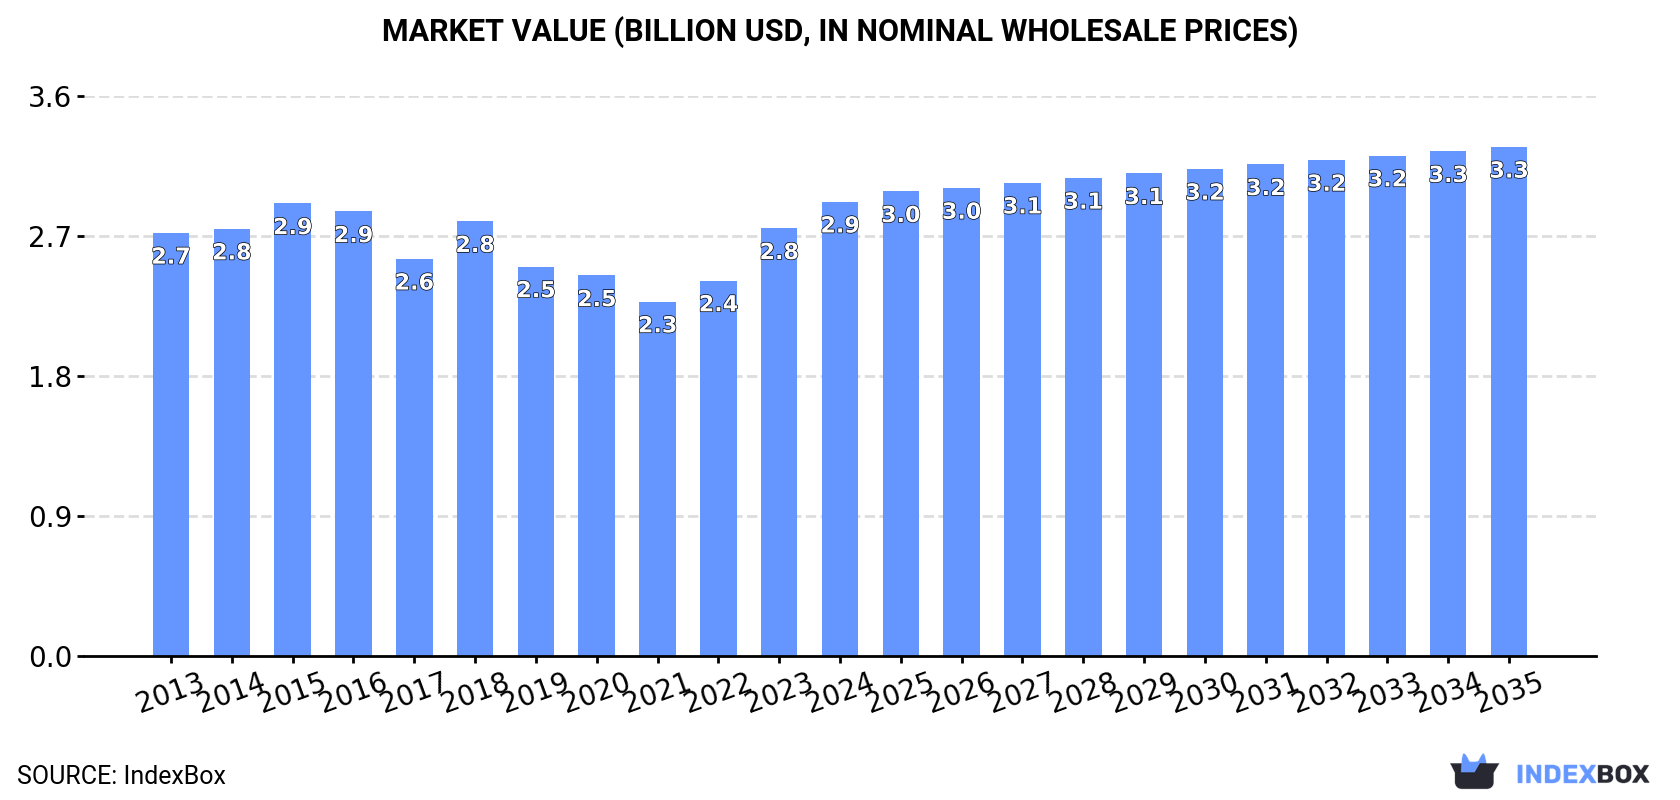
In value terms, the market is forecast to increase with an anticipated CAGR of +1.0% for the period from 2024 to 2035, which is projected to bring the market value to $3.3B (in nominal wholesale prices) by the end of 2035.
Consumption
Latin America and the Caribbean's Consumption of Mixes And Doughs
In 2024, consumption of mixes and doughs increased by 5.1% to 1.9M tons, rising for the second consecutive year after two years of decline. In general, consumption continues to indicate mild growth. The most prominent rate of growth was recorded in 2023 with an increase of 9.4%. The volume of consumption peaked in 2024 and is likely to see steady growth in years to come.
The revenue of the mixes and doughs market in Latin America and the Caribbean expanded notably to $2.9B in 2024, with an increase of 6.2% against the previous year. This figure reflects the total revenues of producers and importers (excluding logistics costs, retail marketing costs, and retailers' margins, which will be included in the final consumer price). Overall, consumption showed a relatively flat trend pattern. The level of consumption peaked in 2024 and is likely to continue growth in the near future.
Consumption By Country
The countries with the highest volumes of consumption in 2024 were Brazil (516K tons), Mexico (377K tons) and Argentina (168K tons), with a combined 57% share of total consumption. Colombia, Venezuela, Peru, Chile, Ecuador, Guatemala and Bolivia lagged somewhat behind, together accounting for a further 28%.
From 2013 to 2024, the most notable rate of growth in terms of consumption, amongst the leading consuming countries, was attained by Guatemala (with a CAGR of +4.5%), while consumption for the other leaders experienced more modest paces of growth.
In value terms, the largest mixes and doughs markets in Latin America and the Caribbean were Brazil ($817M), Mexico ($710M) and Colombia ($226M), together accounting for 60% of the total market. Peru, Chile, Argentina, Venezuela, Guatemala, Ecuador and Bolivia lagged somewhat behind, together comprising a further 25%.
Among the main consuming countries, Guatemala, with a CAGR of +6.3%, recorded the highest growth rate of market size over the period under review, while market for the other leaders experienced more modest paces of growth.
The countries with the highest levels of mixes and doughs per capita consumption in 2024 were Chile (4.1 kg per person), Argentina (3.6 kg per person) and Venezuela (3.1 kg per person).
From 2013 to 2024, the biggest increases were recorded for Guatemala (with a CAGR of +2.8%), while consumption for the other leaders experienced more modest paces of growth.
Production
Latin America and the Caribbean's Production of Mixes And Doughs
In 2024, production of mixes and doughs increased by 2.7% to 1.7M tons, rising for the second consecutive year after two years of decline. In general, production continues to indicate a relatively flat trend pattern. The pace of growth appeared the most rapid in 2023 with an increase of 9.3% against the previous year. The volume of production peaked in 2024 and is expected to retain growth in the near future.
In value terms, mixes and doughs production rose modestly to $2.8B in 2024 estimated in export price. Over the period under review, production saw a relatively flat trend pattern. The pace of growth was the most pronounced in 2023 with an increase of 16% against the previous year. Over the period under review, production hit record highs at $3B in 2015; however, from 2016 to 2024, production failed to regain momentum.
Production By Country
The countries with the highest volumes of production in 2024 were Brazil (533K tons), Mexico (307K tons) and Argentina (184K tons), with a combined 59% share of total production. Colombia, Peru, Chile, Ecuador, Guatemala, Venezuela and Paraguay lagged somewhat behind, together comprising a further 27%.
From 2013 to 2024, the biggest increases were recorded for Paraguay (with a CAGR of +6.4%), while production for the other leaders experienced more modest paces of growth.
Imports
Latin America and the Caribbean's Imports of Mixes And Doughs
After two years of decline, purchases abroad of mixes and doughs increased by 8.2% to 214K tons in 2024. In general, imports, however, saw a relatively flat trend pattern. The pace of growth appeared the most rapid in 2020 when imports increased by 23%. Over the period under review, imports attained the maximum at 248K tons in 2021; however, from 2022 to 2024, imports remained at a lower figure.
In value terms, mixes and doughs imports rose notably to $443M in 2024. Total imports indicated a temperate expansion from 2013 to 2024: its value increased at an average annual rate of +4.4% over the last eleven-year period. The trend pattern, however, indicated some noticeable fluctuations being recorded throughout the analyzed period. Based on 2024 figures, imports increased by +83.4% against 2016 indices. The growth pace was the most rapid in 2021 with an increase of 14% against the previous year. The level of import peaked in 2024 and is likely to see steady growth in years to come.
Imports By Country
Mexico represented the main importer of mixes and doughs in Latin America and the Caribbean, with the volume of imports accounting for 85K tons, which was approx. 39% of total imports in 2024. Venezuela (51K tons) took the second position in the ranking, distantly followed by Guatemala (9.8K tons). All these countries together took near 28% share of total imports. The following importers - Honduras (9K tons), Colombia (7.2K tons), Panama (6.2K tons), El Salvador (6K tons), the Dominican Republic (4.6K tons), Nicaragua (4.6K tons) and Costa Rica (4K tons) - together made up 19% of total imports.
From 2013 to 2024, the biggest increases were recorded for Venezuela (with a CAGR of +47.8%), while purchases for the other leaders experienced more modest paces of growth.
In value terms, Mexico ($217M) constitutes the largest market for imported mixes and doughs in Latin America and the Caribbean, comprising 49% of total imports. The second position in the ranking was held by Venezuela ($43M), with a 9.7% share of total imports. It was followed by Guatemala, with a 5.3% share.
From 2013 to 2024, the average annual rate of growth in terms of value in Mexico stood at +7.4%. The remaining importing countries recorded the following average annual rates of imports growth: Venezuela (+39.9% per year) and Guatemala (+10.1% per year).
Import Prices By Country
The import price in Latin America and the Caribbean stood at $2,068 per ton in 2024, increasing by 5% against the previous year. Import price indicated a buoyant expansion from 2013 to 2024: its price increased at an average annual rate of +5.2% over the last eleven-year period. The trend pattern, however, indicated some noticeable fluctuations being recorded throughout the analyzed period. Based on 2024 figures, mixes and doughs import price increased by +51.1% against 2021 indices. The pace of growth appeared the most rapid in 2022 an increase of 31%. The level of import peaked in 2024 and is likely to see steady growth in the near future.
Prices varied noticeably by country of destination: amid the top importers, the country with the highest price was Panama ($2,893 per ton), while Venezuela ($842 per ton) was amongst the lowest.
From 2013 to 2024, the most notable rate of growth in terms of prices was attained by Mexico (+3.4%), while the other leaders experienced more modest paces of growth.
Exports
Latin America and the Caribbean's Exports of Mixes And Doughs
In 2024, overseas shipments of mixes and doughs decreased by -26.4% to 82K tons, falling for the third consecutive year after three years of growth. Over the period under review, exports recorded a abrupt curtailment. The most prominent rate of growth was recorded in 2020 with an increase of 43%. Over the period under review, the exports attained the maximum at 156K tons in 2013; however, from 2014 to 2024, the exports stood at a somewhat lower figure.
In value terms, mixes and doughs exports declined markedly to $115M in 2024. In general, exports, however, continue to indicate a relatively flat trend pattern. The growth pace was the most rapid in 2019 with an increase of 29% against the previous year. The level of export peaked at $150M in 2022; however, from 2023 to 2024, the exports stood at a somewhat lower figure.
Exports By Country
Brazil (21K tons), Argentina (17K tons) and Mexico (15K tons) represented roughly 64% of total exports in 2024. Paraguay (9.2K tons) took an 11% share (based on physical terms) of total exports, which put it in second place, followed by Guatemala (9.2%), Uruguay (5%) and Costa Rica (4.9%).
From 2013 to 2024, the biggest increases were recorded for Paraguay (with a CAGR of +32.2%), while shipments for the other leaders experienced more modest paces of growth.
In value terms, Mexico ($30M), Brazil ($27M) and Argentina ($14M) were the countries with the highest levels of exports in 2024, with a combined 61% share of total exports. Guatemala, Uruguay, Costa Rica and Paraguay lagged somewhat behind, together accounting for a further 30%.
Paraguay, with a CAGR of +20.8%, saw the highest rates of growth with regard to the value of exports, among the main exporting countries over the period under review, while shipments for the other leaders experienced more modest paces of growth.
Export Prices By Country
The export price in Latin America and the Caribbean stood at $1,409 per ton in 2024, surging by 9.4% against the previous year. Export price indicated strong growth from 2013 to 2024: its price increased at an average annual rate of +6.5% over the last eleven-year period. The trend pattern, however, indicated some noticeable fluctuations being recorded throughout the analyzed period. Based on 2024 figures, mixes and doughs export price increased by +56.4% against 2021 indices. The pace of growth was the most pronounced in 2016 when the export price increased by 29%. Over the period under review, the export prices reached the peak figure in 2024 and is likely to continue growth in years to come.
There were significant differences in the average prices amongst the major exporting countries. In 2024, amid the top suppliers, the country with the highest price was Uruguay ($2,524 per ton), while Paraguay ($427 per ton) was amongst the lowest.
From 2013 to 2024, the most notable rate of growth in terms of prices was attained by Guatemala (+3.8%), while the other leaders experienced more modest paces of growth.
This report provides a comprehensive view of the mixes and doughs industry in Latin America and the Caribbean, tracking demand, supply, and trade flows across the regional value chain. It explains how demand across key channels and end-use segments shapes consumption patterns, while also mapping the role of input availability, production efficiency, and regulatory standards on supply.
Beyond headline metrics, the study benchmarks prices, margins, and trade routes so you can see where value is created and how it moves between exporters and importers within Latin America and the Caribbean. The analysis is designed to support strategic planning, market entry, portfolio prioritization, and risk management in the mixes and doughs landscape in Latin America and the Caribbean.
Quick navigation
- Key findings
- Report scope
- Product coverage
- Country coverage
- Methodology
- Forecasts to 2035
- Price analysis
- Market participants
- Country profiles
- How to use this report
- FAQ
Key findings
- Regional demand is shaped by both household and industrial usage, with trade flows linking supply hubs to import-reliant countries.
- Pricing dynamics reflect unit values, freight costs, exchange rates, and regulatory shifts that affect sourcing decisions.
- Supply depends on input availability and production efficiency, creating distinct cost curves across Latin America and the Caribbean.
- Market concentration varies by country, creating different competitive landscapes and entry barriers.
- The 2035 outlook highlights where capacity investment and demand growth are most aligned within the region.
Report scope
The report combines market sizing with trade intelligence and price analytics for Latin America and the Caribbean. It covers both historical performance and the forward outlook to 2035, allowing you to compare cycles, structural shifts, and policy impacts across countries and sub-regions.
- Market size and growth in value and volume terms
- Consumption structure by end-use segments and countries
- Production capacity, output, and cost dynamics
- Regional trade flows, exporters, importers, and balances
- Price benchmarks, unit values, and margin signals
- Competitive context and market entry conditions
Product coverage
- Prodcom 10612400 - Mixes and doughs for the preparation of bread, cakes, pastry, c rispbread, biscuits, waffles, wafers, rusks, toasted bread and similar toasted products and other bakers
Country coverage
- Anguilla
- Antigua and Barbuda
- Argentina
- Aruba
- Bahamas
- Barbados
- Belize
- Bolivia
- Brazil
- British Virgin Islands
- Cayman Islands
- Chile
- Colombia
- Costa Rica
- Cuba
- Curacao
- Dominica
- Dominican Republic
- Ecuador
- El Salvador
- Falkland Islands (Malvinas)
- French Guiana
- Grenada
- Guadeloupe
- Guatemala
- Guyana
- Haiti
- Honduras
- Jamaica
- Martinique
- Mexico
- Montserrat
- Nicaragua
- Panama
- Paraguay
- Peru
- Puerto Rico
- Saint Kitts and Nevis
- Saint Lucia
- Saint Maarten (Dutch part)
- Saint Vincent and the Grenadines
- Suriname
- Trinidad and Tobago
- Turks and Caicos Islands
- United States Virgin Islands
- Uruguay
- Venezuela
Country profiles and benchmarks
For the regional report, country profiles provide a consistent view of market size, trade balance, prices, and per-capita indicators across Latin America and the Caribbean. The profiles highlight the largest consuming and producing markets and allow direct benchmarking across peers.
Methodology
The analysis is built on a multi-source framework that combines official statistics, trade records, company disclosures, and expert validation. Data are standardized, reconciled, and cross-checked to ensure consistency across time series.
- International trade data (exports, imports, and mirror statistics)
- National production and consumption statistics
- Company-level information from financial filings and public releases
- Price series and unit value benchmarks
- Analyst review, outlier checks, and time-series validation
All data are normalized to a common product definition and mapped to a consistent set of codes. This ensures that comparisons across time are aligned and actionable.
Forecasts to 2035
The forecast horizon extends to 2035 and is based on a structured model that links mixes and doughs demand and supply to macroeconomic indicators, trade patterns, and sector-specific drivers. The model captures both cyclical and structural factors and reflects known policy and technology shifts within Latin America and the Caribbean.
- Historical baseline: 2012-2025
- Forecast horizon: 2026-2035
- Scenario-based sensitivity to income growth, substitution, and regulation
- Capacity and investment outlook for major producing countries
Each country projection is built from its own historical pattern and the regional context, allowing the report to show where growth is concentrated and where risks are elevated.
Price analysis and trade dynamics
Prices are analyzed in detail, including export and import unit values, regional spreads, and changes in trade costs. The report highlights how seasonality, freight rates, exchange rates, and supply disruptions influence pricing and margins.
- Price benchmarks by country and sub-region
- Export and import unit value trends
- Seasonality and calendar effects in trade flows
- Price outlook to 2035 under baseline assumptions
Profiles of market participants
Key producers, exporters, and distributors are profiled with a focus on their operational scale, geographic footprint, product mix, and market positioning. This helps identify competitive pressure points, partnership opportunities, and routes to differentiation.
- Business focus and production capabilities
- Geographic reach and distribution networks
- Cost structure and pricing strategy indicators
- Compliance, certification, and sustainability context
How to use this report
- Quantify regional demand and identify the most attractive country markets
- Evaluate export opportunities and prioritize target destinations
- Track price dynamics and protect margins
- Benchmark performance against regional competitors
- Build evidence-based forecasts for investment decisions
This report is designed for manufacturers, distributors, importers, wholesalers, investors, and advisors who need a clear, data-driven picture of mixes and doughs dynamics in Latin America and the Caribbean.
FAQ
What is included in the mixes and doughs market in Latin America and the Caribbean?
The market size aggregates consumption and trade data at country and sub-regional levels, presented in both value and volume terms.
How are the forecasts to 2035 built?
The projections combine historical trends with macroeconomic indicators, trade dynamics, and sector-specific drivers.
Does the report cover prices and margins?
Yes, it includes export and import unit values, regional spreads, and a pricing outlook to 2035.
Which countries are profiled in detail?
The report provides profiles for the largest consuming and producing countries in Latin America and the Caribbean.
Can this report support market entry decisions?
Yes, it highlights demand hotspots, trade routes, pricing trends, and competitive context.
1. INTRODUCTION
Making Data-Driven Decisions to Grow Your Business
- REPORT DESCRIPTION
- RESEARCH METHODOLOGY AND THE AI PLATFORM
- DATA-DRIVEN DECISIONS FOR YOUR BUSINESS
- GLOSSARY AND SPECIFIC TERMS
2. EXECUTIVE SUMMARY
A Quick Overview of Market Performance
- KEY FINDINGS
- MARKET TRENDS This Chapter is Available Only for the Professional EditionPRO
3. MARKET OVERVIEW
Understanding the Current State of The Market and its Prospects
- MARKET SIZE: HISTORICAL DATA (2012–2025) AND FORECAST (2026–2035)
- CONSUMPTION BY COUNTRY: HISTORICAL DATA (2012–2025) AND FORECAST (2026–2035)
- MARKET FORECAST TO 2035
4. MOST PROMISING PRODUCTS FOR DIVERSIFICATION
Finding New Products to Diversify Your Business
- TOP PRODUCTS TO DIVERSIFY YOUR BUSINESS
- BEST-SELLING PRODUCTS
- MOST CONSUMED PRODUCTS
- MOST TRADED PRODUCTS
- MOST PROFITABLE PRODUCTS FOR EXPORT
5. MOST PROMISING SUPPLYING COUNTRIES
Choosing the Best Countries to Establish Your Sustainable Supply Chain
- TOP COUNTRIES TO SOURCE YOUR PRODUCT
- TOP PRODUCING COUNTRIES
- TOP EXPORTING COUNTRIES
- LOW-COST EXPORTING COUNTRIES
6. MOST PROMISING OVERSEAS MARKETS
Choosing the Best Countries to Boost Your Export
- TOP OVERSEAS MARKETS FOR EXPORTING YOUR PRODUCT
- TOP CONSUMING MARKETS
- UNSATURATED MARKETS
- TOP IMPORTING MARKETS
- MOST PROFITABLE MARKETS
7. PRODUCTION
The Latest Trends and Insights into The Industry
- PRODUCTION VOLUME AND VALUE: HISTORICAL DATA (2012–2025) AND FORECAST (2026–2035)
- PRODUCTION BY COUNTRY: HISTORICAL DATA (2012–2025) AND FORECAST (2026–2035)
8. IMPORTS
The Largest Import Supplying Countries
- IMPORTS: HISTORICAL DATA (2012–2025) AND FORECAST (2026–2035)
- IMPORTS BY COUNTRY: HISTORICAL DATA (2012–2025) AND FORECAST (2026–2035)
- IMPORT PRICES BY COUNTRY: HISTORICAL DATA (2012–2025) AND FORECAST (2026–2035)
9. EXPORTS
The Largest Destinations for Exports
- EXPORTS: HISTORICAL DATA (2012–2025) AND FORECAST (2026–2035)
- EXPORTS BY COUNTRY: HISTORICAL DATA (2012–2025) AND FORECAST (2026–2035)
- EXPORT PRICES BY COUNTRY: HISTORICAL DATA (2012–2025) AND FORECAST (2026–2035)
10. PROFILES OF MAJOR PRODUCERS
The Largest Producers on The Market and Their Profiles
-
11. COUNTRY PROFILES
The Largest Markets And Their Profiles
This Chapter is Available Only for the Professional Edition PRO LIST OF TABLES
- Key Findings In 2025
- Market Volume, In Physical Terms: Historical Data (2012–2025) and Forecast (2026–2035)
- Market Value: Historical Data (2012–2025) and Forecast (2026–2035)
- Per Capita Consumption, by Country, 2022–2025
- Production, In Physical Terms, By Country: Historical Data (2012–2025) and Forecast (2026–2035)
- Imports, In Physical Terms, By Country: Historical Data (2012–2025) and Forecast (2026–2035)
- Imports, In Value Terms, By Country: Historical Data (2012–2025) and Forecast (2026–2035)
- Import Prices, By Country: Historical Data (2012–2025) and Forecast (2026–2035)
- Exports, In Physical Terms, By Country: Historical Data (2012–2025) and Forecast (2026–2035)
- Exports, In Value Terms, By Country: Historical Data (2012–2025) and Forecast (2026–2035)
- Export Prices, By Country: Historical Data (2012–2025) and Forecast (2026–2035)
LIST OF FIGURES
- Market Volume, In Physical Terms: Historical Data (2012–2025) and Forecast (2026–2035)
- Market Value: Historical Data (2012–2025) and Forecast (2026–2035)
- Consumption, by Country, 2025
- Market Volume Forecast to 2035
- Market Value Forecast to 2035
- Market Size and Growth, By Product
- Average Per Capita Consumption, By Product
- Exports and Growth, By Product
- Export Prices and Growth, By Product
- Production Volume and Growth
- Exports and Growth
- Export Prices and Growth
- Market Size and Growth
- Per Capita Consumption
- Imports and Growth
- Import Prices
- Production, In Physical Terms: Historical Data (2012–2025) and Forecast (2026–2035)
- Production, In Value Terms: Historical Data (2012–2025) and Forecast (2026–2035)
- Production, by Country, 2025
- Production, In Physical Terms, by Country: Historical Data (2012–2025) and Forecast (2026–2035)
- Imports, In Physical Terms: Historical Data (2012–2025) and Forecast (2026–2035)
- Imports, In Value Terms: Historical Data (2012–2025) and Forecast (2026–2035)
- Imports, In Physical Terms, By Country, 2025
- Imports, In Physical Terms, By Country: Historical Data (2012–2025) and Forecast (2026–2035)
- Imports, In Value Terms, By Country: Historical Data (2012–2025) and Forecast (2026–2035)
- Import Prices, By Country: Historical Data (2012–2025) and Forecast (2026–2035)
- Exports, In Physical Terms: Historical Data (2012–2025) and Forecast (2026–2035)
- Exports, In Value Terms: Historical Data (2012–2025) and Forecast (2026–2035)
- Exports, In Physical Terms, By Country, 2025
- Exports, In Physical Terms, By Country: Historical Data (2012–2025) and Forecast (2026–2035)
- Exports, In Value Terms, By Country: Historical Data (2012–2025) and Forecast (2026–2035)
- Export Prices, By Country: Historical Data (2012–2025) and Forecast (2026–2035)
Recommended posts
Free Data: Mixes And Doughs - Latin America and the Caribbean
Instant access. No credit card needed.


