
Italy - Bottles, Jars And Other Containers Of Glass - Market Analysis, Forecast, Size, Trends and Insights
Get instant access to more than 2 million reports, dashboards, and datasets on the IndexBox Platform.
View PricingExport of Glass Bottles, Jars, and Containers in Italy Plummet to $23M in October 2023
Italy Glass Container Exports
In October 2023, exports of bottles, jars and other containers of glass from Italy contracted markedly to 92M units, which is down by -79.3% against September 2023. Overall, exports showed a abrupt setback. The growth pace was the most rapid in September 2023 with an increase of 34% m-o-m. The exports peaked at 502M units in March 2023; however, from April 2023 to October 2023, the exports stood at a somewhat lower figure.
In value terms, glass bottle, jar and container exports dropped markedly to $23M (IndexBox estimates) in October 2023. Over the period under review, exports showed a abrupt curtailment. The most prominent rate of growth was recorded in September 2023 with an increase of 40% against the previous month. Over the period under review, the exports attained the maximum at 143M units in June 2023; however, from July 2023 to October 2023, the exports remained at a lower figure.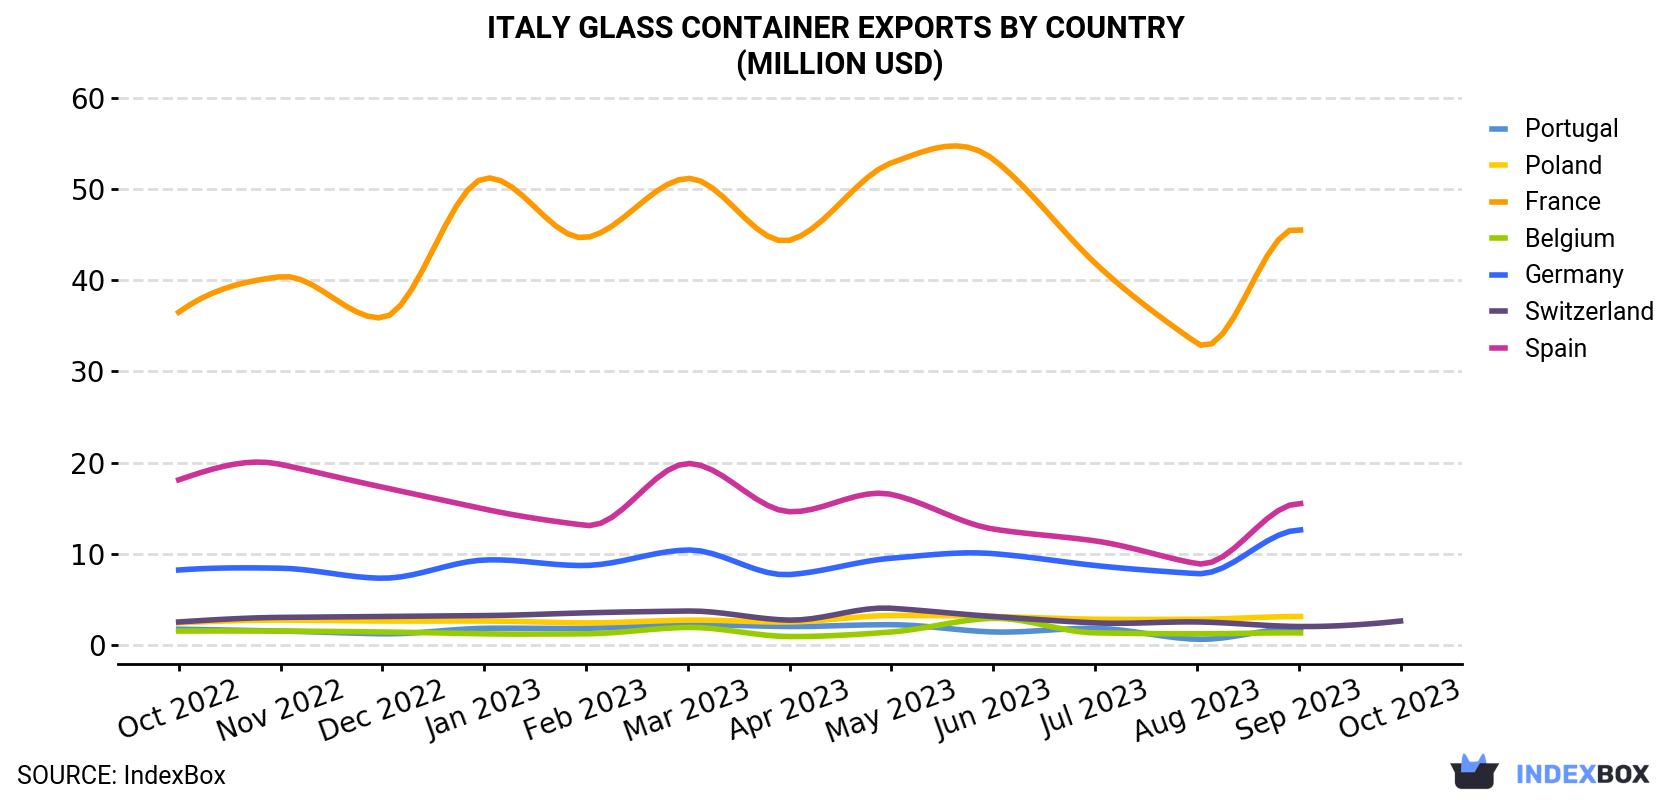 Glass Container Exports By Country (Million USD)">
| COUNTRY | Export Value of Glass Container in Italy (million USD) | ||||||||||||
|---|---|---|---|---|---|---|---|---|---|---|---|---|---|
| Oct 2022 | Nov 2022 | Dec 2022 | Jan 2023 | Feb 2023 | Mar 2023 | Apr 2023 | May 2023 | Jun 2023 | Jul 2023 | Aug 2023 | Sep 2023 | Oct 2023 | |
| Switzerland | 2.5 | 3.0 | 3.1 | 3.2 | 3.5 | 3.7 | 2.7 | 4.0 | 3.1 | 2.4 | 2.5 | 2.0 | 2.6 |
| Portugal | 1.7 | 1.5 | 1.2 | 1.8 | 1.8 | 2.2 | 2.0 | 2.2 | 1.4 | 1.8 | 0.6 | 1.8 | N/A |
| Poland | 2.4 | 2.7 | 2.6 | 2.6 | 2.4 | 2.7 | 2.5 | 3.2 | 3.1 | 2.8 | 2.8 | 3.1 | N/A |
| France | 36.5 | 40.4 | 35.9 | 51.2 | 44.7 | 51.2 | 44.4 | 52.9 | 53.3 | 41.9 | 33.1 | 45.6 | N/A |
| Belgium | 1.5 | 1.5 | 1.4 | 1.2 | 1.2 | 1.9 | 0.9 | 1.4 | 2.9 | 1.3 | 1.2 | 1.3 | N/A |
| Germany | 8.2 | 8.4 | 7.3 | 9.3 | 8.7 | 10.4 | 7.7 | 9.5 | 10.0 | 8.7 | 7.8 | 12.6 | N/A |
| Spain | 18.1 | 19.8 | 17.3 | 14.9 | 13.1 | 19.9 | 14.6 | 16.5 | 12.7 | 11.4 | 8.9 | 15.5 | N/A |
| Others | 32.1 | 41.2 | 37.2 | 32.2 | 37.1 | 44.9 | 33.7 | 42.2 | 56.8 | 34.9 | 31.6 | 42.4 | 20.3 |
| Total | 103 | 118 | 106 | 116 | 112 | 137 | 108 | 132 | 143 | 105 | 88.6 | 124 | 22.9 |
Exports by Country
Switzerland (7.4M units) was the main destination for glass bottle, jar and container exports from Italy, with a approximately 8% share of total exports.
From October 2022 to October 2023, the average monthly rate of growth in terms of volume to Switzerland amounted to -1.7%.
In value terms, Switzerland ($2.6M) emerged as the key foreign market for glass bottle, jar and container exports from Italy.
From October 2022 to October 2023, the average monthly growth rate of value to Switzerland was relatively modest.
Export Prices by Country
In October 2023, the glass container price stood at $249 per thousand units (FOB, Italy), reducing by -10.9% against the previous month. In general, the export price, however, showed a relatively flat trend pattern. The pace of growth was the most pronounced in January 2023 when the average export price increased by 16% against the previous month. The export price peaked at $333 per thousand units in June 2023; however, from July 2023 to October 2023, the export prices failed to regain momentum.
There were significant differences in the average prices for the major external markets. In October 2023, the country with the highest price was Canada ($636 per thousand units), while the average price for exports to Ukraine ($59.0 per thousand units) was amongst the lowest.
From October 2022 to October 2023, the most notable rate of growth in terms of prices was recorded for supplies to the UK (+7.1%), while the prices for the other major destinations experienced more modest paces of growth.
This report provides an in-depth analysis of the market for glass bottle, jar and container in Italy. Within it, you will discover the latest data on market trends and opportunities by country, consumption, production and price developments, as well as the global trade (imports and exports). The forecast exhibits the market prospects through 2030.
Product coverage:
- Prodcom 23131120 - Containers made from tubing of glass (excluding preserving jars)
- Prodcom 23131130 - Glass containers of a nominal capacity . 2,5 litres (excluding preserving jars)
- Prodcom 23131140 - Bottles of colourless glass of a nominal capacity < 2,5 litres, f or beverages and foodstuffs (excluding bottles covered with leather or composition leather, infant
- Prodcom 23131150 - Bottles of coloured glass of a nominal capacity < 2,5 litres, for beverages and foodstuffs (excluding bottles covered with leather or composition leather, infant
- Prodcom 23131160 - Glass containers for beverages and foodstuffs of a nominal capacity < 2,5 litres (excluding bottles, flasks covered with leather or composition leather, domestic glassware, vacuum flasks and vessels)
- Prodcom 23131170 - Glass containers for pharmaceutical products of a nominal capacity < 2,5 litres
- Prodcom 23131180 - Glass containers of a nominal capacity < 2,5 litres for the conveyance or packing of goods (excluding for beverages and foodstuffs, for pharmaceutical products, containers made from glass tubing)
Country coverage:
- Italy
Data coverage:
- Market volume and value
- Per Capita consumption
- Forecast of the market dynamics in the medium term
- Trade (exports and imports) in Italy
- Export and import prices
- Market trends, drivers and restraints
- Key market players and their profiles
Reasons to buy this report:
- Take advantage of the latest data
- Find deeper insights into current market developments
- Discover vital success factors affecting the market
This report is designed for manufacturers, distributors, importers, and wholesalers, as well as for investors, consultants and advisors.
In this report, you can find information that helps you to make informed decisions on the following issues:
- How to diversify your business and benefit from new market opportunities
- How to load your idle production capacity
- How to boost your sales on overseas markets
- How to increase your profit margins
- How to make your supply chain more sustainable
- How to reduce your production and supply chain costs
- How to outsource production to other countries
- How to prepare your business for global expansion
While doing this research, we combine the accumulated expertise of our analysts and the capabilities of artificial intelligence. The AI-based platform, developed by our data scientists, constitutes the key working tool for business analysts, empowering them to discover deep insights and ideas from the marketing data.
-
1. INTRODUCTION
Making Data-Driven Decisions to Grow Your Business
- REPORT DESCRIPTION
- RESEARCH METHODOLOGY AND AI PLATFORM
- DATA-DRIVEN DECISIONS FOR YOUR BUSINESS
- GLOSSARY AND SPECIFIC TERMS
-
2. EXECUTIVE SUMMARY
A Quick Overview of Market Performance
- KEY FINDINGS
- MARKET TRENDS This Chapter is Available Only for the Professional Edition PRO
-
3. MARKET OVERVIEW
Understanding the Current State of The Market and Its Prospects
- MARKET SIZE
- MARKET STRUCTURE
- TRADE BALANCE
- PER CAPITA CONSUMPTION
- MARKET FORECAST TO 2030
-
4. MOST PROMISING PRODUCT
Finding New Products to Diversify Your Business
This Chapter is Available Only for the Professional Edition PRO- TOP PRODUCTS TO DIVERSIFY YOUR BUSINESS
- BEST-SELLING PRODUCTS
- MOST CONSUMED PRODUCT
- MOST TRADED PRODUCT
- MOST PROFITABLE PRODUCT FOR EXPORT
-
5. MOST PROMISING SUPPLYING COUNTRIES
Choosing the Best Countries to Establish Your Sustainable Supply Chain
This Chapter is Available Only for the Professional Edition PRO- TOP COUNTRIES TO SOURCE YOUR PRODUCT
- TOP PRODUCING COUNTRIES
- TOP EXPORTING COUNTRIES
- LOW-COST EXPORTING COUNTRIES
-
6. MOST PROMISING OVERSEAS MARKETS
Choosing the Best Countries to Boost Your Exports
This Chapter is Available Only for the Professional Edition PRO- TOP OVERSEAS MARKETS FOR EXPORTING YOUR PRODUCT
- TOP CONSUMING MARKETS
- UNSATURATED MARKETS
- TOP IMPORTING MARKETS
- MOST PROFITABLE MARKETS
7. PRODUCTION
The Latest Trends and Insights into The Industry
- PRODUCTION VOLUME AND VALUE
8. IMPORTS
The Largest Import Supplying Countries
- IMPORTS FROM 2012–2023
- IMPORTS BY COUNTRY
- IMPORT PRICES BY COUNTRY
9. EXPORTS
The Largest Destinations for Exports
- EXPORTS FROM 2012–2023
- EXPORTS BY COUNTRY
- EXPORT PRICES BY COUNTRY
-
10. PROFILES OF MAJOR PRODUCERS
The Largest Producers on The Market and Their Profiles
This Chapter is Available Only for the Professional Edition PRO -
LIST OF TABLES
- Key Findings In 2023
- Market Volume, In Physical Terms, 2012–2023
- Market Value, 2012–2023
- Per Capita Consumption In 2012-2023
- Imports, In Physical Terms, By Country, 2012–2023
- Imports, In Value Terms, By Country, 2012–2023
- Import Prices, By Country Of Origin, 2012–2023
- Exports, In Physical Terms, By Country, 2012–2023
- Exports, In Value Terms, By Country, 2012–2023
- Export Prices, By Country Of Destination, 2012–2023
-
LIST OF FIGURES
- Market Volume, In Physical Terms, 2012–2023
- Market Value, 2012–2023
- Market Structure – Domestic Supply vs. Imports, In Physical Terms, 2012-2023
- Market Structure – Domestic Supply vs. Imports, In Value Terms, 2012-2023
- Trade Balance, In Physical Terms, 2012-2023
- Trade Balance, In Value Terms, 2012-2023
- Per Capita Consumption, 2012-2023
- Market Volume Forecast to 2030
- Market Value Forecast to 2030
- Products: Market Size And Growth, By Type
- Products: Average Per Capita Consumption, By Type
- Products: Exports And Growth, By Type
- Products: Export Prices And Growth, By Type
- Production Volume And Growth
- Exports And Growth
- Export Prices And Growth
- Market Size And Growth
- Per Capita Consumption
- Imports And Growth
- Import Prices
- Production, In Physical Terms, 2012–2023
- Production, In Value Terms, 2012–2023
- Imports, In Physical Terms, 2012–2023
- Imports, In Value Terms, 2012–2023
- Imports, In Physical Terms, By Country, 2023
- Imports, In Physical Terms, By Country, 2012–2023
- Imports, In Value Terms, By Country, 2012–2023
- Import Prices, By Country Of Origin, 2012–2023
- Exports, In Physical Terms, 2012–2023
- Exports, In Value Terms, 2012–2023
- Exports, In Physical Terms, By Country, 2023
- Exports, In Physical Terms, By Country, 2012–2023
- Exports, In Value Terms, By Country, 2012–2023
- Export Prices, By Country Of Destination, 2012–2023


