
France - Bottles, Jars And Other Containers Of Glass - Market Analysis, Forecast, Size, Trends and Insights
Get instant access to more than 2 million reports, dashboards, and datasets on the IndexBox Platform.
View PricingSeptember 2023 Sees a 9% Rise to $163M in Glass Bottle, Jar, and Container Imports to France.
France Glass Container Imports
After two months of decline, purchases abroad of bottles, jars and other containers of glass increased by 5.5% to 635M units in September 2023. Overall, imports, however, showed a noticeable decline. The pace of growth appeared the most rapid in March 2023 with an increase of 15% against the previous month. As a result, imports attained the peak of 877M units. From April 2023 to September 2023, the growth of imports remained at a lower figure.
In value terms, glass bottle, jar and container imports rose markedly to $163M (IndexBox estimates) in September 2023. In general, imports continue to indicate a relatively flat trend pattern. The most prominent rate of growth was recorded in March 2023 with an increase of 19% m-o-m. Imports peaked at 210M units in June 2023; however, from July 2023 to September 2023, imports stood at a somewhat lower figure.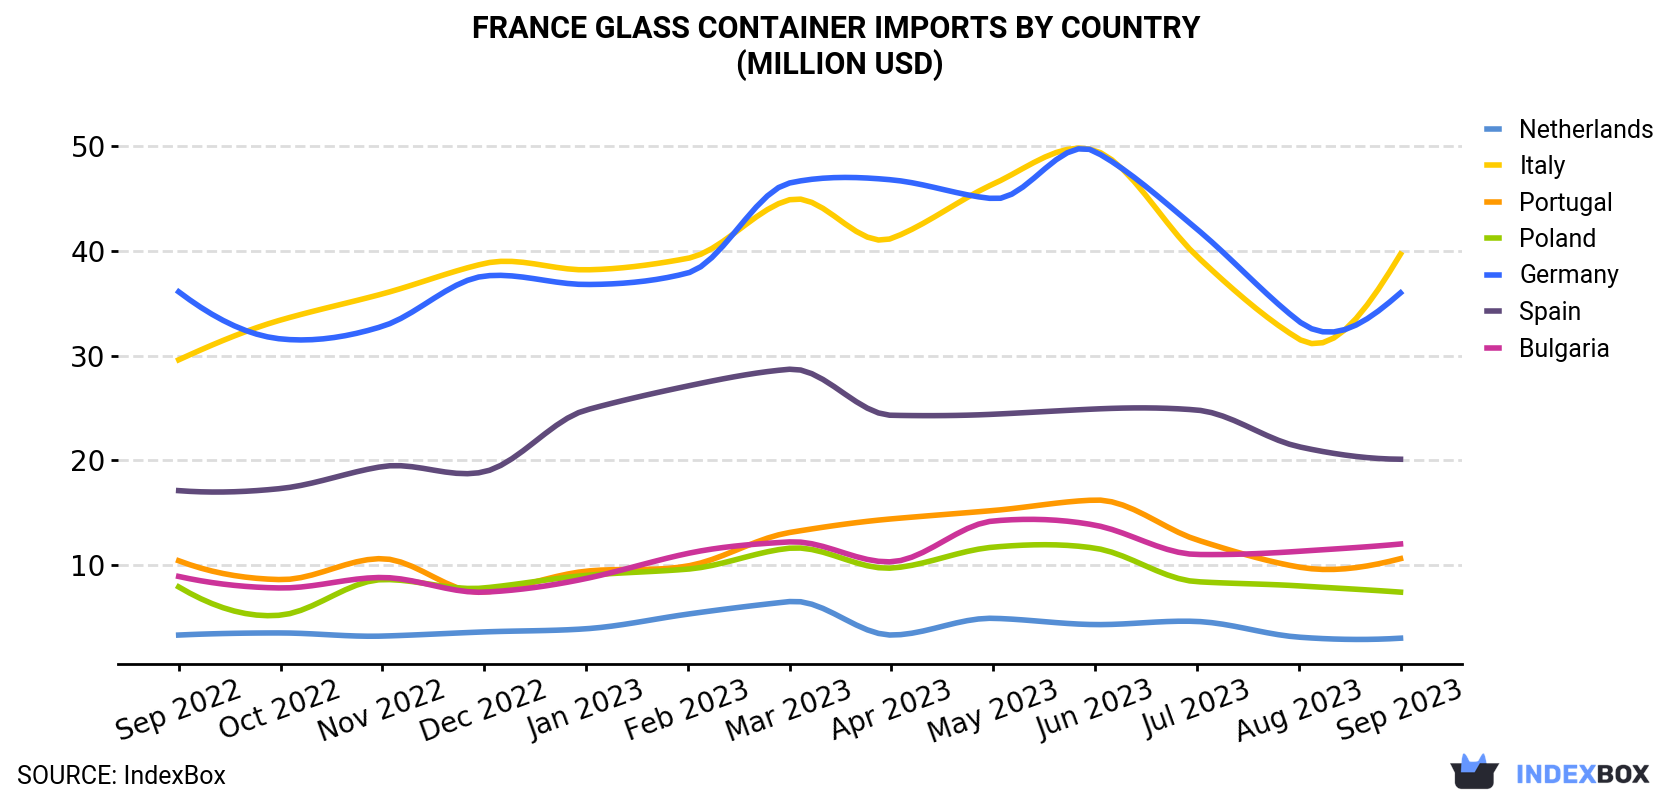 Glass Container Imports By Country (Million USD)">
| COUNTRY | Import Value of Glass Container in France (million USD) | ||||||||||||
|---|---|---|---|---|---|---|---|---|---|---|---|---|---|
| Sep 2022 | Oct 2022 | Nov 2022 | Dec 2022 | Jan 2023 | Feb 2023 | Mar 2023 | Apr 2023 | May 2023 | Jun 2023 | Jul 2023 | Aug 2023 | Sep 2023 | |
| Italy | 29.6 | 33.4 | 35.9 | 38.8 | 38.2 | 39.3 | 44.9 | 41.2 | 46.4 | 49.6 | 39.5 | 31.6 | 39.7 |
| Germany | 36.1 | 31.6 | 32.8 | 37.6 | 36.8 | 37.9 | 46.5 | 46.8 | 45.0 | 49.5 | 42.1 | 33.3 | 36.0 |
| Spain | 17.1 | 17.3 | 19.4 | 18.9 | 24.8 | 27.1 | 28.7 | 24.3 | 24.4 | 24.9 | 24.8 | 21.3 | 20.1 |
| Bulgaria | 8.9 | 7.8 | 8.8 | 7.4 | 8.7 | 11.1 | 12.2 | 10.3 | 14.2 | 13.8 | 11.0 | 11.3 | 12.0 |
| Portugal | 10.4 | 8.6 | 10.6 | 7.4 | 9.4 | 9.9 | 13.1 | 14.4 | 15.2 | 16.2 | 12.4 | 9.8 | 10.6 |
| Poland | 7.9 | 5.2 | 8.6 | 7.8 | 9.0 | 9.6 | 11.6 | 9.7 | 11.7 | 11.6 | 8.4 | 8.0 | 7.4 |
| Netherlands | 3.3 | 3.5 | 3.2 | 3.6 | 3.9 | 5.3 | 6.5 | 3.3 | 4.9 | 4.3 | 4.6 | 3.1 | 3.0 |
| Others | 36.5 | 35.1 | 31.6 | 32.0 | 36.4 | 32.8 | 42.3 | 43.8 | 40.4 | 39.8 | 36.2 | 31.7 | 34.6 |
| Total | 150 | 143 | 151 | 153 | 167 | 173 | 206 | 194 | 202 | 210 | 179 | 150 | 163 |
Imports by Country
Germany (135M units), Spain (126M units) and Portugal (80M units) were the main suppliers of glass bottle, jar and container imports to France, together comprising 54% of total imports. Bulgaria, Italy, Poland and the Netherlands lagged somewhat behind, together accounting for a further 28%.
From September 2022 to September 2023, the biggest increases were in Bulgaria (with a CAGR of +0.5%), while purchases for the other leaders experienced a decline.
In value terms, Italy ($40M), Germany ($36M) and Spain ($20M) appeared to be the largest glass bottle, jar and container suppliers to France, with a combined 59% share of total imports. These countries were followed by Bulgaria, Portugal, Poland and the Netherlands, which together accounted for a further 20%.
Bulgaria, with a CAGR of +2.5%, saw the highest rates of growth with regard to the value of imports, among the main suppliers over the period under review, while purchases for the other leaders experienced more modest paces of growth.
Import Prices by Country
In September 2023, the glass container price amounted to $257 per thousand units (CIF, France), growing by 3.1% against the previous month. Over the period from September 2022 to September 2023, it increased at an average monthly rate of +3.3%. The most prominent rate of growth was recorded in December 2022 an increase of 12% month-to-month. The import price peaked in September 2023.
There were significant differences in the average prices amongst the major supplying countries. In September 2023, the country with the highest price was Italy ($741 per thousand units), while the price for Portugal ($133 per thousand units) was amongst the lowest.
From September 2022 to September 2023, the most notable rate of growth in terms of prices was attained by Germany (+5.8%), while the prices for the other major suppliers experienced more modest paces of growth.
This report provides an in-depth analysis of the market for glass bottle, jar and container in France. Within it, you will discover the latest data on market trends and opportunities by country, consumption, production and price developments, as well as the global trade (imports and exports). The forecast exhibits the market prospects through 2030.
Product coverage:
- Prodcom 23131120 - Containers made from tubing of glass (excluding preserving jars)
- Prodcom 23131130 - Glass containers of a nominal capacity . 2,5 litres (excluding preserving jars)
- Prodcom 23131140 - Bottles of colourless glass of a nominal capacity < 2,5 litres, f or beverages and foodstuffs (excluding bottles covered with leather or composition leather, infant
- Prodcom 23131150 - Bottles of coloured glass of a nominal capacity < 2,5 litres, for beverages and foodstuffs (excluding bottles covered with leather or composition leather, infant
- Prodcom 23131160 - Glass containers for beverages and foodstuffs of a nominal capacity < 2,5 litres (excluding bottles, flasks covered with leather or composition leather, domestic glassware, vacuum flasks and vessels)
- Prodcom 23131170 - Glass containers for pharmaceutical products of a nominal capacity < 2,5 litres
- Prodcom 23131180 - Glass containers of a nominal capacity < 2,5 litres for the conveyance or packing of goods (excluding for beverages and foodstuffs, for pharmaceutical products, containers made from glass tubing)
Country coverage:
- France
Data coverage:
- Market volume and value
- Per Capita consumption
- Forecast of the market dynamics in the medium term
- Trade (exports and imports) in France
- Export and import prices
- Market trends, drivers and restraints
- Key market players and their profiles
Reasons to buy this report:
- Take advantage of the latest data
- Find deeper insights into current market developments
- Discover vital success factors affecting the market
This report is designed for manufacturers, distributors, importers, and wholesalers, as well as for investors, consultants and advisors.
In this report, you can find information that helps you to make informed decisions on the following issues:
- How to diversify your business and benefit from new market opportunities
- How to load your idle production capacity
- How to boost your sales on overseas markets
- How to increase your profit margins
- How to make your supply chain more sustainable
- How to reduce your production and supply chain costs
- How to outsource production to other countries
- How to prepare your business for global expansion
While doing this research, we combine the accumulated expertise of our analysts and the capabilities of artificial intelligence. The AI-based platform, developed by our data scientists, constitutes the key working tool for business analysts, empowering them to discover deep insights and ideas from the marketing data.
-
1. INTRODUCTION
Making Data-Driven Decisions to Grow Your Business
- REPORT DESCRIPTION
- RESEARCH METHODOLOGY AND AI PLATFORM
- DATA-DRIVEN DECISIONS FOR YOUR BUSINESS
- GLOSSARY AND SPECIFIC TERMS
-
2. EXECUTIVE SUMMARY
A Quick Overview of Market Performance
- KEY FINDINGS
- MARKET TRENDS This Chapter is Available Only for the Professional Edition PRO
-
3. MARKET OVERVIEW
Understanding the Current State of The Market and Its Prospects
- MARKET SIZE
- MARKET STRUCTURE
- TRADE BALANCE
- PER CAPITA CONSUMPTION
- MARKET FORECAST TO 2030
-
4. MOST PROMISING PRODUCT
Finding New Products to Diversify Your Business
This Chapter is Available Only for the Professional Edition PRO- TOP PRODUCTS TO DIVERSIFY YOUR BUSINESS
- BEST-SELLING PRODUCTS
- MOST CONSUMED PRODUCT
- MOST TRADED PRODUCT
- MOST PROFITABLE PRODUCT FOR EXPORT
-
5. MOST PROMISING SUPPLYING COUNTRIES
Choosing the Best Countries to Establish Your Sustainable Supply Chain
This Chapter is Available Only for the Professional Edition PRO- TOP COUNTRIES TO SOURCE YOUR PRODUCT
- TOP PRODUCING COUNTRIES
- TOP EXPORTING COUNTRIES
- LOW-COST EXPORTING COUNTRIES
-
6. MOST PROMISING OVERSEAS MARKETS
Choosing the Best Countries to Boost Your Exports
This Chapter is Available Only for the Professional Edition PRO- TOP OVERSEAS MARKETS FOR EXPORTING YOUR PRODUCT
- TOP CONSUMING MARKETS
- UNSATURATED MARKETS
- TOP IMPORTING MARKETS
- MOST PROFITABLE MARKETS
7. PRODUCTION
The Latest Trends and Insights into The Industry
- PRODUCTION VOLUME AND VALUE
8. IMPORTS
The Largest Import Supplying Countries
- IMPORTS FROM 2012–2023
- IMPORTS BY COUNTRY
- IMPORT PRICES BY COUNTRY
9. EXPORTS
The Largest Destinations for Exports
- EXPORTS FROM 2012–2023
- EXPORTS BY COUNTRY
- EXPORT PRICES BY COUNTRY
-
10. PROFILES OF MAJOR PRODUCERS
The Largest Producers on The Market and Their Profiles
This Chapter is Available Only for the Professional Edition PRO -
LIST OF TABLES
- Key Findings In 2023
- Market Volume, In Physical Terms, 2012–2023
- Market Value, 2012–2023
- Per Capita Consumption In 2012-2023
- Imports, In Physical Terms, By Country, 2012–2023
- Imports, In Value Terms, By Country, 2012–2023
- Import Prices, By Country Of Origin, 2012–2023
- Exports, In Physical Terms, By Country, 2012–2023
- Exports, In Value Terms, By Country, 2012–2023
- Export Prices, By Country Of Destination, 2012–2023
-
LIST OF FIGURES
- Market Volume, In Physical Terms, 2012–2023
- Market Value, 2012–2023
- Market Structure – Domestic Supply vs. Imports, In Physical Terms, 2012-2023
- Market Structure – Domestic Supply vs. Imports, In Value Terms, 2012-2023
- Trade Balance, In Physical Terms, 2012-2023
- Trade Balance, In Value Terms, 2012-2023
- Per Capita Consumption, 2012-2023
- Market Volume Forecast to 2030
- Market Value Forecast to 2030
- Products: Market Size And Growth, By Type
- Products: Average Per Capita Consumption, By Type
- Products: Exports And Growth, By Type
- Products: Export Prices And Growth, By Type
- Production Volume And Growth
- Exports And Growth
- Export Prices And Growth
- Market Size And Growth
- Per Capita Consumption
- Imports And Growth
- Import Prices
- Production, In Physical Terms, 2012–2023
- Production, In Value Terms, 2012–2023
- Imports, In Physical Terms, 2012–2023
- Imports, In Value Terms, 2012–2023
- Imports, In Physical Terms, By Country, 2023
- Imports, In Physical Terms, By Country, 2012–2023
- Imports, In Value Terms, By Country, 2012–2023
- Import Prices, By Country Of Origin, 2012–2023
- Exports, In Physical Terms, 2012–2023
- Exports, In Value Terms, 2012–2023
- Exports, In Physical Terms, By Country, 2023
- Exports, In Physical Terms, By Country, 2012–2023
- Exports, In Value Terms, By Country, 2012–2023
- Export Prices, By Country Of Destination, 2012–2023


