
Italy - Aluminium Tube Or Pipe Fittings - Market Analysis, Forecast, Size, Trends And Insights
Get instant access to more than 2 million reports, dashboards, and datasets on the IndexBox Platform.
View PricingItaly's Aluminium Pipe Fittings Experience Steep Price Drop to $7,795 per Ton
Italy Aluminium Pipe Fittings Export Price in June 2023
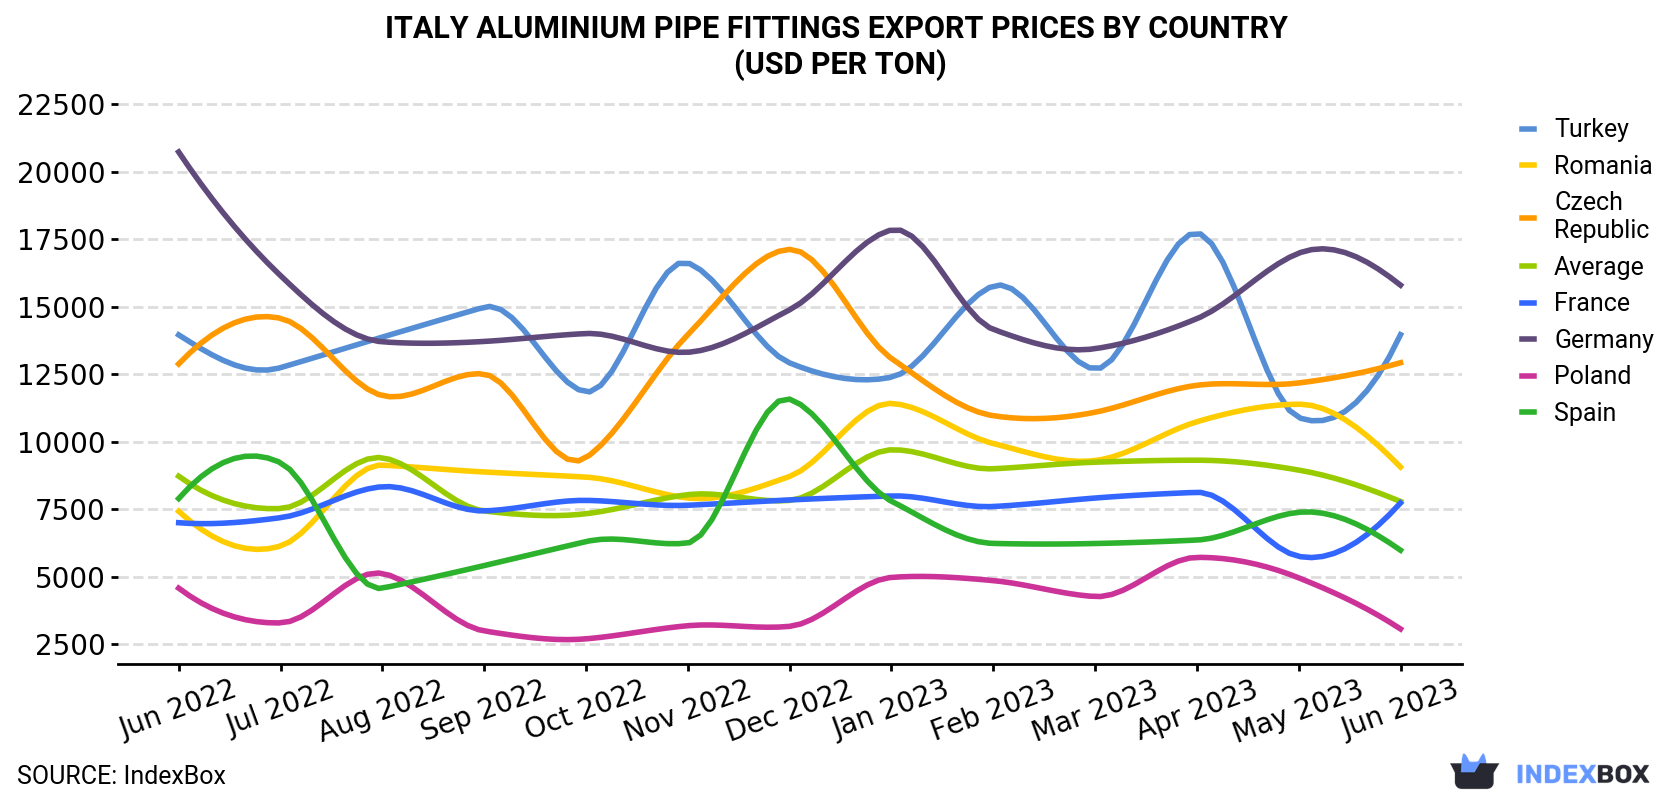
In June 2023, the aluminium pipe fittings price stood at $7,795 per ton (FOB, Italy), shrinking by -13% against the previous month. Overall, the export price continues to indicate a relatively flat trend pattern. The most prominent rate of growth was recorded in August 2022 an increase of 25% month-to-month. Over the period under review, the average export prices attained the maximum at $9,709 per ton in January 2023; however, from February 2023 to June 2023, the export prices stood at a somewhat lower figure.
Prices varied noticeably by the country of destination: the country with the highest price was Germany ($15,806 per ton), while the average price for exports to Poland ($3,075 per ton) was amongst the lowest.
From June 2022 to June 2023, the most notable rate of growth in terms of prices was recorded for supplies to Romania (+1.7%), while the prices for the other major destinations experienced more modest paces of growth.
| COUNTRY | Export Price of Aluminium Pipe Fittings in Italy (USD per ton) | ||||||||||||
|---|---|---|---|---|---|---|---|---|---|---|---|---|---|
| Jun 2022 | Jul 2022 | Aug 2022 | Sep 2022 | Oct 2022 | Nov 2022 | Dec 2022 | Jan 2023 | Feb 2023 | Mar 2023 | Apr 2023 | May 2023 | Jun 2023 | |
| Germany | 20,737 | 16,160 | 13,709 | 13,722 | 14,014 | 13,320 | 14,893 | 17,851 | 14,169 | 13,454 | 14,565 | 16,991 | 15,806 |
| Turkey | 13,965 | 12,751 | 13,882 | 14,991 | 11,851 | 16,631 | 12,927 | 12,397 | 15,777 | 12,703 | 17,737 | 10,902 | 13,972 |
| Czech Republic | 12,888 | 14,580 | 11,715 | 12,516 | 9,413 | 13,973 | 17,131 | 13,091 | 10,971 | 11,100 | 12,098 | 12,184 | 12,934 |
| Romania | 7,431 | 6,145 | 9,144 | 8,888 | 8,697 | 7,924 | 8,723 | 11,427 | 9,941 | 9,309 | 10,748 | 11,398 | 9,072 |
| France | 7,009 | 7,196 | 8,343 | 7,447 | 7,836 | 7,656 | 7,852 | 8,000 | 7,609 | 7,923 | 8,134 | 5,762 | 7,741 |
| Spain | 7,904 | 9,233 | 4,585 | 5,422 | 6,310 | 6,259 | 11,585 | 7,806 | 6,242 | 6,239 | 6,368 | 7,396 | 5,991 |
| Poland | 4,586 | 3,299 | 5,131 | 3,003 | 2,709 | 3,195 | 3,171 | 4,984 | 4,865 | 4,275 | 5,726 | 4,968 | 3,075 |
| Average | 8,732 | 7,534 | 9,415 | 7,444 | 7,342 | 8,048 | 7,836 | 9,709 | 9,007 | 9,250 | 9,324 | 8,958 | 7,795 |
Italy Aluminium Pipe Fittings Exports
In June 2023, the amount of aluminium tube or pipe fittings exported from Italy amounted to 889 tons, with an increase of 7.9% against the previous month's figure. Over the period under review, total exports indicated a moderate expansion from June 2022 to June 2023: its volume increased at an average monthly rate of +2.4% over the last twelve months. The trend pattern, however, indicated some noticeable fluctuations being recorded throughout the analyzed period. Based on June 2023 figures, exports increased by +36.3% against April 2023 indices. The pace of growth appeared the most rapid in September 2022 when exports increased by 145% month-to-month. The exports peaked in June 2023.
In value terms, aluminium pipe fittings exports contracted to $6.9M (IndexBox estimates) in June 2023. Overall, total exports indicated a slight increase from June 2022 to June 2023: its value increased at an average monthly rate of +1.4% over the last twelve months. The trend pattern, however, indicated some noticeable fluctuations being recorded throughout the analyzed period. Based on June 2023 figures, exports increased by +13.9% against April 2023 indices. The growth pace was the most rapid in September 2022 when exports increased by 94% month-to-month.
Italy Aluminium Pipe Fittings Exports by Country
Poland (302 tons) was the main destination for aluminium pipe fittings exports from Italy, accounting for a 34% share of total exports. Moreover, aluminium pipe fittings exports to Poland exceeded the volume sent to the second major destination, France (133 tons), twofold. The third position in this ranking was taken by Spain (119 tons), with a 13% share.
From June 2022 to June 2023, the average monthly rate of growth in terms of volume to Poland amounted to +3.3%. Exports to the other major destinations recorded the following average monthly rates of exports growth: France (-4.0% per month) and Spain (+13.2% per month).
In value terms, Germany ($1.6M), France ($1M) and Poland ($927K) constituted the largest markets for aluminium pipe fittings exported from Italy worldwide, together comprising 51% of total exports. These countries were followed by Spain, the Czech Republic, the United States, Algeria, Romania, Hungary, Tunisia and Turkey, which together accounted for a further 29%.
In terms of the main countries of destination, the United States, with a CAGR of +15.7%, recorded the highest rates of growth with regard to the value of exports, over the period under review, while shipments for the other leaders experienced more modest paces of growth.
This report provides an in-depth analysis of the aluminium pipe fittings market in Italy. Within it, you will discover the latest data on market trends and opportunities by country, consumption, production and price developments, as well as the global trade (imports and exports). The forecast exhibits the market prospects through 2030.
Product coverage:
- Prodcom 24422670 - Aluminium tube or pipe fittings (including couplings, elbows and sleeves) (excluding fittings with taps, cocks and valves, t ube supports, bolts and nuts, clamps)
Country coverage:
- Italy
Data coverage:
- Market volume and value
- Per Capita consumption
- Forecast of the market dynamics in the medium term
- Trade (exports and imports) in Italy
- Export and import prices
- Market trends, drivers and restraints
- Key market players and their profiles
Reasons to buy this report:
- Take advantage of the latest data
- Find deeper insights into current market developments
- Discover vital success factors affecting the market
This report is designed for manufacturers, distributors, importers, and wholesalers, as well as for investors, consultants and advisors.
In this report, you can find information that helps you to make informed decisions on the following issues:
- How to diversify your business and benefit from new market opportunities
- How to load your idle production capacity
- How to boost your sales on overseas markets
- How to increase your profit margins
- How to make your supply chain more sustainable
- How to reduce your production and supply chain costs
- How to outsource production to other countries
- How to prepare your business for global expansion
While doing this research, we combine the accumulated expertise of our analysts and the capabilities of artificial intelligence. The AI-based platform, developed by our data scientists, constitutes the key working tool for business analysts, empowering them to discover deep insights and ideas from the marketing data.
-
1. INTRODUCTION
Making Data-Driven Decisions to Grow Your Business
- REPORT DESCRIPTION
- RESEARCH METHODOLOGY AND AI PLATFORM
- DATA-DRIVEN DECISIONS FOR YOUR BUSINESS
- GLOSSARY AND SPECIFIC TERMS
-
2. EXECUTIVE SUMMARY
A Quick Overview of Market Performance
- KEY FINDINGS
- MARKET TRENDS This Chapter is Available Only for the Professional Edition PRO
-
3. MARKET OVERVIEW
Understanding the Current State of The Market and Its Prospects
- MARKET SIZE
- MARKET STRUCTURE
- TRADE BALANCE
- PER CAPITA CONSUMPTION
- MARKET FORECAST TO 2030
-
4. MOST PROMISING PRODUCT
Finding New Products to Diversify Your Business
This Chapter is Available Only for the Professional Edition PRO- TOP PRODUCTS TO DIVERSIFY YOUR BUSINESS
- BEST-SELLING PRODUCTS
- MOST CONSUMED PRODUCT
- MOST TRADED PRODUCT
- MOST PROFITABLE PRODUCT FOR EXPORT
-
5. MOST PROMISING SUPPLYING COUNTRIES
Choosing the Best Countries to Establish Your Sustainable Supply Chain
This Chapter is Available Only for the Professional Edition PRO- TOP COUNTRIES TO SOURCE YOUR PRODUCT
- TOP PRODUCING COUNTRIES
- TOP EXPORTING COUNTRIES
- LOW-COST EXPORTING COUNTRIES
-
6. MOST PROMISING OVERSEAS MARKETS
Choosing the Best Countries to Boost Your Exports
This Chapter is Available Only for the Professional Edition PRO- TOP OVERSEAS MARKETS FOR EXPORTING YOUR PRODUCT
- TOP CONSUMING MARKETS
- UNSATURATED MARKETS
- TOP IMPORTING MARKETS
- MOST PROFITABLE MARKETS
7. PRODUCTION
The Latest Trends and Insights into The Industry
- PRODUCTION VOLUME AND VALUE
8. IMPORTS
The Largest Import Supplying Countries
- IMPORTS FROM 2012–2023
- IMPORTS BY COUNTRY
- IMPORT PRICES BY COUNTRY
9. EXPORTS
The Largest Destinations for Exports
- EXPORTS FROM 2012–2023
- EXPORTS BY COUNTRY
- EXPORT PRICES BY COUNTRY
-
10. PROFILES OF MAJOR PRODUCERS
The Largest Producers on The Market and Their Profiles
This Chapter is Available Only for the Professional Edition PRO -
LIST OF TABLES
- Key Findings In 2023
- Market Volume, In Physical Terms, 2012–2023
- Market Value, 2012–2023
- Per Capita Consumption In 2012-2023
- Imports, In Physical Terms, By Country, 2012–2023
- Imports, In Value Terms, By Country, 2012–2023
- Import Prices, By Country Of Origin, 2012–2023
- Exports, In Physical Terms, By Country, 2012–2023
- Exports, In Value Terms, By Country, 2012–2023
- Export Prices, By Country Of Destination, 2012–2023
-
LIST OF FIGURES
- Market Volume, In Physical Terms, 2012–2023
- Market Value, 2012–2023
- Market Structure – Domestic Supply vs. Imports, In Physical Terms, 2012-2023
- Market Structure – Domestic Supply vs. Imports, In Value Terms, 2012-2023
- Trade Balance, In Physical Terms, 2012-2023
- Trade Balance, In Value Terms, 2012-2023
- Per Capita Consumption, 2012-2023
- Market Volume Forecast to 2030
- Market Value Forecast to 2030
- Products: Market Size And Growth, By Type
- Products: Average Per Capita Consumption, By Type
- Products: Exports And Growth, By Type
- Products: Export Prices And Growth, By Type
- Production Volume And Growth
- Exports And Growth
- Export Prices And Growth
- Market Size And Growth
- Per Capita Consumption
- Imports And Growth
- Import Prices
- Production, In Physical Terms, 2012–2023
- Production, In Value Terms, 2012–2023
- Imports, In Physical Terms, 2012–2023
- Imports, In Value Terms, 2012–2023
- Imports, In Physical Terms, By Country, 2023
- Imports, In Physical Terms, By Country, 2012–2023
- Imports, In Value Terms, By Country, 2012–2023
- Import Prices, By Country Of Origin, 2012–2023
- Exports, In Physical Terms, 2012–2023
- Exports, In Value Terms, 2012–2023
- Exports, In Physical Terms, By Country, 2023
- Exports, In Physical Terms, By Country, 2012–2023
- Exports, In Value Terms, By Country, 2012–2023
- Export Prices, By Country Of Destination, 2012–2023


