
India - Flat Glass - Market Analysis, Forecast, Size, Trends and Insights
Get instant access to more than 2 million reports, dashboards, and datasets on the IndexBox Platform.
View PricingIndia's October 2023 Import of Flat Glass Amounts to $48M
India Flat Glass Imports
Flat glass imports into India surged to 11M square meters in October 2023, rising by 15% compared with the month before. In general, imports, however, recorded a deep setback. The pace of growth was the most pronounced in December 2022 with an increase of 40% against the previous month. Over the period under review, imports reached the maximum at 36M square meters in October 2022; however, from November 2022 to October 2023, imports remained at a lower figure.
In value terms, flat glass imports stood at $48M (IndexBox estimates) in October 2023. Over the period under review, imports recorded a relatively flat trend pattern. The most prominent rate of growth was recorded in July 2023 with an increase of 39% month-to-month. Imports peaked at 51M square meters in December 2022; however, from January 2023 to October 2023, imports remained at a lower figure.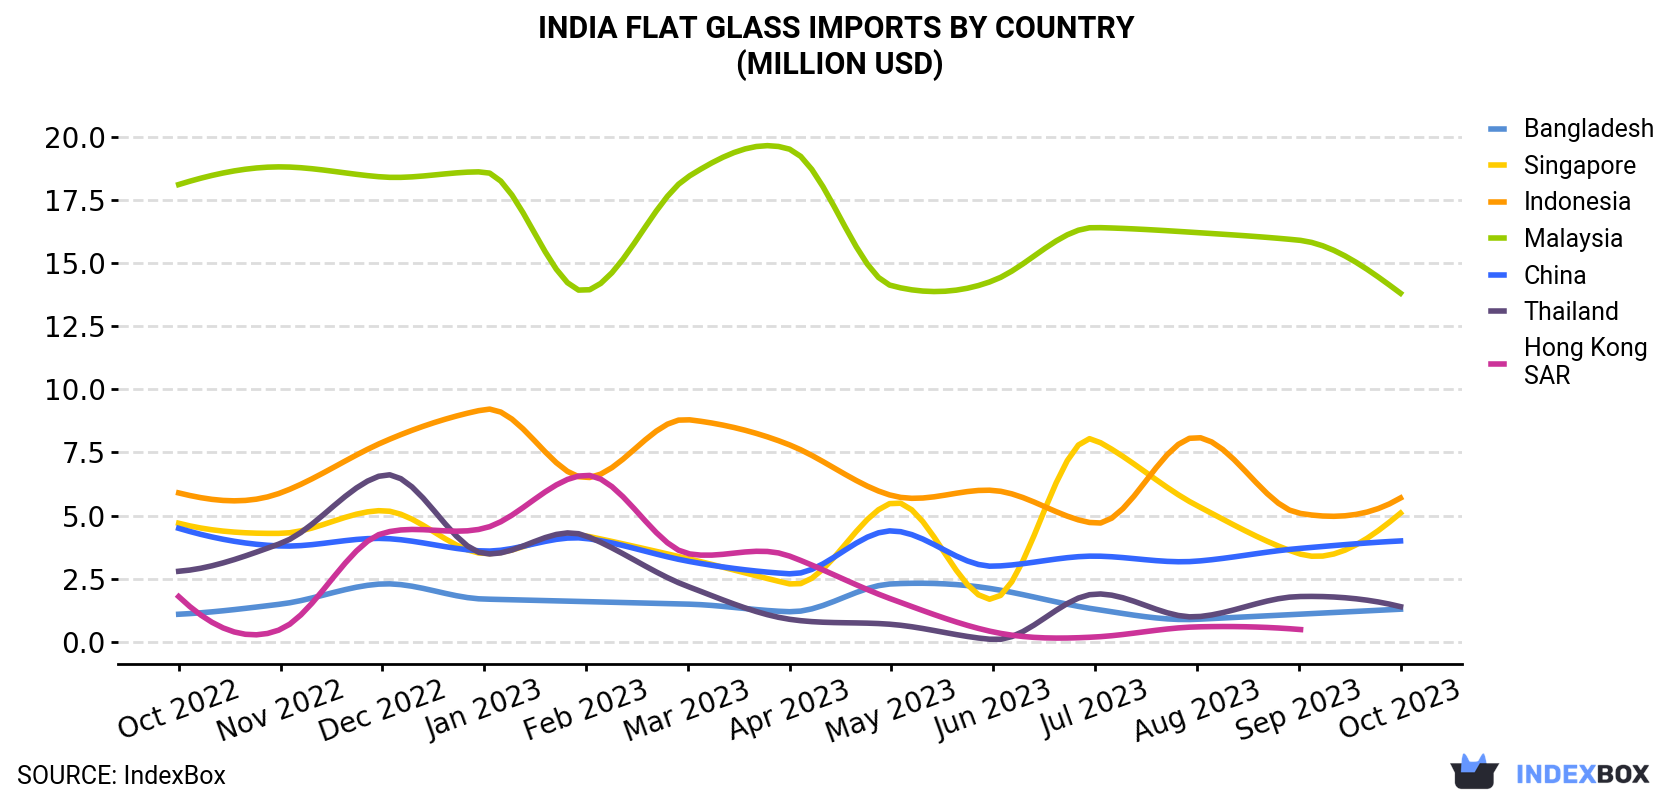
| COUNTRY | Import Value of Flat Glass in India (million USD) | ||||||||||||
|---|---|---|---|---|---|---|---|---|---|---|---|---|---|
| Oct 2022 | Nov 2022 | Dec 2022 | Jan 2023 | Feb 2023 | Mar 2023 | Apr 2023 | May 2023 | Jun 2023 | Jul 2023 | Aug 2023 | Sep 2023 | Oct 2023 | |
| Malaysia | 18.1 | 18.8 | 18.4 | 18.6 | 13.9 | 18.4 | 19.5 | 14.1 | 14.3 | 16.4 | 16.2 | 15.9 | 13.8 |
| Indonesia | 5.9 | 5.9 | 7.9 | 9.2 | 6.5 | 8.8 | 7.8 | 5.8 | 6.0 | 4.7 | 8.1 | 5.1 | 5.7 |
| Singapore | 4.7 | 4.3 | 5.2 | 3.5 | 4.2 | 3.3 | 2.3 | 5.5 | 1.7 | 8.0 | 5.4 | 3.5 | 5.1 |
| China | 4.5 | 3.8 | 4.1 | 3.6 | 4.1 | 3.2 | 2.7 | 4.4 | 3.0 | 3.4 | 3.2 | 3.7 | 4.0 |
| Thailand | 2.8 | 3.9 | 6.6 | 3.5 | 4.2 | 2.2 | 0.9 | 0.7 | 0.1 | 1.9 | 1.0 | 1.8 | 1.4 |
| Bangladesh | 1.1 | 1.5 | 2.3 | 1.7 | 1.6 | 1.5 | 1.2 | 2.3 | 2.1 | 1.3 | 0.9 | 1.1 | 1.3 |
| Hong Kong | 1.8 | 0.5 | 4.3 | 4.5 | 6.6 | 3.5 | 3.4 | 1.7 | 0.4 | 0.2 | 0.6 | 0.5 | < 0.1 |
| Others | 4.7 | 3.9 | 2.5 | 2.5 | 3.3 | 3.4 | 3.2 | 5.2 | 3.8 | 7.7 | 10.9 | 13.0 | 16.3 |
| Total | 43.6 | 42.6 | 51.4 | 47.0 | 44.3 | 44.3 | 41.0 | 39.7 | 31.4 | 43.6 | 46.4 | 44.7 | 47.7 |
Imports by Country
Malaysia (2.5M square meters), Indonesia (1.9M square meters) and Singapore (1.5M square meters) were the main suppliers of flat glass imports to India, together comprising 52% of total imports. China, Thailand, Bangladesh and Hong Kong lagged somewhat behind, together accounting for a further 17%.
From October 2022 to October 2023, the most notable rate of growth in terms of purchases, amongst the main suppliers, was attained by China (with a CAGR of +0.9%), while imports for the other leaders experienced mixed trend patterns.
In value terms, Malaysia ($14M) constituted the largest supplier of flat glass to India, comprising 29% of total imports. The second position in the ranking was held by Indonesia ($5.7M), with a 12% share of total imports. It was followed by Singapore, with an 11% share.
From October 2022 to October 2023, the average monthly growth rate of value from Malaysia stood at -2.3%. The remaining supplying countries recorded the following average monthly rates of imports growth: Indonesia (-0.2% per month) and Singapore (+0.7% per month).
Imports by Type
Float glass and surface ground glass, in sheets, coloured throughout the mass "body tinted", opacified, flashed or merely surface ground, but not otherwise worked, excluding wired glass or glass having an absorbent, reflecting or non-reflecting layer (4.3M square meters), float glass and surface ground or polished glass, in sheets, having an absorbent, reflecting or non-reflecting layer, but not otherwise worked (excluding wired glass) (4.3M square meters) and float glass and surface ground glass, in sheets, non-wired, other than coloured throughout the mass (body tinted), opacified, flashed or merely surface ground (1.7M square meters) were the main products of flat glass imports to India, together comprising 90% of total imports. Cast glass and rolled glass, profiles, not otherwise worked, cast glass and rolled glass, non-wired sheets, excluding those coloured throughout the mass (body tinted) opacified, flashed or having an absorbent or reflecting layer, drawn and blown glass, in sheets, other than glass coloured throughout the mass (body tinted), opacified, flashed or having an absorbent or reflecting layer, cast glass and rolled glass, wired sheets, whether or not having an absorbent or reflecting layer but not otherwise worked, float glass and surface ground or polished glass, in sheets, wired glass, whether or not having an absorbent or reflecting layer, cast glass and rolled glass, non-wired sheets, coloured through the mass (body tinted), opacified, flashed or having an absorbent, reflecting or non-reflecting layer and drawn and blown glass, in sheets, coloured throughout the mass (body tinted), opacified, flashed or having an absorbent, reflecting or non-reflecting layer, but not otherwise worked lagged somewhat behind, together comprising a further 9.5%.
From October 2022 to October 2023, the biggest increases were in cast glass and rolled glass, profiles, not otherwise worked (with a CAGR of +25.4%), while purchases for the other products experienced more modest paces of growth.
In value terms, float glass and surface ground glass, in sheets, coloured throughout the mass "body tinted", opacified, flashed or merely surface ground, but not otherwise worked, excluding wired glass or glass having an absorbent, reflecting or non-reflecting layer ($19M), float glass and surface ground or polished glass, in sheets, having an absorbent, reflecting or non-reflecting layer, but not otherwise worked (excluding wired glass) ($19M) and float glass and surface ground glass, in sheets, non-wired, other than coloured throughout the mass (body tinted), opacified, flashed or merely surface ground ($7.5M) appeared to be the most imported types of flat glass in India, together accounting for 94% of total imports. Cast glass and rolled glass, non-wired sheets, excluding those coloured throughout the mass (body tinted) opacified, flashed or having an absorbent or reflecting layer, drawn and blown glass, in sheets, other than glass coloured throughout the mass (body tinted), opacified, flashed or having an absorbent or reflecting layer, cast glass and rolled glass, profiles, not otherwise worked, drawn and blown glass, in sheets, coloured throughout the mass (body tinted), opacified, flashed or having an absorbent, reflecting or non-reflecting layer, but not otherwise worked, cast glass and rolled glass, wired sheets, whether or not having an absorbent or reflecting layer but not otherwise worked, cast glass and rolled glass, non-wired sheets, coloured through the mass (body tinted), opacified, flashed or having an absorbent, reflecting or non-reflecting layer and float glass and surface ground or polished glass, in sheets, wired glass, whether or not having an absorbent or reflecting layer lagged somewhat behind, together accounting for a further 6.4%.
Import Prices by Country
In October 2023, the flat glass price stood at $4.2 per square meter (CIF, India), shrinking by -7.4% against the previous month. In general, import price indicated a buoyant increase from October 2022 to October 2023: its price increased at an average monthly rate of +11.0% over the last twelve-month period. The trend pattern, however, indicated some noticeable fluctuations being recorded throughout the analyzed period. Based on October 2023 figures, flat glass import price decreased by -7.4% against September 2023 indices. The most prominent rate of growth was recorded in November 2022 an increase of 264% m-o-m. Over the period under review, average import prices hit record highs at $4.5 per square meter in September 2023, and then fell in the following month.
Prices varied noticeably by the country of origin: the country with the highest price was Malaysia ($5.5 per square meter), while the price for Hong Kong ($737 per thousand square meters) was amongst the lowest.
From October 2022 to October 2023, the most notable rate of growth in terms of prices was attained by Malaysia (+20.0%), while the prices for the other major suppliers experienced more modest paces of growth.
This report provides an in-depth analysis of the flat glass market in India. Within it, you will discover the latest data on market trends and opportunities by country, consumption, production and price developments, as well as the global trade (imports and exports). The forecast exhibits the market prospects through 2030.
Product coverage:
- Prodcom 23111110 - Non-wired sheets, of cast or rolled glass, whether or not with absorbent, reflecting or non-reflecting layer, but not otherwise worked
- Prodcom 23111130 - Wired sheets or profiles, of cast or rolled glass, whether or not with absorbent, reflecting or non-reflecting layer, but not otherwise worked
- Prodcom 23111150 - Sheets, of drawn glass or blown glass, whether or not having an absorbent, reflecting or non-reflecting layer, but not otherwise worked
- Prodcom 23111212 - Non-wired sheets, of float, surface ground or polished glass, h aving a non-reflecting layer
- Prodcom 23111214 - Non-wired sheets, of float, surface ground or polished glass, h aving an absorbent or reflective layer, of a thickness . 3,5 mm
- Prodcom 23111217 - Non-wired sheets, of float, surface ground or polished glass, h aving an absorbent or reflecting layer, not otherwise worked, o f a thickness > 3,5 mm
- Prodcom 23111230 - Non-wired sheets, of float, surface ground or polished glass, c oloured throughout the mass, opacified, flashed or merely surface ground
- Prodcom 23111290 - Other sheets of float/ground/polished glass, n.e.c.
Country coverage:
- India
Data coverage:
- Market volume and value
- Per Capita consumption
- Forecast of the market dynamics in the medium term
- Trade (exports and imports) in India
- Export and import prices
- Market trends, drivers and restraints
- Key market players and their profiles
Reasons to buy this report:
- Take advantage of the latest data
- Find deeper insights into current market developments
- Discover vital success factors affecting the market
This report is designed for manufacturers, distributors, importers, and wholesalers, as well as for investors, consultants and advisors.
In this report, you can find information that helps you to make informed decisions on the following issues:
- How to diversify your business and benefit from new market opportunities
- How to load your idle production capacity
- How to boost your sales on overseas markets
- How to increase your profit margins
- How to make your supply chain more sustainable
- How to reduce your production and supply chain costs
- How to outsource production to other countries
- How to prepare your business for global expansion
While doing this research, we combine the accumulated expertise of our analysts and the capabilities of artificial intelligence. The AI-based platform, developed by our data scientists, constitutes the key working tool for business analysts, empowering them to discover deep insights and ideas from the marketing data.
-
1. INTRODUCTION
Making Data-Driven Decisions to Grow Your Business
- REPORT DESCRIPTION
- RESEARCH METHODOLOGY AND AI PLATFORM
- DATA-DRIVEN DECISIONS FOR YOUR BUSINESS
- GLOSSARY AND SPECIFIC TERMS
-
2. EXECUTIVE SUMMARY
A Quick Overview of Market Performance
- KEY FINDINGS
- MARKET TRENDS This Chapter is Available Only for the Professional Edition PRO
-
3. MARKET OVERVIEW
Understanding the Current State of The Market and Its Prospects
- MARKET SIZE
- MARKET STRUCTURE
- TRADE BALANCE
- PER CAPITA CONSUMPTION
- MARKET FORECAST TO 2030
-
4. MOST PROMISING PRODUCT
Finding New Products to Diversify Your Business
This Chapter is Available Only for the Professional Edition PRO- TOP PRODUCTS TO DIVERSIFY YOUR BUSINESS
- BEST-SELLING PRODUCTS
- MOST CONSUMED PRODUCT
- MOST TRADED PRODUCT
- MOST PROFITABLE PRODUCT FOR EXPORT
-
5. MOST PROMISING SUPPLYING COUNTRIES
Choosing the Best Countries to Establish Your Sustainable Supply Chain
This Chapter is Available Only for the Professional Edition PRO- TOP COUNTRIES TO SOURCE YOUR PRODUCT
- TOP PRODUCING COUNTRIES
- TOP EXPORTING COUNTRIES
- LOW-COST EXPORTING COUNTRIES
-
6. MOST PROMISING OVERSEAS MARKETS
Choosing the Best Countries to Boost Your Exports
This Chapter is Available Only for the Professional Edition PRO- TOP OVERSEAS MARKETS FOR EXPORTING YOUR PRODUCT
- TOP CONSUMING MARKETS
- UNSATURATED MARKETS
- TOP IMPORTING MARKETS
- MOST PROFITABLE MARKETS
7. PRODUCTION
The Latest Trends and Insights into The Industry
- PRODUCTION VOLUME AND VALUE
8. IMPORTS
The Largest Import Supplying Countries
- IMPORTS FROM 2012–2023
- IMPORTS BY COUNTRY
- IMPORT PRICES BY COUNTRY
9. EXPORTS
The Largest Destinations for Exports
- EXPORTS FROM 2012–2023
- EXPORTS BY COUNTRY
- EXPORT PRICES BY COUNTRY
-
10. PROFILES OF MAJOR PRODUCERS
The Largest Producers on The Market and Their Profiles
This Chapter is Available Only for the Professional Edition PRO -
LIST OF TABLES
- Key Findings In 2023
- Market Volume, In Physical Terms, 2012–2023
- Market Value, 2012–2023
- Per Capita Consumption In 2012-2023
- Imports, In Physical Terms, By Country, 2012–2023
- Imports, In Value Terms, By Country, 2012–2023
- Import Prices, By Country Of Origin, 2012–2023
- Exports, In Physical Terms, By Country, 2012–2023
- Exports, In Value Terms, By Country, 2012–2023
- Export Prices, By Country Of Destination, 2012–2023
-
LIST OF FIGURES
- Market Volume, In Physical Terms, 2012–2023
- Market Value, 2012–2023
- Market Structure – Domestic Supply vs. Imports, In Physical Terms, 2012-2023
- Market Structure – Domestic Supply vs. Imports, In Value Terms, 2012-2023
- Trade Balance, In Physical Terms, 2012-2023
- Trade Balance, In Value Terms, 2012-2023
- Per Capita Consumption, 2012-2023
- Market Volume Forecast to 2030
- Market Value Forecast to 2030
- Products: Market Size And Growth, By Type
- Products: Average Per Capita Consumption, By Type
- Products: Exports And Growth, By Type
- Products: Export Prices And Growth, By Type
- Production Volume And Growth
- Exports And Growth
- Export Prices And Growth
- Market Size And Growth
- Per Capita Consumption
- Imports And Growth
- Import Prices
- Production, In Physical Terms, 2012–2023
- Production, In Value Terms, 2012–2023
- Imports, In Physical Terms, 2012–2023
- Imports, In Value Terms, 2012–2023
- Imports, In Physical Terms, By Country, 2023
- Imports, In Physical Terms, By Country, 2012–2023
- Imports, In Value Terms, By Country, 2012–2023
- Import Prices, By Country Of Origin, 2012–2023
- Exports, In Physical Terms, 2012–2023
- Exports, In Value Terms, 2012–2023
- Exports, In Physical Terms, By Country, 2023
- Exports, In Physical Terms, By Country, 2012–2023
- Exports, In Value Terms, By Country, 2012–2023
- Export Prices, By Country Of Destination, 2012–2023


