
Hong Kong SAR, China - Television Receivers - Market Analysis, Forecast, Size, Trends and Insights
Get instant access to more than 2 million reports, dashboards, and datasets on the IndexBox Platform.
View PricingSignificant Drop in Hong Kong Television Receiver Imports to $22M in October 2023
Hong Kong Television Receiver Imports
In October 2023, purchases abroad of television receivers decreased by -19.5% to 349K units, falling for the second month in a row after two months of growth. Over the period under review, imports showed a perceptible downturn. The pace of growth appeared the most rapid in March 2023 with an increase of 101% against the previous month. Over the period under review, imports hit record highs at 579K units in December 2022; however, from January 2023 to October 2023, imports failed to regain momentum.
In value terms, television receiver imports fell rapidly to $22M (IndexBox estimates) in October 2023. Overall, imports showed a mild curtailment. The pace of growth was the most pronounced in March 2023 with an increase of 55% against the previous month. Imports peaked at 31M units in December 2022; however, from January 2023 to October 2023, imports remained at a lower figure.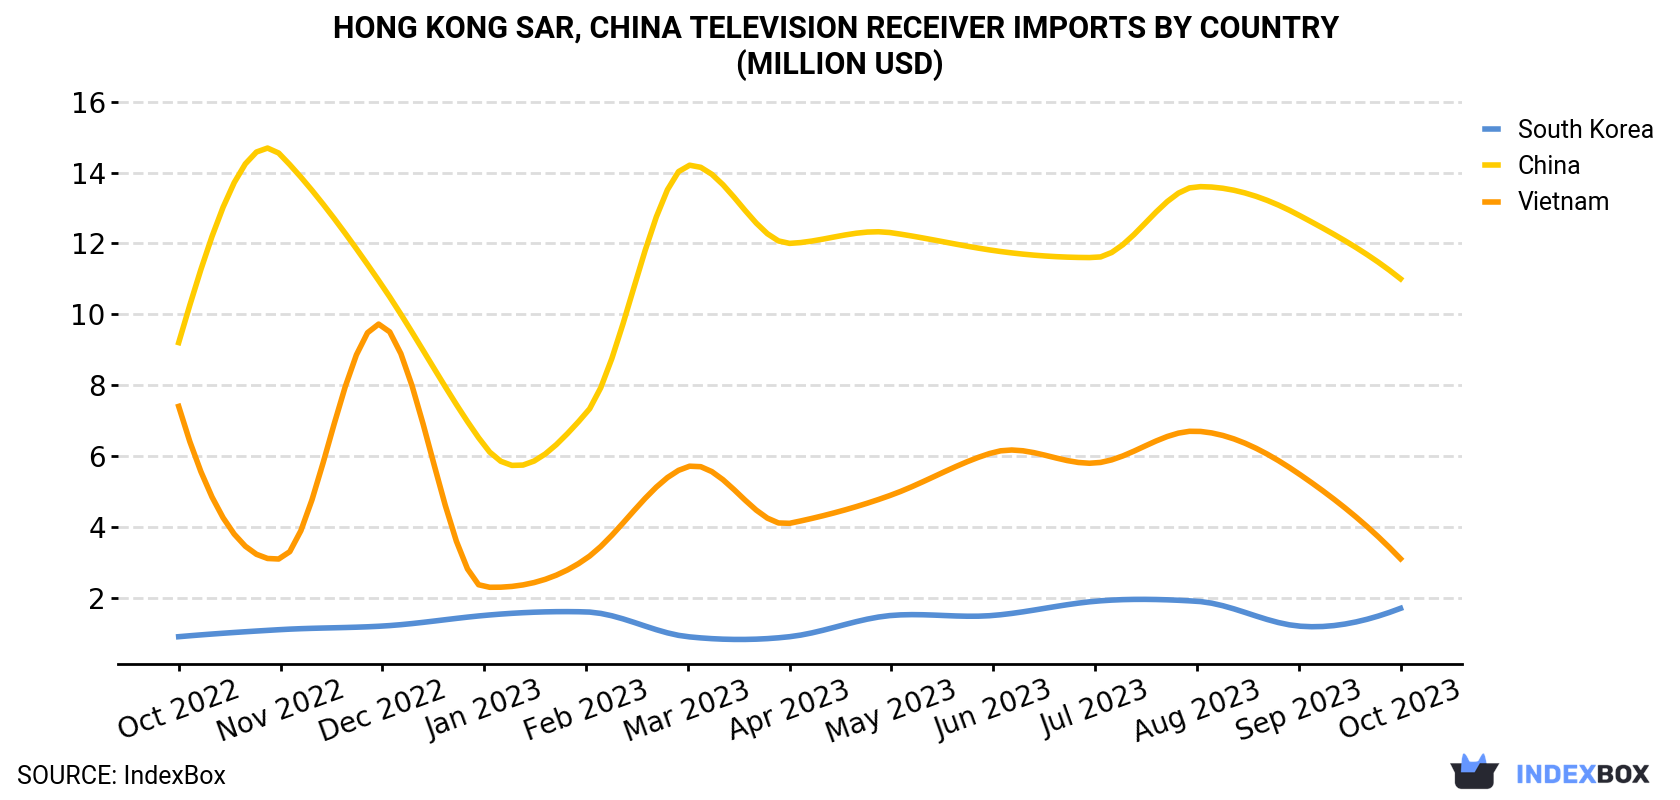
| COUNTRY | Import Value of Television Receiver in Hong Kong (million USD) | ||||||||||||
|---|---|---|---|---|---|---|---|---|---|---|---|---|---|
| Oct 2022 | Nov 2022 | Dec 2022 | Jan 2023 | Feb 2023 | Mar 2023 | Apr 2023 | May 2023 | Jun 2023 | Jul 2023 | Aug 2023 | Sep 2023 | Oct 2023 | |
| China | 9.2 | 14.5 | 10.8 | 6.3 | 7.2 | 14.2 | 12.0 | 12.3 | 11.8 | 11.6 | 13.6 | 12.8 | 11.0 |
| Vietnam | 7.4 | 3.1 | 9.7 | 2.3 | 3.1 | 5.7 | 4.1 | 4.9 | 6.1 | 5.8 | 6.7 | 5.5 | 3.1 |
| South Korea | 0.9 | 1.1 | 1.2 | 1.5 | 1.6 | 0.9 | 0.9 | 1.5 | 1.5 | 1.9 | 1.9 | 1.2 | 1.7 |
| Others | 9.0 | 7.8 | 9.5 | 7.5 | 5.8 | 6.8 | 6.8 | 3.6 | 5.9 | 6.1 | 7.1 | 6.8 | 6.4 |
| Total | 26.5 | 26.5 | 31.2 | 17.4 | 17.7 | 27.6 | 23.8 | 22.3 | 25.3 | 25.4 | 29.3 | 26.4 | 22.2 |
Imports by Country
China (168K units), South Korea (131K units) and Vietnam (13K units) were the main suppliers of television receiver imports to Hong Kong, with a combined 90% share of total imports.
From October 2022 to October 2023, the biggest increases were in China (with a CAGR of +0.6%), while purchases for the other leaders experienced a decline.
In value terms, China ($11M) constituted the largest supplier of television receiver to Hong Kong, comprising 50% of total imports. The second position in the ranking was held by Vietnam ($3.1M), with a 14% share of total imports.
From October 2022 to October 2023, the average monthly growth rate of value from China amounted to +1.5%. The remaining supplying countries recorded the following average monthly rates of imports growth: Vietnam (-6.9% per month) and South Korea (+5.4% per month).
Imports by Type
Reception apparatus for television, whether or not incorporating radio-broadcast receivers or sound or video recording or reproducing apparatus; incorporating a colour video display or screen (196K units) and tuner blocks (153K units) were the main products of television receiver imports to Hong Kong.
From October 2022 to October 2023, the biggest increases were in reception apparatus for television, whether or not incorporating radio-broadcast receivers or sound or video recording or reproducing apparatus; incorporating a colour video display or screen (with a CAGR of -0.1%).
In value terms, reception apparatus for television, whether or not incorporating radio-broadcast receivers or sound or video recording or reproducing apparatus; incorporating a colour video display or screen ($16M) constituted the largest type of television receiver supplied to Hong Kong, comprising 72% of total imports. The second position in the ranking was held by tuner blocks ($6.1M), with a 28% share of total imports.
Import Prices by Country
In October 2023, the television receiver price amounted to $63.6 per unit (CIF, Hong Kong), increasing by 4.4% against the previous month. Over the period under review, the import price recorded a relatively flat trend pattern. The pace of growth appeared the most rapid in February 2023 when the average import price increased by 45% month-to-month. The import price peaked at $69.1 per unit in June 2023; however, from July 2023 to October 2023, import prices stood at a somewhat lower figure.
Prices varied noticeably by the country of origin: the country with the highest price was Indonesia ($345 per unit), while the price for South Korea ($13.1 per unit) was amongst the lowest.
From October 2022 to October 2023, the most notable rate of growth in terms of prices was attained by Vietnam (+9.8%), while the prices for the other major suppliers experienced more modest paces of growth.
This report provides an in-depth analysis of the television receiver market in Hong Kong SAR, China. Within it, you will discover the latest data on market trends and opportunities by country, consumption, production and price developments, as well as the global trade (imports and exports). The forecast exhibits the market prospects through 2030.
Product coverage:
- Prodcom 26402020 - Tuner blocks for CTV/VCR and cable TV receiver units (colour video tuners) (excluding those which isolate highfrequency television signals)
- Prodcom 26402040 - Colour television projection equipment
- Prodcom 26402090 - Other television receivers, whether or not combined with radio-broadcast receivers or sound or video recording or reproduction apparatus n.e.c.
Country coverage:
- Hong Kong SAR
Data coverage:
- Market volume and value
- Per Capita consumption
- Forecast of the market dynamics in the medium term
- Trade (exports and imports) in Hong Kong SAR, China
- Export and import prices
- Market trends, drivers and restraints
- Key market players and their profiles
Reasons to buy this report:
- Take advantage of the latest data
- Find deeper insights into current market developments
- Discover vital success factors affecting the market
This report is designed for manufacturers, distributors, importers, and wholesalers, as well as for investors, consultants and advisors.
In this report, you can find information that helps you to make informed decisions on the following issues:
- How to diversify your business and benefit from new market opportunities
- How to load your idle production capacity
- How to boost your sales on overseas markets
- How to increase your profit margins
- How to make your supply chain more sustainable
- How to reduce your production and supply chain costs
- How to outsource production to other countries
- How to prepare your business for global expansion
While doing this research, we combine the accumulated expertise of our analysts and the capabilities of artificial intelligence. The AI-based platform, developed by our data scientists, constitutes the key working tool for business analysts, empowering them to discover deep insights and ideas from the marketing data.
-
1. INTRODUCTION
Making Data-Driven Decisions to Grow Your Business
- REPORT DESCRIPTION
- RESEARCH METHODOLOGY AND AI PLATFORM
- DATA-DRIVEN DECISIONS FOR YOUR BUSINESS
- GLOSSARY AND SPECIFIC TERMS
-
2. EXECUTIVE SUMMARY
A Quick Overview of Market Performance
- KEY FINDINGS
- MARKET TRENDS This Chapter is Available Only for the Professional Edition PRO
-
3. MARKET OVERVIEW
Understanding the Current State of The Market and Its Prospects
- MARKET SIZE
- MARKET STRUCTURE
- TRADE BALANCE
- PER CAPITA CONSUMPTION
- MARKET FORECAST TO 2030
-
4. MOST PROMISING PRODUCT
Finding New Products to Diversify Your Business
This Chapter is Available Only for the Professional Edition PRO- TOP PRODUCTS TO DIVERSIFY YOUR BUSINESS
- BEST-SELLING PRODUCTS
- MOST CONSUMED PRODUCT
- MOST TRADED PRODUCT
- MOST PROFITABLE PRODUCT FOR EXPORT
-
5. MOST PROMISING SUPPLYING COUNTRIES
Choosing the Best Countries to Establish Your Sustainable Supply Chain
This Chapter is Available Only for the Professional Edition PRO- TOP COUNTRIES TO SOURCE YOUR PRODUCT
- TOP PRODUCING COUNTRIES
- TOP EXPORTING COUNTRIES
- LOW-COST EXPORTING COUNTRIES
-
6. MOST PROMISING OVERSEAS MARKETS
Choosing the Best Countries to Boost Your Exports
This Chapter is Available Only for the Professional Edition PRO- TOP OVERSEAS MARKETS FOR EXPORTING YOUR PRODUCT
- TOP CONSUMING MARKETS
- UNSATURATED MARKETS
- TOP IMPORTING MARKETS
- MOST PROFITABLE MARKETS
7. PRODUCTION
The Latest Trends and Insights into The Industry
- PRODUCTION VOLUME AND VALUE
8. IMPORTS
The Largest Import Supplying Countries
- IMPORTS FROM 2012–2023
- IMPORTS BY COUNTRY
- IMPORT PRICES BY COUNTRY
9. EXPORTS
The Largest Destinations for Exports
- EXPORTS FROM 2012–2023
- EXPORTS BY COUNTRY
- EXPORT PRICES BY COUNTRY
-
10. PROFILES OF MAJOR PRODUCERS
The Largest Producers on The Market and Their Profiles
This Chapter is Available Only for the Professional Edition PRO -
LIST OF TABLES
- Key Findings In 2023
- Market Volume, In Physical Terms, 2012–2023
- Market Value, 2012–2023
- Per Capita Consumption In 2012-2023
- Imports, In Physical Terms, By Country, 2012–2023
- Imports, In Value Terms, By Country, 2012–2023
- Import Prices, By Country Of Origin, 2012–2023
- Exports, In Physical Terms, By Country, 2012–2023
- Exports, In Value Terms, By Country, 2012–2023
- Export Prices, By Country Of Destination, 2012–2023
-
LIST OF FIGURES
- Market Volume, In Physical Terms, 2012–2023
- Market Value, 2012–2023
- Market Structure – Domestic Supply vs. Imports, In Physical Terms, 2012-2023
- Market Structure – Domestic Supply vs. Imports, In Value Terms, 2012-2023
- Trade Balance, In Physical Terms, 2012-2023
- Trade Balance, In Value Terms, 2012-2023
- Per Capita Consumption, 2012-2023
- Market Volume Forecast to 2030
- Market Value Forecast to 2030
- Products: Market Size And Growth, By Type
- Products: Average Per Capita Consumption, By Type
- Products: Exports And Growth, By Type
- Products: Export Prices And Growth, By Type
- Production Volume And Growth
- Exports And Growth
- Export Prices And Growth
- Market Size And Growth
- Per Capita Consumption
- Imports And Growth
- Import Prices
- Production, In Physical Terms, 2012–2023
- Production, In Value Terms, 2012–2023
- Imports, In Physical Terms, 2012–2023
- Imports, In Value Terms, 2012–2023
- Imports, In Physical Terms, By Country, 2023
- Imports, In Physical Terms, By Country, 2012–2023
- Imports, In Value Terms, By Country, 2012–2023
- Import Prices, By Country Of Origin, 2012–2023
- Exports, In Physical Terms, 2012–2023
- Exports, In Value Terms, 2012–2023
- Exports, In Physical Terms, By Country, 2023
- Exports, In Physical Terms, By Country, 2012–2023
- Exports, In Value Terms, By Country, 2012–2023
- Export Prices, By Country Of Destination, 2012–2023


