Hong Kong SAR, China - Motors Of An Output Not Exceeding 37.5 W; Other Dc Motors And Dc Generators - Market Analysis, Forecast, Size, Trends and Insights
Get instant access to more than 2 million reports, dashboards, and datasets on the IndexBox Platform.
View PricingIn October 2023, Hong Kong Sees a 2% Increase in Imports, Reaching $43M
Hong Kong DC Motor Imports
In October 2023, purchases abroad of DC motors decreased by -4.5% to 31M units, falling for the second month in a row after three months of growth. Over the period under review, imports, however, saw a relatively flat trend pattern. The pace of growth appeared the most rapid in August 2023 when imports increased by 187% m-o-m. As a result, imports reached the peak of 105M units. From September 2023 to October 2023, the growth of imports remained at a lower figure.
In value terms, DC motor imports rose to $43M (IndexBox estimates) in October 2023. In general, imports saw a relatively flat trend pattern. The growth pace was the most rapid in March 2023 when imports increased by 41% month-to-month. Imports peaked at 50M units in August 2023; however, from September 2023 to October 2023, imports failed to regain momentum.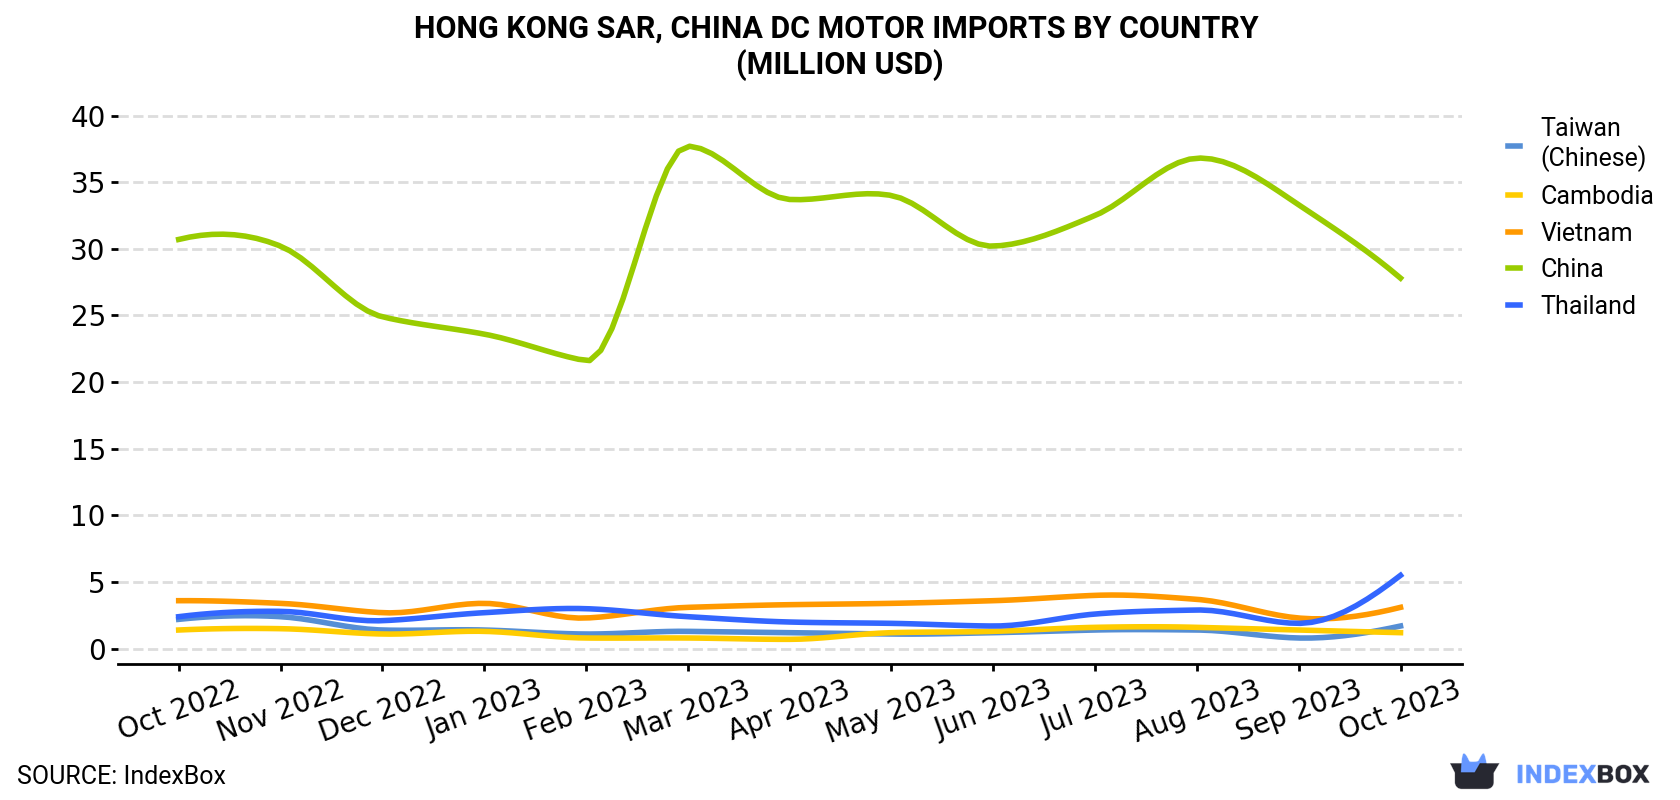
| COUNTRY | Import Value of DC Motor in Hong Kong (million USD) | ||||||||||||
|---|---|---|---|---|---|---|---|---|---|---|---|---|---|
| Oct 2022 | Nov 2022 | Dec 2022 | Jan 2023 | Feb 2023 | Mar 2023 | Apr 2023 | May 2023 | Jun 2023 | Jul 2023 | Aug 2023 | Sep 2023 | Oct 2023 | |
| China | 30.7 | 30.2 | 24.9 | 23.6 | 21.6 | 37.7 | 33.7 | 34.0 | 30.2 | 32.5 | 36.8 | 33.3 | 27.8 |
| Thailand | 2.4 | 2.8 | 2.1 | 2.7 | 3.0 | 2.4 | 2.0 | 1.9 | 1.7 | 2.6 | 2.9 | 1.9 | 5.5 |
| Vietnam | 3.6 | 3.4 | 2.7 | 3.4 | 2.3 | 3.1 | 3.3 | 3.4 | 3.6 | 4.0 | 3.7 | 2.3 | 3.1 |
| Taiwan (Chinese) | 2.2 | 2.4 | 1.4 | 1.4 | 1.1 | 1.3 | 1.2 | 1.1 | 1.2 | 1.4 | 1.4 | 0.8 | 1.7 |
| Cambodia | 1.4 | 1.5 | 1.1 | 1.3 | 0.8 | 0.8 | 0.7 | 1.2 | 1.3 | 1.6 | 1.6 | 1.4 | 1.2 |
| Others | 3.2 | 3.8 | 2.2 | 4.2 | 6.1 | 3.9 | 3.5 | 3.1 | 4.2 | 4.2 | 3.9 | 3.0 | 4.2 |
| Total | 43.5 | 44.1 | 34.4 | 36.5 | 34.8 | 49.1 | 44.5 | 44.8 | 42.3 | 46.3 | 50.3 | 42.7 | 43.3 |
Imports by Country
In October 2023, China (20M units) constituted the largest DC motor supplier to Hong Kong, accounting for a 64% share of total imports. Moreover, DC motor imports from China exceeded the figures recorded by the second-largest supplier, Vietnam (6M units), threefold. Cambodia (1.3M units) ranked third in terms of total imports with a 4.1% share.
From October 2022 to October 2023, the average monthly rate of growth in terms of volume from China was relatively modest. The remaining supplying countries recorded the following average monthly rates of imports growth: Vietnam (+0.9% per month) and Cambodia (+0.7% per month).
In value terms, China ($28M) constituted the largest supplier of DC motor to Hong Kong, comprising 64% of total imports. The second position in the ranking was held by Thailand ($5.5M), with a 13% share of total imports. It was followed by Vietnam, with a 7.1% share.
From October 2022 to October 2023, the average monthly rate of growth in terms of value from China was relatively modest. The remaining supplying countries recorded the following average monthly rates of imports growth: Thailand (+7.0% per month) and Vietnam (-1.4% per month).
Imports by Type
In October 2023, electric motors (29M units) was the main type of DC motor supplied to Hong Kong, with a 94% share of total imports. Moreover, electric motors exceeded the figures recorded for the second-largest type, electric motors and generators (1.9M units), more than tenfold. The third position in this ranking was held by electric motors and generators (17K units), with a 0.1% share.
From October 2022 to October 2023, the average monthly rate of growth in terms of the volume of import of electric motors was relatively modest. With regard to the other supplied products, the following average monthly rates of growth were recorded: electric motors and generators (+2.5% per month) and electric motors and generators (-3.1% per month).
In value terms, electric motors ($35M) constituted the largest type of DC motor supplied to Hong Kong, comprising 81% of total imports. The second position in the ranking was taken by electric motors and generators ($7.6M), with a 17% share of total imports. It was followed by electric motors and generators, with a 1.3% share.
Import Prices by Country
In October 2023, the dc motor price stood at $1.4 per unit (CIF, Hong Kong), picking up by 6.3% against the previous month. Overall, the import price, however, saw a relatively flat trend pattern. The pace of growth was the most pronounced in September 2023 when the average import price increased by 173% against the previous month. Over the period under review, average import prices reached the peak figure at $1.5 per unit in October 2022; however, from November 2022 to October 2023, import prices failed to regain momentum.
Prices varied noticeably by the country of origin: the country with the highest price was Thailand ($4.8 per unit), while the price for Vietnam ($509 per thousand units) was amongst the lowest.
From October 2022 to October 2023, the most notable rate of growth in terms of prices was attained by Thailand (+4.9%), while the prices for the other major suppliers experienced mixed trend patterns.
This report provides an in-depth analysis of the dc motor market in Hong Kong SAR, China. Within it, you will discover the latest data on market trends and opportunities by country, consumption, production and price developments, as well as the global trade (imports and exports). The forecast exhibits the market prospects through 2030.
Product coverage:
- Prodcom 27111010 - Electric motors of an output . .37,5 W (including synchronous motors . .18 W, universal AC/DC motors, AC and DC motors)
- Prodcom 27111030 - DC motors and generators of an output > .37,5 W but . .750 W (excluding starter motors for internal combustion engines)
- Prodcom 27111053 -
- Prodcom 27111055 -
- Prodcom 27111070 - DC motors and generators of an output > .75 kW but . .375 kW (excluding starter motors for internal combustion engines)
- Prodcom 27111090 - DC motors and generators of an output > .375 kW (excluding starter motors for internal combustion engines)
Country coverage:
- Hong Kong SAR
Data coverage:
- Market volume and value
- Per Capita consumption
- Forecast of the market dynamics in the medium term
- Trade (exports and imports) in Hong Kong SAR, China
- Export and import prices
- Market trends, drivers and restraints
- Key market players and their profiles
Reasons to buy this report:
- Take advantage of the latest data
- Find deeper insights into current market developments
- Discover vital success factors affecting the market
This report is designed for manufacturers, distributors, importers, and wholesalers, as well as for investors, consultants and advisors.
In this report, you can find information that helps you to make informed decisions on the following issues:
- How to diversify your business and benefit from new market opportunities
- How to load your idle production capacity
- How to boost your sales on overseas markets
- How to increase your profit margins
- How to make your supply chain more sustainable
- How to reduce your production and supply chain costs
- How to outsource production to other countries
- How to prepare your business for global expansion
While doing this research, we combine the accumulated expertise of our analysts and the capabilities of artificial intelligence. The AI-based platform, developed by our data scientists, constitutes the key working tool for business analysts, empowering them to discover deep insights and ideas from the marketing data.
-
1. INTRODUCTION
Making Data-Driven Decisions to Grow Your Business
- REPORT DESCRIPTION
- RESEARCH METHODOLOGY AND AI PLATFORM
- DATA-DRIVEN DECISIONS FOR YOUR BUSINESS
- GLOSSARY AND SPECIFIC TERMS
-
2. EXECUTIVE SUMMARY
A Quick Overview of Market Performance
- KEY FINDINGS
- MARKET TRENDS This Chapter is Available Only for the Professional Edition PRO
-
3. MARKET OVERVIEW
Understanding the Current State of The Market and Its Prospects
- MARKET SIZE
- MARKET STRUCTURE
- TRADE BALANCE
- PER CAPITA CONSUMPTION
- MARKET FORECAST TO 2030
-
4. MOST PROMISING PRODUCT
Finding New Products to Diversify Your Business
This Chapter is Available Only for the Professional Edition PRO- TOP PRODUCTS TO DIVERSIFY YOUR BUSINESS
- BEST-SELLING PRODUCTS
- MOST CONSUMED PRODUCT
- MOST TRADED PRODUCT
- MOST PROFITABLE PRODUCT FOR EXPORT
-
5. MOST PROMISING SUPPLYING COUNTRIES
Choosing the Best Countries to Establish Your Sustainable Supply Chain
This Chapter is Available Only for the Professional Edition PRO- TOP COUNTRIES TO SOURCE YOUR PRODUCT
- TOP PRODUCING COUNTRIES
- TOP EXPORTING COUNTRIES
- LOW-COST EXPORTING COUNTRIES
-
6. MOST PROMISING OVERSEAS MARKETS
Choosing the Best Countries to Boost Your Exports
This Chapter is Available Only for the Professional Edition PRO- TOP OVERSEAS MARKETS FOR EXPORTING YOUR PRODUCT
- TOP CONSUMING MARKETS
- UNSATURATED MARKETS
- TOP IMPORTING MARKETS
- MOST PROFITABLE MARKETS
7. PRODUCTION
The Latest Trends and Insights into The Industry
- PRODUCTION VOLUME AND VALUE
8. IMPORTS
The Largest Import Supplying Countries
- IMPORTS FROM 2012–2023
- IMPORTS BY COUNTRY
- IMPORT PRICES BY COUNTRY
9. EXPORTS
The Largest Destinations for Exports
- EXPORTS FROM 2012–2023
- EXPORTS BY COUNTRY
- EXPORT PRICES BY COUNTRY
-
10. PROFILES OF MAJOR PRODUCERS
The Largest Producers on The Market and Their Profiles
This Chapter is Available Only for the Professional Edition PRO -
LIST OF TABLES
- Key Findings In 2023
- Market Volume, In Physical Terms, 2012–2023
- Market Value, 2012–2023
- Per Capita Consumption In 2012-2023
- Imports, In Physical Terms, By Country, 2012–2023
- Imports, In Value Terms, By Country, 2012–2023
- Import Prices, By Country Of Origin, 2012–2023
- Exports, In Physical Terms, By Country, 2012–2023
- Exports, In Value Terms, By Country, 2012–2023
- Export Prices, By Country Of Destination, 2012–2023
-
LIST OF FIGURES
- Market Volume, In Physical Terms, 2012–2023
- Market Value, 2012–2023
- Market Structure – Domestic Supply vs. Imports, In Physical Terms, 2012-2023
- Market Structure – Domestic Supply vs. Imports, In Value Terms, 2012-2023
- Trade Balance, In Physical Terms, 2012-2023
- Trade Balance, In Value Terms, 2012-2023
- Per Capita Consumption, 2012-2023
- Market Volume Forecast to 2030
- Market Value Forecast to 2030
- Products: Market Size And Growth, By Type
- Products: Average Per Capita Consumption, By Type
- Products: Exports And Growth, By Type
- Products: Export Prices And Growth, By Type
- Production Volume And Growth
- Exports And Growth
- Export Prices And Growth
- Market Size And Growth
- Per Capita Consumption
- Imports And Growth
- Import Prices
- Production, In Physical Terms, 2012–2023
- Production, In Value Terms, 2012–2023
- Imports, In Physical Terms, 2012–2023
- Imports, In Value Terms, 2012–2023
- Imports, In Physical Terms, By Country, 2023
- Imports, In Physical Terms, By Country, 2012–2023
- Imports, In Value Terms, By Country, 2012–2023
- Import Prices, By Country Of Origin, 2012–2023
- Exports, In Physical Terms, 2012–2023
- Exports, In Value Terms, 2012–2023
- Exports, In Physical Terms, By Country, 2023
- Exports, In Physical Terms, By Country, 2012–2023
- Exports, In Value Terms, By Country, 2012–2023
- Export Prices, By Country Of Destination, 2012–2023


