
China - Motors Of An Output Not Exceeding 37.5 W; Other Dc Motors And Dc Generators - Market Analysis, Forecast, Size, Trends and Insights
Get instant access to more than 2 million reports, dashboards, and datasets on the IndexBox Platform.
View PricingChina's June 2023 Export of DC Motors Reaches $616M Average
China DC Motor Exports
In June 2023, shipments abroad of DC motors was finally on the rise to reach 172M units after two months of decline. Over the period under review, exports, however, recorded a relatively flat trend pattern. The most prominent rate of growth was recorded in March 2023 when exports increased by 38% m-o-m. The exports peaked at 186M units in June 2022; however, from July 2022 to June 2023, the exports stood at a somewhat lower figure.
In value terms, DC motor exports fell slightly to $616M (IndexBox estimates) in June 2023. In general, exports, however, continue to indicate a relatively flat trend pattern. The growth pace was the most rapid in March 2023 with an increase of 45% against the previous month. Over the period under review, the exports reached the peak figure at 709M units in July 2022; however, from August 2022 to June 2023, the exports stood at a somewhat lower figure. 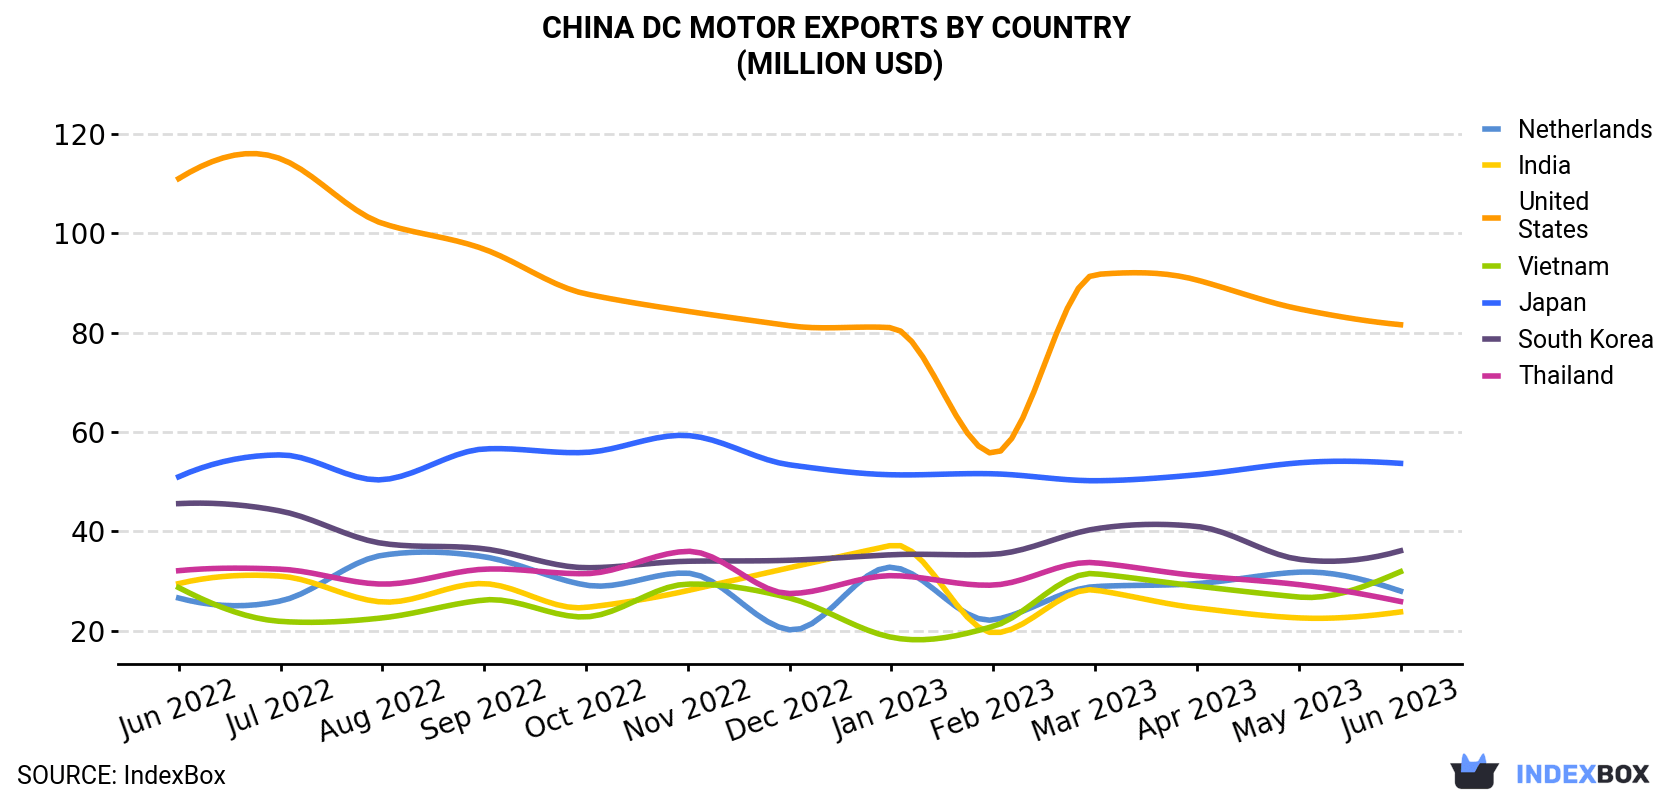
| COUNTRY | Export Value of DC Motor in China (million USD) | ||||||||||||
|---|---|---|---|---|---|---|---|---|---|---|---|---|---|
| Jun 2022 | Jul 2022 | Aug 2022 | Sep 2022 | Oct 2022 | Nov 2022 | Dec 2022 | Jan 2023 | Feb 2023 | Mar 2023 | Apr 2023 | May 2023 | Jun 2023 | |
| United States | 111 | 115 | 102 | 96.8 | 87.8 | 84.3 | 81.4 | 81.0 | 55.7 | 91.7 | 90.6 | 84.8 | 81.6 |
| Japan | 51.0 | 55.4 | 50.4 | 56.6 | 55.9 | 59.3 | 53.4 | 51.4 | 51.6 | 50.2 | 51.4 | 53.8 | 53.7 |
| South Korea | 45.6 | 44.1 | 37.6 | 36.5 | 32.7 | 34.0 | 34.2 | 35.3 | 35.4 | 40.5 | 41.0 | 34.4 | 36.1 |
| Vietnam | 28.7 | 21.9 | 22.6 | 26.2 | 22.8 | 29.4 | 26.6 | 18.7 | 20.9 | 31.5 | 29.0 | 26.8 | 31.9 |
| Netherlands | 26.6 | 26.0 | 35.2 | 34.9 | 29.2 | 31.6 | 20.2 | 32.8 | 22.2 | 28.9 | 29.5 | 31.8 | 28.0 |
| Thailand | 32.1 | 32.4 | 29.4 | 32.4 | 31.5 | 36.0 | 27.5 | 31.1 | 29.2 | 33.7 | 31.1 | 29.3 | 25.9 |
| India | 29.5 | 31.0 | 25.8 | 29.5 | 24.7 | 28.1 | 32.7 | 37.2 | 19.6 | 28.2 | 24.6 | 22.6 | 23.8 |
| Others | 360 | 383 | 345 | 334 | 324 | 329 | 330 | 344 | 238 | 381 | 357 | 333 | 335 |
| Total | 685 | 709 | 649 | 647 | 609 | 632 | 606 | 632 | 473 | 686 | 654 | 616 | 616 |
Exports by Country
The Netherlands (16M units), India (15M units) and South Korea (13M units) were the main destinations of DC motor exports from China, together accounting for 26% of total exports. These countries were followed by Japan, Vietnam, the United States and Thailand, which together accounted for a further 26%.
From June 2022 to June 2023, the most notable rate of growth in terms of shipments, amongst the main countries of destination, was attained by Vietnam (with a CAGR of +1.7%), while the other leaders experienced mixed trend patterns.
In value terms, the United States ($82M), Japan ($54M) and South Korea ($36M) were the largest markets for DC motor exported from China worldwide, with a combined 28% share of total exports. These countries were followed by Vietnam, the Netherlands, Thailand and India, which together accounted for a further 18%.
Vietnam, with a CAGR of +0.9%, recorded the highest growth rate of the value of exports, in terms of the main countries of destination over the period under review, while shipments for the other leaders experienced more modest paces of growth.
Exports by Type
Electric motors (141M units) was the largest type of DC motor exported from China, with a 82% share of total exports. Moreover, electric motors exceeded the volume of the second product type, electric motors and generators (30M units), fivefold. Electric motors and generators (1.1M units) ranked third in terms of total exports with a 0.6% share.
From June 2022 to June 2023, the average monthly rate of growth in terms of the volume of export of electric motors was relatively modest. With regard to the other exported products, the following average monthly rates of growth were recorded: electric motors and generators (-0.0% per month) and electric motors and generators (-1.9% per month).
In value terms, electric motors and generators ($287M), electric motors ($264M) and electric motors and generators ($59M) appeared to be the most exported types of DC motors from China worldwide, together accounting for 99% of total exports. Electric motors and generators and electric motors and generators lagged somewhat behind, together accounting for a further 1%.
In terms of the main product categories, electric motors and generators; DC, of an output exceeding 375kW, with a CAGR of +9.8%, recorded the highest growth rate of the value of exports, over the period under review, while shipments for the other products experienced mixed trend patterns.
Export Prices by Country
In June 2023, the dc motor price amounted to $3.6 per unit (FOB, China), falling by -3.6% against the previous month. Overall, the export price showed a relatively flat trend pattern. The most prominent rate of growth was recorded in October 2022 when the average export price increased by 13% m-o-m. Over the period under review, the average export prices reached the maximum at $4.1 per unit in July 2022; however, from August 2022 to June 2023, the export prices remained at a lower figure.
There were significant differences in the average prices for the major foreign markets. In June 2023, the country with the highest price was Germany ($7.2 per unit), while the average price for exports to Singapore ($1.0 per unit) was amongst the lowest.
From June 2022 to June 2023, the most notable rate of growth in terms of prices was recorded for supplies to Germany (+4.3%), while the prices for the other major destinations experienced more modest paces of growth.
This report provides an in-depth analysis of the dc motor market in China. Within it, you will discover the latest data on market trends and opportunities by country, consumption, production and price developments, as well as the global trade (imports and exports). The forecast exhibits the market prospects through 2030.
Product coverage:
- Prodcom 27111010 - Electric motors of an output . .37,5 W (including synchronous motors . .18 W, universal AC/DC motors, AC and DC motors)
- Prodcom 27111030 - DC motors and generators of an output > .37,5 W but . .750 W (excluding starter motors for internal combustion engines)
- Prodcom 27111053 -
- Prodcom 27111055 -
- Prodcom 27111070 - DC motors and generators of an output > .75 kW but . .375 kW (excluding starter motors for internal combustion engines)
- Prodcom 27111090 - DC motors and generators of an output > .375 kW (excluding starter motors for internal combustion engines)
Country coverage:
Data coverage:
- Market volume and value
- Per Capita consumption
- Forecast of the market dynamics in the medium term
- Trade (exports and imports) in China
- Export and import prices
- Market trends, drivers and restraints
- Key market players and their profiles
Reasons to buy this report:
- Take advantage of the latest data
- Find deeper insights into current market developments
- Discover vital success factors affecting the market
This report is designed for manufacturers, distributors, importers, and wholesalers, as well as for investors, consultants and advisors.
In this report, you can find information that helps you to make informed decisions on the following issues:
- How to diversify your business and benefit from new market opportunities
- How to load your idle production capacity
- How to boost your sales on overseas markets
- How to increase your profit margins
- How to make your supply chain more sustainable
- How to reduce your production and supply chain costs
- How to outsource production to other countries
- How to prepare your business for global expansion
While doing this research, we combine the accumulated expertise of our analysts and the capabilities of artificial intelligence. The AI-based platform, developed by our data scientists, constitutes the key working tool for business analysts, empowering them to discover deep insights and ideas from the marketing data.
-
1. INTRODUCTION
Making Data-Driven Decisions to Grow Your Business
- REPORT DESCRIPTION
- RESEARCH METHODOLOGY AND AI PLATFORM
- DATA-DRIVEN DECISIONS FOR YOUR BUSINESS
- GLOSSARY AND SPECIFIC TERMS
-
2. EXECUTIVE SUMMARY
A Quick Overview of Market Performance
- KEY FINDINGS
- MARKET TRENDS This Chapter is Available Only for the Professional Edition PRO
-
3. MARKET OVERVIEW
Understanding the Current State of The Market and Its Prospects
- MARKET SIZE
- MARKET STRUCTURE
- TRADE BALANCE
- PER CAPITA CONSUMPTION
- MARKET FORECAST TO 2030
-
4. MOST PROMISING PRODUCT
Finding New Products to Diversify Your Business
This Chapter is Available Only for the Professional Edition PRO- TOP PRODUCTS TO DIVERSIFY YOUR BUSINESS
- BEST-SELLING PRODUCTS
- MOST CONSUMED PRODUCT
- MOST TRADED PRODUCT
- MOST PROFITABLE PRODUCT FOR EXPORT
-
5. MOST PROMISING SUPPLYING COUNTRIES
Choosing the Best Countries to Establish Your Sustainable Supply Chain
This Chapter is Available Only for the Professional Edition PRO- TOP COUNTRIES TO SOURCE YOUR PRODUCT
- TOP PRODUCING COUNTRIES
- TOP EXPORTING COUNTRIES
- LOW-COST EXPORTING COUNTRIES
-
6. MOST PROMISING OVERSEAS MARKETS
Choosing the Best Countries to Boost Your Exports
This Chapter is Available Only for the Professional Edition PRO- TOP OVERSEAS MARKETS FOR EXPORTING YOUR PRODUCT
- TOP CONSUMING MARKETS
- UNSATURATED MARKETS
- TOP IMPORTING MARKETS
- MOST PROFITABLE MARKETS
7. PRODUCTION
The Latest Trends and Insights into The Industry
- PRODUCTION VOLUME AND VALUE
8. IMPORTS
The Largest Import Supplying Countries
- IMPORTS FROM 2012–2023
- IMPORTS BY COUNTRY
- IMPORT PRICES BY COUNTRY
9. EXPORTS
The Largest Destinations for Exports
- EXPORTS FROM 2012–2023
- EXPORTS BY COUNTRY
- EXPORT PRICES BY COUNTRY
-
10. PROFILES OF MAJOR PRODUCERS
The Largest Producers on The Market and Their Profiles
This Chapter is Available Only for the Professional Edition PRO -
LIST OF TABLES
- Key Findings In 2023
- Market Volume, In Physical Terms, 2012–2023
- Market Value, 2012–2023
- Per Capita Consumption In 2012-2023
- Imports, In Physical Terms, By Country, 2012–2023
- Imports, In Value Terms, By Country, 2012–2023
- Import Prices, By Country Of Origin, 2012–2023
- Exports, In Physical Terms, By Country, 2012–2023
- Exports, In Value Terms, By Country, 2012–2023
- Export Prices, By Country Of Destination, 2012–2023
-
LIST OF FIGURES
- Market Volume, In Physical Terms, 2012–2023
- Market Value, 2012–2023
- Market Structure – Domestic Supply vs. Imports, In Physical Terms, 2012-2023
- Market Structure – Domestic Supply vs. Imports, In Value Terms, 2012-2023
- Trade Balance, In Physical Terms, 2012-2023
- Trade Balance, In Value Terms, 2012-2023
- Per Capita Consumption, 2012-2023
- Market Volume Forecast to 2030
- Market Value Forecast to 2030
- Products: Market Size And Growth, By Type
- Products: Average Per Capita Consumption, By Type
- Products: Exports And Growth, By Type
- Products: Export Prices And Growth, By Type
- Production Volume And Growth
- Exports And Growth
- Export Prices And Growth
- Market Size And Growth
- Per Capita Consumption
- Imports And Growth
- Import Prices
- Production, In Physical Terms, 2012–2023
- Production, In Value Terms, 2012–2023
- Imports, In Physical Terms, 2012–2023
- Imports, In Value Terms, 2012–2023
- Imports, In Physical Terms, By Country, 2023
- Imports, In Physical Terms, By Country, 2012–2023
- Imports, In Value Terms, By Country, 2012–2023
- Import Prices, By Country Of Origin, 2012–2023
- Exports, In Physical Terms, 2012–2023
- Exports, In Value Terms, 2012–2023
- Exports, In Physical Terms, By Country, 2023
- Exports, In Physical Terms, By Country, 2012–2023
- Exports, In Value Terms, By Country, 2012–2023
- Export Prices, By Country Of Destination, 2012–2023


