
Hong Kong SAR, China - Electronic Calculators And Pocket-Size Data Recording, Reproducing And Displaying Machines With Calculating Functions - Market Analysis, Forecast, Size, Trends and Insights
Get instant access to more than 2 million reports, dashboards, and datasets on the IndexBox Platform.
View PricingExport of Calculator From Hong Kongs Decreases 3% to $3.3M in November 2023
Hong Kong Calculator Exports
In November 2023, after two months of growth, there was significant decline in overseas shipments of electronic calculators and pocket-size data recording, reproducing and displaying machines with calculating functions, when their volume decreased by -7.5% to 535K units. In general, exports showed a deep contraction. The pace of growth appeared the most rapid in March 2023 when exports increased by 56% against the previous month. Over the period under review, the exports hit record highs at 1.6M units in November 2022; however, from December 2022 to November 2023, the exports stood at a somewhat lower figure.
In value terms, calculator exports declined modestly to $3.3M (IndexBox estimates) in November 2023. Over the period under review, exports continue to indicate a noticeable slump. The pace of growth was the most pronounced in September 2023 with an increase of 51% month-to-month. The exports peaked at 6M units in November 2022; however, from December 2022 to November 2023, the exports stood at a somewhat lower figure.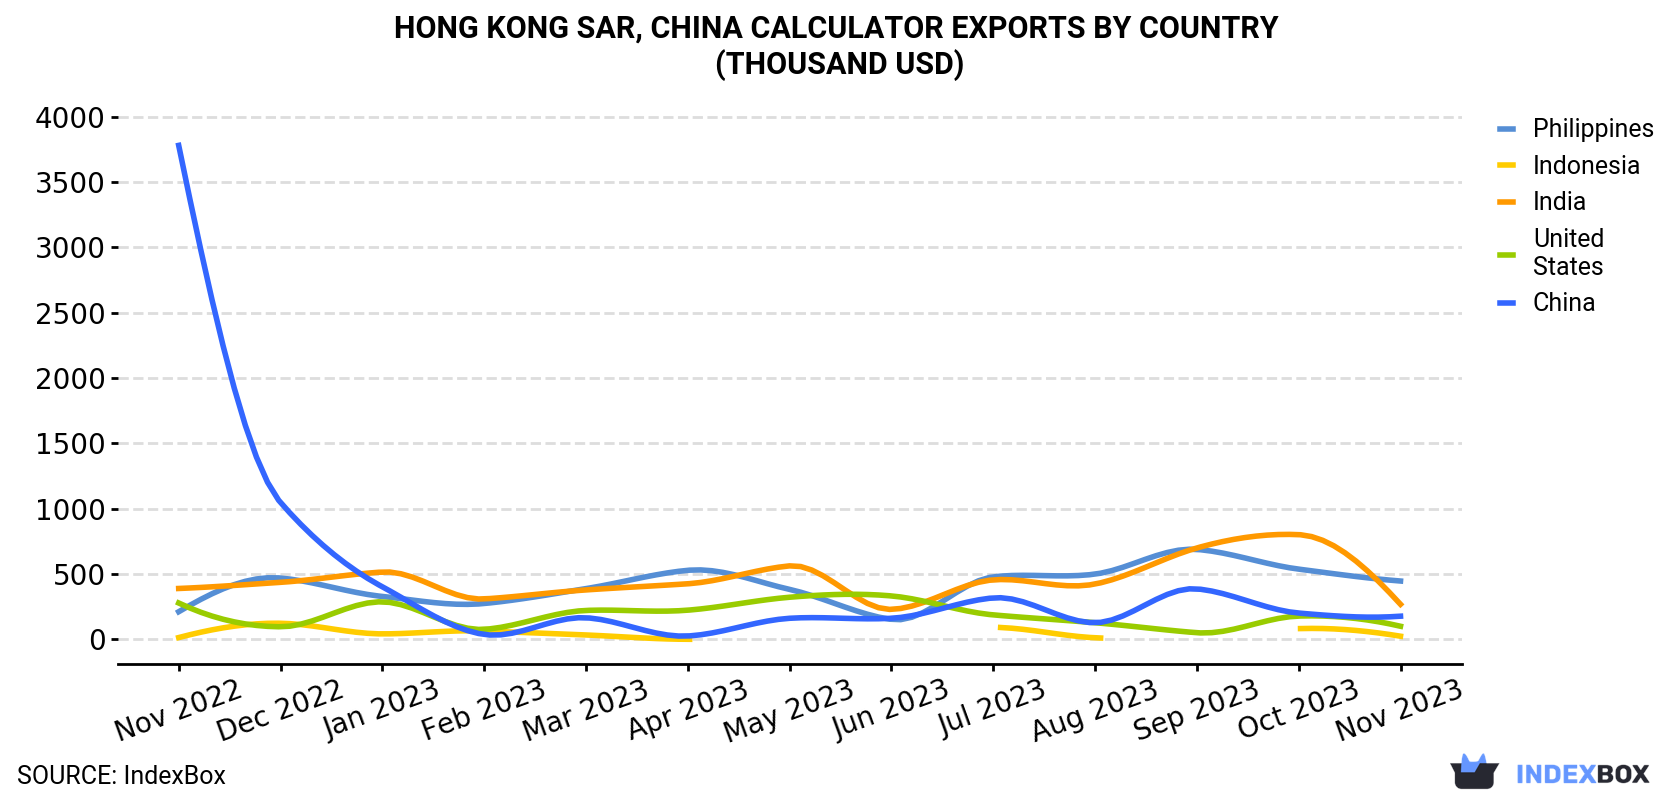
| COUNTRY | Export Value of Calculator in Hong Kong (thousand USD) | ||||||||||||
|---|---|---|---|---|---|---|---|---|---|---|---|---|---|
| Nov 2022 | Dec 2022 | Jan 2023 | Feb 2023 | Mar 2023 | Apr 2023 | May 2023 | Jun 2023 | Jul 2023 | Aug 2023 | Sep 2023 | Oct 2023 | Nov 2023 | |
| Philippines | 211 | 469 | 328 | 274 | 388 | 528 | 382 | 152 | 478 | 499 | 688 | 537 | 446 |
| India | 389 | 436 | 515 | 309 | 378 | 425 | 562 | 229 | 455 | 423 | 699 | 801 | 268 |
| China | 3,779 | 1,047 | 402 | 37.2 | 165 | 25.4 | 161 | 161 | 317 | 127 | 386 | 201 | 177 |
| United States | 278 | 96.1 | 287 | 76.3 | 221 | 223 | 322 | 332 | 187 | 127 | 50.6 | 178 | 100 |
| Indonesia | 13.4 | 123 | 41.7 | 63.7 | 33.3 | 0.2 | N/A | N/A | 91.9 | 12.0 | N/A | 81.8 | 23.9 |
| Others | 1,355 | 2,080 | 1,280 | 1,494 | 1,951 | 1,758 | 1,657 | 2,100 | 2,050 | 1,296 | 1,938 | 1,627 | 2,310 |
| Total | 6,025 | 4,250 | 2,854 | 2,255 | 3,135 | 2,960 | 3,084 | 2,974 | 3,579 | 2,485 | 3,762 | 3,428 | 3,325 |
Exports by Country
The Philippines (90K units), India (47K units) and China (45K units) were the main destinations of calculator exports from Hong Kong, together accounting for 34% of total exports.
From November 2022 to November 2023, the most notable rate of growth in terms of shipments, amongst the main countries of destination, was attained by the Philippines (with a CAGR of +8.2%), while the other leaders experienced mixed trend patterns.
In value terms, the Philippines ($446K), India ($268K) and China ($177K) constituted the largest markets for calculator exported from Hong Kong worldwide, together accounting for 27% of total exports.
The Philippines, with a CAGR of +6.4%, saw the highest growth rate of the value of exports, in terms of the main countries of destination over the period under review, while shipments for the other leaders experienced mixed trend patterns.
Exports by Type
Calculators; electronic, capable of operation without an external source of electric power (530K units) was the largest type of calculator exported from Hong Kong, with a 99% share of total exports. It was followed by calculating machines; electronic, (not incorporating a printing device), needing an external power source (3K units), with a 0.6% share of total exports.
From November 2022 to November 2023, the average monthly growth rate of the volume of export of calculators; electronic, capable of operation without an external source of electric power totaled -8.8%. With regard to the other exported products, the following average monthly rates of growth were recorded: calculating machines; electronic, (not incorporating a printing device), needing an external power source (+5.0% per month) and calculating machines; electronic, incorporating a printing device, needing an external source of power (-3.6% per month).
In value terms, calculators; electronic, capable of operation without an external source of electric power ($3.3M) remains the largest type of calculator exported from Hong Kong, comprising 98% of total exports. The second position in the ranking was held by calculating machines; electronic, incorporating a printing device, needing an external source of power ($67K), with a 2% share of total exports.
From November 2022 to November 2023, the average monthly growth rate of the export volume of calculators; electronic, capable of operation without an external source of electric power totaled -4.8%. With regard to the other exported products, the following average monthly rates of growth were recorded: calculating machines; electronic, incorporating a printing device, needing an external source of power (-6.1% per month) and calculating machines; electronic, (not incorporating a printing device), needing an external power source (+2.4% per month).
Export Prices by Country
In November 2023, the calculator price stood at $6.2 per unit (FOB, Hong Kong), with an increase of 4.9% against the previous month. In general, export price indicated a perceptible expansion from November 2022 to November 2023: its price increased at an average monthly rate of +4.3% over the last twelve months. The trend pattern, however, indicated some noticeable fluctuations being recorded throughout the analyzed period. Based on November 2023 figures, calculator export price decreased by -6.0% against September 2023 indices. The pace of growth was the most pronounced in February 2023 when the average export price increased by 45% against the previous month. As a result, the export price reached the peak level of $6,625 per thousand units. From March 2023 to November 2023, the the average export prices remained at a somewhat lower figure.
Prices varied noticeably by the country of destination: the country with the highest price was Kuwait ($9.2 per unit), while the average price for exports to Indonesia ($1.3 per unit) was amongst the lowest.
From November 2022 to November 2023, the most notable rate of growth in terms of prices was recorded for supplies to India (+5.2%), while the prices for the other major destinations experienced more modest paces of growth.
This report provides an in-depth analysis of the calculator market in Hong Kong SAR, China. Within it, you will discover the latest data on market trends and opportunities by country, consumption, production and price developments, as well as the global trade (imports and exports). The forecast exhibits the market prospects through 2030.
Product coverage:
- Prodcom 28231200 - Electronic calculators and pocket-size data recording, r eproducing and displaying machines with calculating functions
Country coverage:
- Hong Kong SAR
Data coverage:
- Market volume and value
- Per Capita consumption
- Forecast of the market dynamics in the medium term
- Trade (exports and imports) in Hong Kong SAR, China
- Export and import prices
- Market trends, drivers and restraints
- Key market players and their profiles
Reasons to buy this report:
- Take advantage of the latest data
- Find deeper insights into current market developments
- Discover vital success factors affecting the market
This report is designed for manufacturers, distributors, importers, and wholesalers, as well as for investors, consultants and advisors.
In this report, you can find information that helps you to make informed decisions on the following issues:
- How to diversify your business and benefit from new market opportunities
- How to load your idle production capacity
- How to boost your sales on overseas markets
- How to increase your profit margins
- How to make your supply chain more sustainable
- How to reduce your production and supply chain costs
- How to outsource production to other countries
- How to prepare your business for global expansion
While doing this research, we combine the accumulated expertise of our analysts and the capabilities of artificial intelligence. The AI-based platform, developed by our data scientists, constitutes the key working tool for business analysts, empowering them to discover deep insights and ideas from the marketing data.
-
1. INTRODUCTION
Making Data-Driven Decisions to Grow Your Business
- REPORT DESCRIPTION
- RESEARCH METHODOLOGY AND AI PLATFORM
- DATA-DRIVEN DECISIONS FOR YOUR BUSINESS
- GLOSSARY AND SPECIFIC TERMS
-
2. EXECUTIVE SUMMARY
A Quick Overview of Market Performance
- KEY FINDINGS
- MARKET TRENDS This Chapter is Available Only for the Professional Edition PRO
-
3. MARKET OVERVIEW
Understanding the Current State of The Market and Its Prospects
- MARKET SIZE
- MARKET STRUCTURE
- TRADE BALANCE
- PER CAPITA CONSUMPTION
- MARKET FORECAST TO 2030
-
4. MOST PROMISING PRODUCT
Finding New Products to Diversify Your Business
This Chapter is Available Only for the Professional Edition PRO- TOP PRODUCTS TO DIVERSIFY YOUR BUSINESS
- BEST-SELLING PRODUCTS
- MOST CONSUMED PRODUCT
- MOST TRADED PRODUCT
- MOST PROFITABLE PRODUCT FOR EXPORT
-
5. MOST PROMISING SUPPLYING COUNTRIES
Choosing the Best Countries to Establish Your Sustainable Supply Chain
This Chapter is Available Only for the Professional Edition PRO- TOP COUNTRIES TO SOURCE YOUR PRODUCT
- TOP PRODUCING COUNTRIES
- TOP EXPORTING COUNTRIES
- LOW-COST EXPORTING COUNTRIES
-
6. MOST PROMISING OVERSEAS MARKETS
Choosing the Best Countries to Boost Your Exports
This Chapter is Available Only for the Professional Edition PRO- TOP OVERSEAS MARKETS FOR EXPORTING YOUR PRODUCT
- TOP CONSUMING MARKETS
- UNSATURATED MARKETS
- TOP IMPORTING MARKETS
- MOST PROFITABLE MARKETS
7. PRODUCTION
The Latest Trends and Insights into The Industry
- PRODUCTION VOLUME AND VALUE
8. IMPORTS
The Largest Import Supplying Countries
- IMPORTS FROM 2012–2023
- IMPORTS BY COUNTRY
- IMPORT PRICES BY COUNTRY
9. EXPORTS
The Largest Destinations for Exports
- EXPORTS FROM 2012–2023
- EXPORTS BY COUNTRY
- EXPORT PRICES BY COUNTRY
-
10. PROFILES OF MAJOR PRODUCERS
The Largest Producers on The Market and Their Profiles
This Chapter is Available Only for the Professional Edition PRO -
LIST OF TABLES
- Key Findings In 2023
- Market Volume, In Physical Terms, 2012–2023
- Market Value, 2012–2023
- Per Capita Consumption In 2012-2023
- Imports, In Physical Terms, By Country, 2012–2023
- Imports, In Value Terms, By Country, 2012–2023
- Import Prices, By Country Of Origin, 2012–2023
- Exports, In Physical Terms, By Country, 2012–2023
- Exports, In Value Terms, By Country, 2012–2023
- Export Prices, By Country Of Destination, 2012–2023
-
LIST OF FIGURES
- Market Volume, In Physical Terms, 2012–2023
- Market Value, 2012–2023
- Market Structure – Domestic Supply vs. Imports, In Physical Terms, 2012-2023
- Market Structure – Domestic Supply vs. Imports, In Value Terms, 2012-2023
- Trade Balance, In Physical Terms, 2012-2023
- Trade Balance, In Value Terms, 2012-2023
- Per Capita Consumption, 2012-2023
- Market Volume Forecast to 2030
- Market Value Forecast to 2030
- Products: Market Size And Growth, By Type
- Products: Average Per Capita Consumption, By Type
- Products: Exports And Growth, By Type
- Products: Export Prices And Growth, By Type
- Production Volume And Growth
- Exports And Growth
- Export Prices And Growth
- Market Size And Growth
- Per Capita Consumption
- Imports And Growth
- Import Prices
- Production, In Physical Terms, 2012–2023
- Production, In Value Terms, 2012–2023
- Imports, In Physical Terms, 2012–2023
- Imports, In Value Terms, 2012–2023
- Imports, In Physical Terms, By Country, 2023
- Imports, In Physical Terms, By Country, 2012–2023
- Imports, In Value Terms, By Country, 2012–2023
- Import Prices, By Country Of Origin, 2012–2023
- Exports, In Physical Terms, 2012–2023
- Exports, In Value Terms, 2012–2023
- Exports, In Physical Terms, By Country, 2023
- Exports, In Physical Terms, By Country, 2012–2023
- Exports, In Value Terms, By Country, 2012–2023
- Export Prices, By Country Of Destination, 2012–2023


