
Germany - Cylindrical Roller Bearings - Market Analysis, Forecast, Size, Trends And Insights
Get instant access to more than 2 million reports, dashboards, and datasets on the IndexBox Platform.
View PricingGermany Sees a 2% Reduction in Price for Cylindrical Roller Bearings, Now Averaging $33.0 per Kg.
Germany Cylindrical Roller Bearing Export Price in June 2023
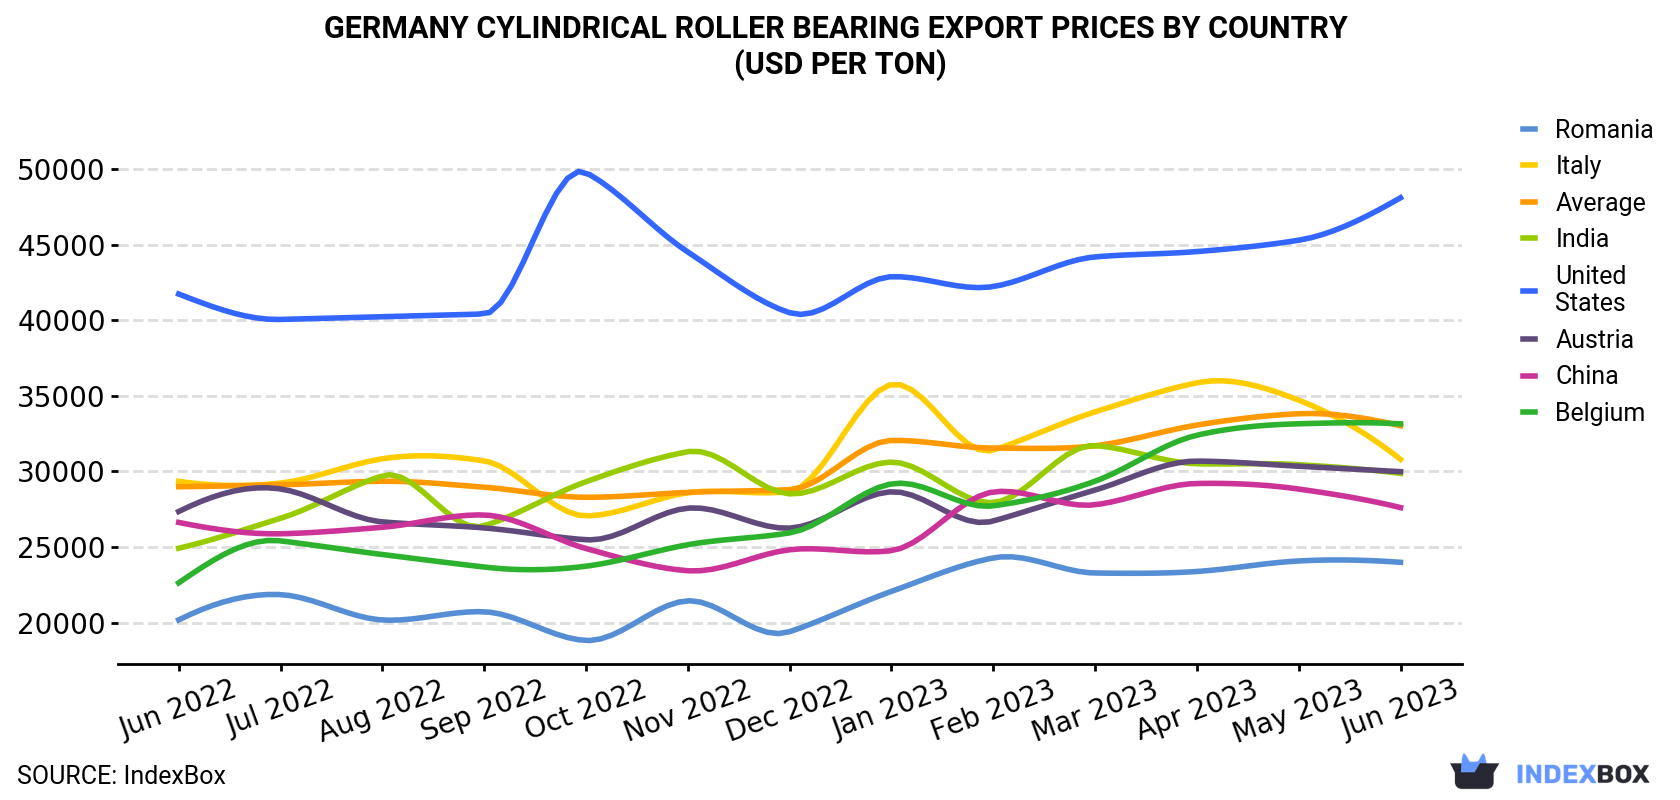
In June 2023, the cylindrical roller bearing price amounted to $33,018 per ton (FOB, Germany), shrinking by -2.3% against the previous month. Over the last twelve months, it increased at an average monthly rate of +1.1%. The pace of growth appeared the most rapid in January 2023 when the export price increased by 11% m-o-m. Over the period under review, the export prices attained the maximum at $33,812 per ton in May 2023, and then declined in the following month.
There were significant differences in the average prices amongst the major exporting countries. In June 2023, the country with the highest price was the United States ($48,088 per ton), while Romania ($23,991 per ton) was amongst the lowest.
From June 2022 to June 2023, the most notable rate of growth in terms of prices was attained by Belgium (+3.2%), while the other leaders experienced more modest paces of growth.
| COUNTRY | Export Price of Cylindrical Roller Bearing in Germany (USD per ton) | ||||||||||||
|---|---|---|---|---|---|---|---|---|---|---|---|---|---|
| Jun 2022 | Jul 2022 | Aug 2022 | Sep 2022 | Oct 2022 | Nov 2022 | Dec 2022 | Jan 2023 | Feb 2023 | Mar 2023 | Apr 2023 | May 2023 | Jun 2023 | |
| United States | 41,727 | 40,046 | 40,226 | 40,408 | 49,754 | 44,505 | 40,490 | 42,870 | 42,220 | 44,181 | 44,533 | 45,284 | 48,088 |
| Belgium | 22,631 | 25,409 | 24,507 | 23,679 | 23,733 | 25,153 | 25,936 | 29,175 | 27,724 | 29,351 | 32,393 | 33,148 | 33,144 |
| Italy | 29,343 | 29,229 | 30,836 | 30,697 | 27,061 | 28,586 | 28,679 | 35,744 | 31,407 | 33,937 | 35,855 | 34,711 | 30,797 |
| Austria | 27,348 | 28,842 | 26,663 | 26,264 | 25,481 | 27,572 | 26,250 | 28,654 | 26,719 | 28,769 | 30,681 | 30,343 | 29,983 |
| India | 24,921 | 26,900 | 29,711 | 26,402 | 29,317 | 31,302 | 28,516 | 30,615 | 27,936 | 31,708 | 30,507 | 30,446 | 29,870 |
| China | 26,627 | 25,878 | 26,307 | 27,119 | 24,901 | 23,434 | 24,821 | 24,761 | 28,643 | 27,795 | 29,202 | 28,833 | 27,608 |
| Romania | 20,183 | 21,856 | 20,177 | 20,722 | 18,821 | 21,447 | 19,403 | 22,069 | 24,282 | 23,283 | 23,384 | 24,080 | 23,991 |
| Average | 28,987 | 29,116 | 29,349 | 28,956 | 28,291 | 28,614 | 28,793 | 32,046 | 31,543 | 31,695 | 33,063 | 33,812 | 33,018 |
Germany Cylindrical Roller Bearing Exports
In June 2023, the amount of cylindrical roller bearings exported from Germany totaled 2.9K tons, surging by 6.8% compared with the previous month's figure. The total export volume increased at an average monthly rate of +1.1% over the period from June 2022 to June 2023; the trend pattern remained consistent, with somewhat noticeable fluctuations being recorded throughout the analyzed period. The growth pace was the most rapid in May 2023 with an increase of 11% m-o-m.
In value terms, cylindrical roller bearing exports rose to $97M (IndexBox estimates) in June 2023. The total export value increased at an average monthly rate of +2.2% from June 2022 to June 2023; the trend pattern indicated some noticeable fluctuations being recorded throughout the analyzed period. The growth pace was the most rapid in May 2023 with an increase of 14% month-to-month. Over the period under review, the exports attained the peak figure in June 2023.
Germany Cylindrical Roller Bearing Exports by Country
In June 2023, China (706 tons), followed by the United States (240 tons), Italy (214 tons) and Belgium (187 tons) were the major exporters of cylindrical roller bearings, together comprising 11% of total exports. The following exporters - Austria (132 tons), Spain (124 tons), Romania (120 tons), India (106 tons), the Czech Republic (102 tons), France (81 tons), Sweden (77 tons), Turkey (76 tons) and Poland (73 tons) - each accounted for a 7.4% share of total exports.
Exports from China increased at an average monthly rate of +2.7% from June 2022 to June 2023. At the same time, the Czech Republic (+4.7%), Poland (+4.6%), Turkey (+1.5%), Italy (+1.2%), Belgium (+1.1%), the United States (+1.1%) and Austria (+1.0%) displayed positive paces of growth. Moreover, the Czech Republic emerged as the fastest-growing exporter exported in the world, with a CAGR of +4.7% from June 2022-June 2023. Spain, Sweden, France, Romania and India experienced a relatively flat trend pattern. The shares of the largest exporters remained relatively stable throughout the analyzed period.
In value terms, China ($19M), the United States ($12M) and Italy ($6.6M) appeared to be the countries with the highest levels of exports in June 2023, with a combined 12% share of total exports. Belgium, Austria, France, India, Spain, Romania, Sweden, Poland, Turkey and the Czech Republic lagged somewhat behind, together accounting for a further 10%.
Among the main exporting countries, Belgium, with a CAGR of +4.4%, saw the highest rates of growth with regard to the value of exports, over the period under review, while shipments for the other leaders experienced more modest paces of growth.
This report provides an in-depth analysis of the cylindrical roller bearing market in Germany. Within it, you will discover the latest data on market trends and opportunities by country, consumption, production and price developments, as well as the global trade (imports and exports). The forecast exhibits the market prospects through 2030.
Product coverage:
- Prodcom 28151057 - Cylindrical roller bearings (excluding roller bearings, needle roller bearings)
Country coverage:
- Germany
Data coverage:
- Market volume and value
- Per Capita consumption
- Forecast of the market dynamics in the medium term
- Trade (exports and imports) in Germany
- Export and import prices
- Market trends, drivers and restraints
- Key market players and their profiles
Reasons to buy this report:
- Take advantage of the latest data
- Find deeper insights into current market developments
- Discover vital success factors affecting the market
This report is designed for manufacturers, distributors, importers, and wholesalers, as well as for investors, consultants and advisors.
In this report, you can find information that helps you to make informed decisions on the following issues:
- How to diversify your business and benefit from new market opportunities
- How to load your idle production capacity
- How to boost your sales on overseas markets
- How to increase your profit margins
- How to make your supply chain more sustainable
- How to reduce your production and supply chain costs
- How to outsource production to other countries
- How to prepare your business for global expansion
While doing this research, we combine the accumulated expertise of our analysts and the capabilities of artificial intelligence. The AI-based platform, developed by our data scientists, constitutes the key working tool for business analysts, empowering them to discover deep insights and ideas from the marketing data.
-
1. INTRODUCTION
Making Data-Driven Decisions to Grow Your Business
- REPORT DESCRIPTION
- RESEARCH METHODOLOGY AND AI PLATFORM
- DATA-DRIVEN DECISIONS FOR YOUR BUSINESS
- GLOSSARY AND SPECIFIC TERMS
-
2. EXECUTIVE SUMMARY
A Quick Overview of Market Performance
- KEY FINDINGS
- MARKET TRENDS This Chapter is Available Only for the Professional Edition PRO
-
3. MARKET OVERVIEW
Understanding the Current State of The Market and Its Prospects
- MARKET SIZE
- MARKET STRUCTURE
- TRADE BALANCE
- PER CAPITA CONSUMPTION
- MARKET FORECAST TO 2030
-
4. MOST PROMISING PRODUCT
Finding New Products to Diversify Your Business
This Chapter is Available Only for the Professional Edition PRO- TOP PRODUCTS TO DIVERSIFY YOUR BUSINESS
- BEST-SELLING PRODUCTS
- MOST CONSUMED PRODUCT
- MOST TRADED PRODUCT
- MOST PROFITABLE PRODUCT FOR EXPORT
-
5. MOST PROMISING SUPPLYING COUNTRIES
Choosing the Best Countries to Establish Your Sustainable Supply Chain
This Chapter is Available Only for the Professional Edition PRO- TOP COUNTRIES TO SOURCE YOUR PRODUCT
- TOP PRODUCING COUNTRIES
- TOP EXPORTING COUNTRIES
- LOW-COST EXPORTING COUNTRIES
-
6. MOST PROMISING OVERSEAS MARKETS
Choosing the Best Countries to Boost Your Exports
This Chapter is Available Only for the Professional Edition PRO- TOP OVERSEAS MARKETS FOR EXPORTING YOUR PRODUCT
- TOP CONSUMING MARKETS
- UNSATURATED MARKETS
- TOP IMPORTING MARKETS
- MOST PROFITABLE MARKETS
7. PRODUCTION
The Latest Trends and Insights into The Industry
- PRODUCTION VOLUME AND VALUE
8. IMPORTS
The Largest Import Supplying Countries
- IMPORTS FROM 2012–2023
- IMPORTS BY COUNTRY
- IMPORT PRICES BY COUNTRY
9. EXPORTS
The Largest Destinations for Exports
- EXPORTS FROM 2012–2023
- EXPORTS BY COUNTRY
- EXPORT PRICES BY COUNTRY
-
10. PROFILES OF MAJOR PRODUCERS
The Largest Producers on The Market and Their Profiles
This Chapter is Available Only for the Professional Edition PRO -
LIST OF TABLES
- Key Findings In 2023
- Market Volume, In Physical Terms, 2012–2023
- Market Value, 2012–2023
- Per Capita Consumption In 2012-2023
- Imports, In Physical Terms, By Country, 2012–2023
- Imports, In Value Terms, By Country, 2012–2023
- Import Prices, By Country Of Origin, 2012–2023
- Exports, In Physical Terms, By Country, 2012–2023
- Exports, In Value Terms, By Country, 2012–2023
- Export Prices, By Country Of Destination, 2012–2023
-
LIST OF FIGURES
- Market Volume, In Physical Terms, 2012–2023
- Market Value, 2012–2023
- Market Structure – Domestic Supply vs. Imports, In Physical Terms, 2012-2023
- Market Structure – Domestic Supply vs. Imports, In Value Terms, 2012-2023
- Trade Balance, In Physical Terms, 2012-2023
- Trade Balance, In Value Terms, 2012-2023
- Per Capita Consumption, 2012-2023
- Market Volume Forecast to 2030
- Market Value Forecast to 2030
- Products: Market Size And Growth, By Type
- Products: Average Per Capita Consumption, By Type
- Products: Exports And Growth, By Type
- Products: Export Prices And Growth, By Type
- Production Volume And Growth
- Exports And Growth
- Export Prices And Growth
- Market Size And Growth
- Per Capita Consumption
- Imports And Growth
- Import Prices
- Production, In Physical Terms, 2012–2023
- Production, In Value Terms, 2012–2023
- Imports, In Physical Terms, 2012–2023
- Imports, In Value Terms, 2012–2023
- Imports, In Physical Terms, By Country, 2023
- Imports, In Physical Terms, By Country, 2012–2023
- Imports, In Value Terms, By Country, 2012–2023
- Import Prices, By Country Of Origin, 2012–2023
- Exports, In Physical Terms, 2012–2023
- Exports, In Value Terms, 2012–2023
- Exports, In Physical Terms, By Country, 2023
- Exports, In Physical Terms, By Country, 2012–2023
- Exports, In Value Terms, By Country, 2012–2023
- Export Prices, By Country Of Destination, 2012–2023


