
France - Tyres - Market Analysis, Forecast, Size, Trends and Insights
Get instant access to more than 2 million reports, dashboards, and datasets on the IndexBox Platform.
View PricingAugust 2023 Sees a Decline in Frances' Tire Imports, Totaling $366M.
France Tyre Imports
In August 2023, overseas purchases of tyres decreased by -9.5% to 3.8M units, falling for the second month in a row after two months of growth. Overall, imports continue to indicate a mild curtailment. The most prominent rate of growth was recorded in January 2023 when imports increased by 8.9% against the previous month. Imports peaked at 5.2M units in October 2022; however, from November 2022 to August 2023, imports stood at a somewhat lower figure.
In value terms, tyre imports reduced slightly to $366M (IndexBox estimates) in August 2023. Over the period under review, imports, however, continue to indicate a relatively flat trend pattern. The pace of growth appeared the most rapid in January 2023 when imports increased by 20% m-o-m. Over the period under review, imports reached the peak figure at 423M units in June 2023; however, from July 2023 to August 2023, imports remained at a lower figure.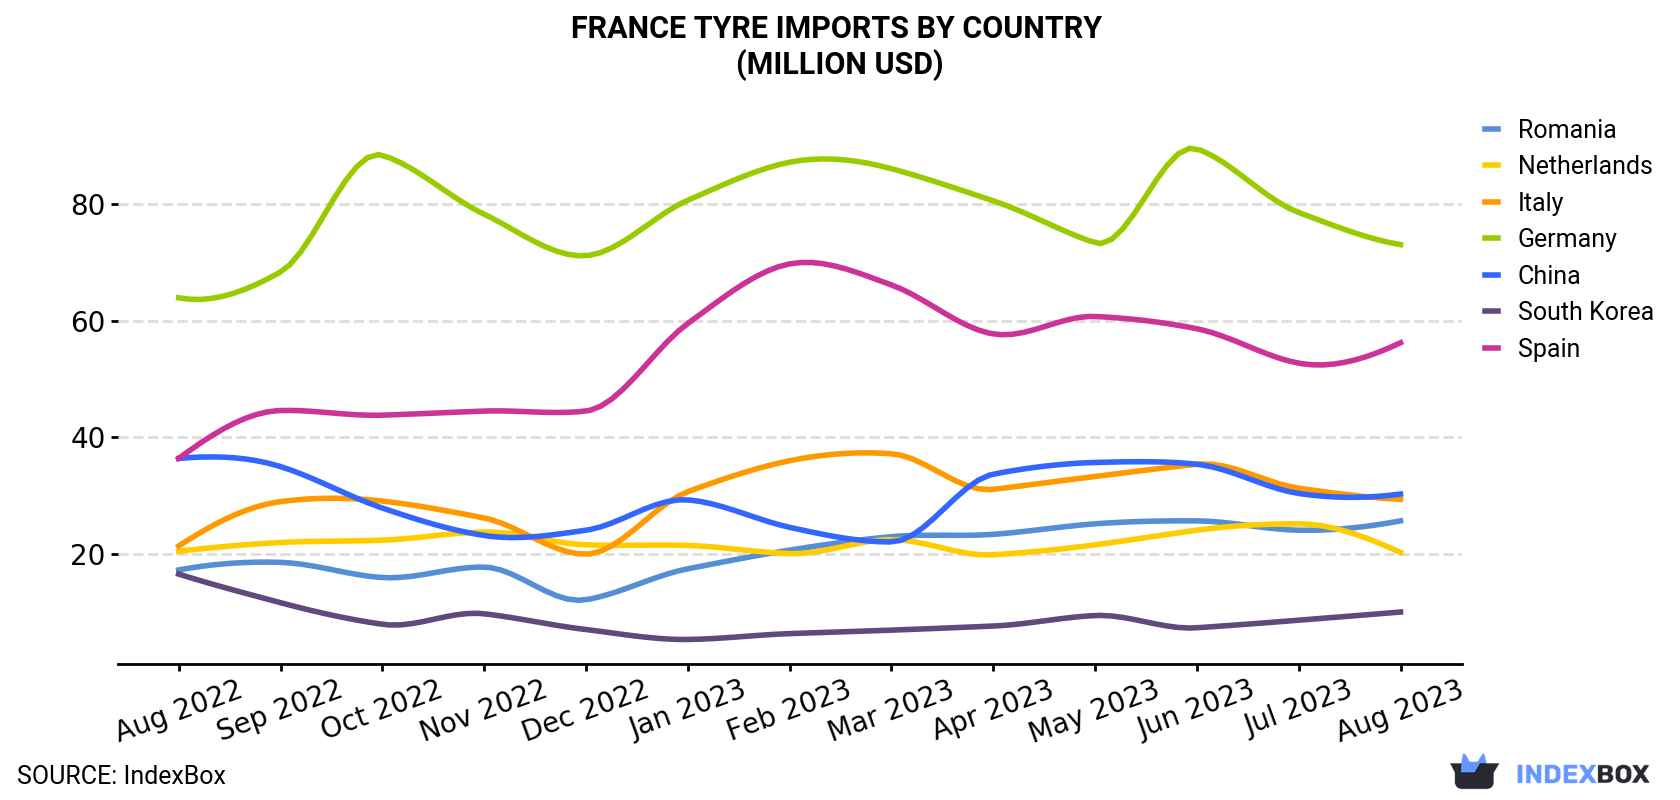
| COUNTRY | Import Value of Tyre in France (million USD) | ||||||||||||
|---|---|---|---|---|---|---|---|---|---|---|---|---|---|
| Aug 2022 | Sep 2022 | Oct 2022 | Nov 2022 | Dec 2022 | Jan 2023 | Feb 2023 | Mar 2023 | Apr 2023 | May 2023 | Jun 2023 | Jul 2023 | Aug 2023 | |
| Germany | 63.9 | 68.3 | 88.3 | 78.2 | 71.1 | 80.6 | 87.1 | 86.0 | 80.5 | 73.3 | 89.4 | 78.5 | 73.0 |
| Spain | 36.4 | 44.6 | 43.8 | 44.5 | 44.5 | 59.5 | 69.7 | 66.1 | 57.7 | 60.7 | 58.6 | 52.7 | 56.2 |
| China | 36.4 | 35.0 | 27.9 | 23.2 | 24.1 | 29.3 | 24.6 | 22.1 | 33.7 | 35.7 | 35.4 | 30.4 | 30.3 |
| Italy | 21.4 | 29.0 | 29.1 | 26.2 | 20.0 | 30.7 | 36.0 | 37.2 | 31.1 | 33.3 | 35.4 | 31.3 | 29.4 |
| Romania | 17.3 | 18.6 | 16.0 | 17.8 | 12.2 | 17.5 | 20.7 | 23.0 | 23.4 | 25.2 | 25.7 | 24.1 | 25.7 |
| Netherlands | 20.5 | 22.0 | 22.4 | 23.8 | 21.6 | 21.5 | 20.1 | 22.5 | 19.9 | 21.6 | 24.1 | 25.2 | 20.3 |
| South Korea | 16.6 | 11.7 | 8.0 | 9.8 | 7.1 | 5.4 | 6.4 | 7.0 | 7.7 | 9.5 | 7.4 | 8.7 | 10.1 |
| Others | 125 | 139 | 143 | 140 | 117 | 135 | 131 | 146 | 149 | 152 | 147 | 129 | 121 |
| Total | 337 | 368 | 378 | 363 | 317 | 380 | 395 | 410 | 403 | 411 | 423 | 380 | 366 |
Imports by Country
China (724K units), Germany (712K units) and Spain (465K units) were the main suppliers of tyre imports to France, with a combined 50% share of total imports. Romania, Italy, the Netherlands and South Korea lagged somewhat behind, together accounting for a further 22%.
From August 2022 to August 2023, the most notable rate of growth in terms of purchases, amongst the main suppliers, was attained by Romania (with a CAGR of +2.1%), while imports for the other leaders experienced a decline.
In value terms, Germany ($73M), Spain ($56M) and China ($30M) constituted the largest tyre suppliers to France, with a combined 44% share of total imports.
In terms of the main suppliers, Spain, with a CAGR of +3.7%, recorded the highest rates of growth with regard to the value of imports, over the period under review, while purchases for the other leaders experienced more modest paces of growth.
Imports by Type
In August 2023, tyres for motor cars (3.1M units) constituted the largest type of tyre supplied to France, accounting for a 80% share of total imports. Moreover, tyres for motor cars exceeded the figures recorded for the second-largest type, tyres for buses or lorries (354K units), ninefold. Tyres for motorcycles or bicycles (295K units) ranked third in terms of total imports with a 7.7% share.
From August 2022 to August 2023, the average monthly rate of growth in terms of the volume of import of tyres for motor cars was relatively modest. With regard to the other supplied products, the following average monthly rates of growth were recorded: tyres for buses or lorries (-0.6% per month) and tyres for motorcycles or bicycles (-7.1% per month).
In value terms, tyres for motor cars ($229M) constituted the largest type of tyre supplied to France, comprising 63% of total imports. The second position in the ranking was held by tyres for buses or lorries ($80M), with a 22% share of total imports. It was followed by tyres for agriculture, forestry, construction, industry and other off the road vehicles, with an 11% share.
Import Prices by Country
In August 2023, the tyre price amounted to $95.6 per unit (CIF, France), picking up by 6.4% against the previous month. Over the period from August 2022 to August 2023, it increased at an average monthly rate of +2.4%. The most prominent rate of growth was recorded in January 2023 when the average import price increased by 9.9% against the previous month. Over the period under review, average import prices hit record highs in August 2023.
Prices varied noticeably by the country of origin: the country with the highest price was Slovakia ($143 per unit), while the price for China ($41.9 per unit) was amongst the lowest.
From August 2022 to August 2023, the most notable rate of growth in terms of prices was attained by Spain (+5.2%), while the prices for the other major suppliers experienced more modest paces of growth.
This report provides an in-depth analysis of the tyre market in France. Within it, you will discover the latest data on market trends and opportunities by country, consumption, production and price developments, as well as the global trade (imports and exports). The forecast exhibits the market prospects through 2030.
Product coverage:
- Prodcom 22111100 - New pneumatic rubber tyres for motor cars (including for racing cars)
- Prodcom 22111355 - New pneumatic rubber tyres for buses or lorries with a load index . .121
- Prodcom 22111357 - New pneumatic rubber tyres for buses or lorries with a load index > .121
- Prodcom 22111370 - New pneumatic rubber tyres for aircraft
- Prodcom 22111200 - New pneumatic tyres, of rubber, of a kind used on motorcycles or bicycles
- Prodcom 22111400 - Agrarian tyres, other new pneumatic tyres, of rubber
Country coverage:
- France
Data coverage:
- Market volume and value
- Per Capita consumption
- Forecast of the market dynamics in the medium term
- Trade (exports and imports) in France
- Export and import prices
- Market trends, drivers and restraints
- Key market players and their profiles
Reasons to buy this report:
- Take advantage of the latest data
- Find deeper insights into current market developments
- Discover vital success factors affecting the market
This report is designed for manufacturers, distributors, importers, and wholesalers, as well as for investors, consultants and advisors.
In this report, you can find information that helps you to make informed decisions on the following issues:
- How to diversify your business and benefit from new market opportunities
- How to load your idle production capacity
- How to boost your sales on overseas markets
- How to increase your profit margins
- How to make your supply chain more sustainable
- How to reduce your production and supply chain costs
- How to outsource production to other countries
- How to prepare your business for global expansion
While doing this research, we combine the accumulated expertise of our analysts and the capabilities of artificial intelligence. The AI-based platform, developed by our data scientists, constitutes the key working tool for business analysts, empowering them to discover deep insights and ideas from the marketing data.
-
1. INTRODUCTION
Making Data-Driven Decisions to Grow Your Business
- REPORT DESCRIPTION
- RESEARCH METHODOLOGY AND AI PLATFORM
- DATA-DRIVEN DECISIONS FOR YOUR BUSINESS
- GLOSSARY AND SPECIFIC TERMS
-
2. EXECUTIVE SUMMARY
A Quick Overview of Market Performance
- KEY FINDINGS
- MARKET TRENDS This Chapter is Available Only for the Professional Edition PRO
-
3. MARKET OVERVIEW
Understanding the Current State of The Market and Its Prospects
- MARKET SIZE
- MARKET STRUCTURE
- TRADE BALANCE
- PER CAPITA CONSUMPTION
- MARKET FORECAST TO 2030
-
4. MOST PROMISING PRODUCT
Finding New Products to Diversify Your Business
This Chapter is Available Only for the Professional Edition PRO- TOP PRODUCTS TO DIVERSIFY YOUR BUSINESS
- BEST-SELLING PRODUCTS
- MOST CONSUMED PRODUCT
- MOST TRADED PRODUCT
- MOST PROFITABLE PRODUCT FOR EXPORT
-
5. MOST PROMISING SUPPLYING COUNTRIES
Choosing the Best Countries to Establish Your Sustainable Supply Chain
This Chapter is Available Only for the Professional Edition PRO- TOP COUNTRIES TO SOURCE YOUR PRODUCT
- TOP PRODUCING COUNTRIES
- TOP EXPORTING COUNTRIES
- LOW-COST EXPORTING COUNTRIES
-
6. MOST PROMISING OVERSEAS MARKETS
Choosing the Best Countries to Boost Your Exports
This Chapter is Available Only for the Professional Edition PRO- TOP OVERSEAS MARKETS FOR EXPORTING YOUR PRODUCT
- TOP CONSUMING MARKETS
- UNSATURATED MARKETS
- TOP IMPORTING MARKETS
- MOST PROFITABLE MARKETS
7. PRODUCTION
The Latest Trends and Insights into The Industry
- PRODUCTION VOLUME AND VALUE
8. IMPORTS
The Largest Import Supplying Countries
- IMPORTS FROM 2012–2023
- IMPORTS BY COUNTRY
- IMPORT PRICES BY COUNTRY
9. EXPORTS
The Largest Destinations for Exports
- EXPORTS FROM 2012–2023
- EXPORTS BY COUNTRY
- EXPORT PRICES BY COUNTRY
-
10. PROFILES OF MAJOR PRODUCERS
The Largest Producers on The Market and Their Profiles
This Chapter is Available Only for the Professional Edition PRO -
LIST OF TABLES
- Key Findings In 2023
- Market Volume, In Physical Terms, 2012–2023
- Market Value, 2012–2023
- Per Capita Consumption In 2012-2023
- Imports, In Physical Terms, By Country, 2012–2023
- Imports, In Value Terms, By Country, 2012–2023
- Import Prices, By Country Of Origin, 2012–2023
- Exports, In Physical Terms, By Country, 2012–2023
- Exports, In Value Terms, By Country, 2012–2023
- Export Prices, By Country Of Destination, 2012–2023
-
LIST OF FIGURES
- Market Volume, In Physical Terms, 2012–2023
- Market Value, 2012–2023
- Market Structure – Domestic Supply vs. Imports, In Physical Terms, 2012-2023
- Market Structure – Domestic Supply vs. Imports, In Value Terms, 2012-2023
- Trade Balance, In Physical Terms, 2012-2023
- Trade Balance, In Value Terms, 2012-2023
- Per Capita Consumption, 2012-2023
- Market Volume Forecast to 2030
- Market Value Forecast to 2030
- Products: Market Size And Growth, By Type
- Products: Average Per Capita Consumption, By Type
- Products: Exports And Growth, By Type
- Products: Export Prices And Growth, By Type
- Production Volume And Growth
- Exports And Growth
- Export Prices And Growth
- Market Size And Growth
- Per Capita Consumption
- Imports And Growth
- Import Prices
- Production, In Physical Terms, 2012–2023
- Production, In Value Terms, 2012–2023
- Imports, In Physical Terms, 2012–2023
- Imports, In Value Terms, 2012–2023
- Imports, In Physical Terms, By Country, 2023
- Imports, In Physical Terms, By Country, 2012–2023
- Imports, In Value Terms, By Country, 2012–2023
- Import Prices, By Country Of Origin, 2012–2023
- Exports, In Physical Terms, 2012–2023
- Exports, In Value Terms, 2012–2023
- Exports, In Physical Terms, By Country, 2023
- Exports, In Physical Terms, By Country, 2012–2023
- Exports, In Value Terms, By Country, 2012–2023
- Export Prices, By Country Of Destination, 2012–2023


