
France - Frames And Mountings For Spectacles, Goggles Or The Like - Market Analysis, Forecast, Size, Trends and Insights
Get instant access to more than 2 million reports, dashboards, and datasets on the IndexBox Platform.
View PricingFrance's Eyewear Import Soars by 59% to $42M in September 2023
France Spectacle Frame Imports
After three months of decline, purchases abroad of frames and mountings for spectacles, goggles or the like increased by 30% to 625K units in September 2023. Over the period under review, imports saw a relatively flat trend pattern. Imports peaked at 758K units in January 2023; however, from February 2023 to September 2023, imports stood at a somewhat lower figure.
In value terms, spectacle frame imports skyrocketed to $42M (IndexBox estimates) in September 2023. The total import value increased at an average monthly rate of +1.0% from September 2022 to September 2023; however, the trend pattern indicated some noticeable fluctuations being recorded in certain months. Imports peaked at 44M units in January 2023; however, from February 2023 to September 2023, imports remained at a lower figure.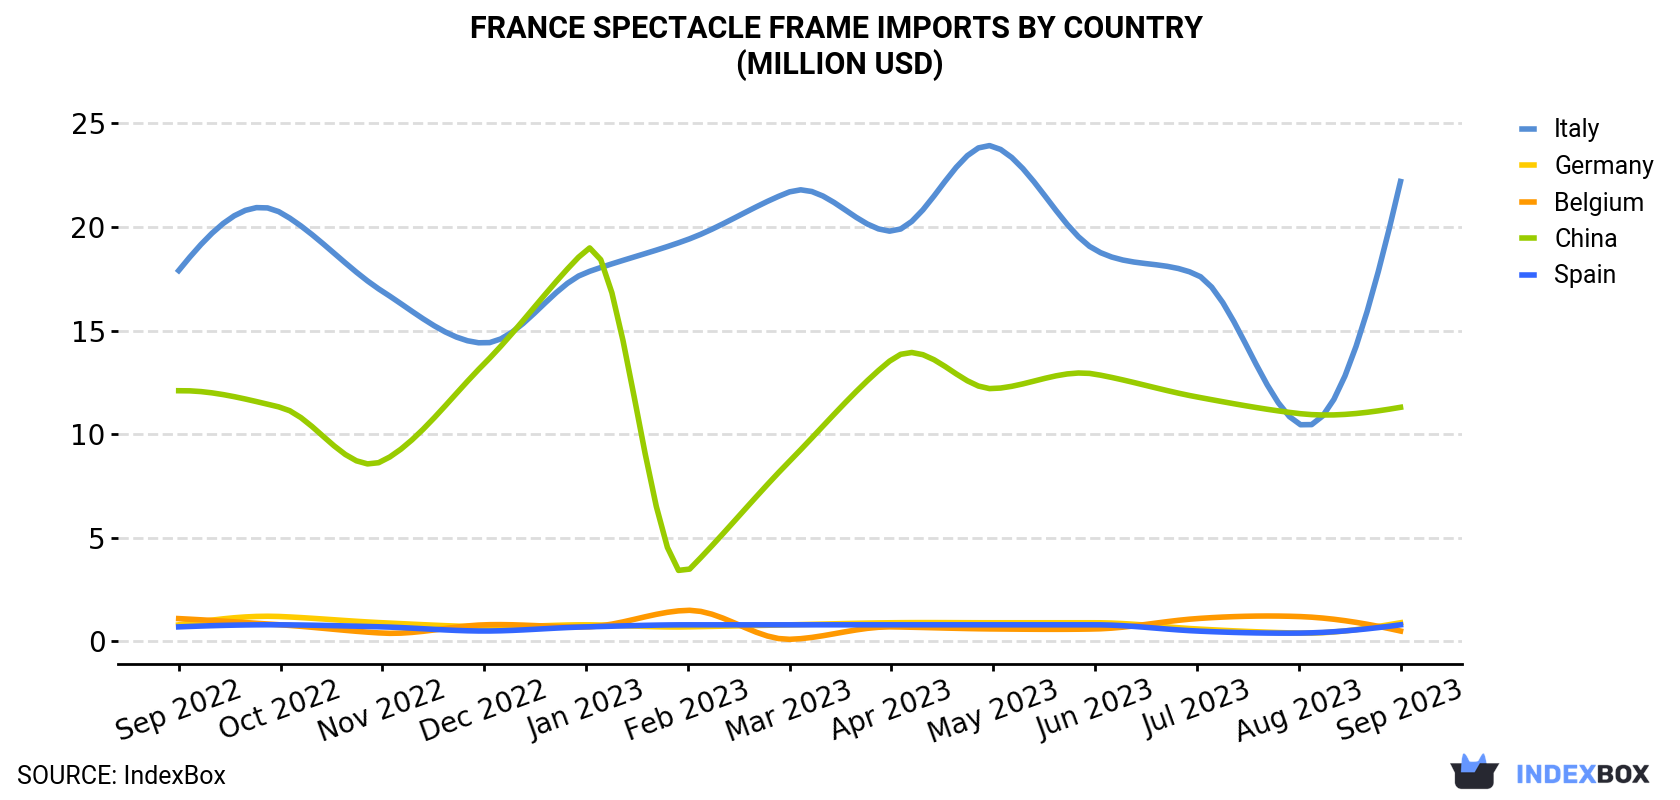
| COUNTRY | Import Value of Spectacle Frame in France (million USD) | ||||||||||||
|---|---|---|---|---|---|---|---|---|---|---|---|---|---|
| Sep 2022 | Oct 2022 | Nov 2022 | Dec 2022 | Jan 2023 | Feb 2023 | Mar 2023 | Apr 2023 | May 2023 | Jun 2023 | Jul 2023 | Aug 2023 | Sep 2023 | |
| Italy | 17.9 | 20.7 | 16.9 | 14.4 | 17.8 | 19.4 | 21.7 | 19.8 | 23.9 | 18.9 | 17.7 | 10.5 | 22.2 |
| China | 12.1 | 11.3 | 8.7 | 13.4 | 18.9 | 3.4 | 8.7 | 13.6 | 12.2 | 12.9 | 11.8 | 11.0 | 11.3 |
| Germany | 0.8 | 1.2 | 0.9 | 0.7 | 0.8 | 0.7 | 0.8 | 0.9 | 0.9 | 0.9 | 0.6 | 0.4 | 0.9 |
| Spain | 0.7 | 0.8 | 0.7 | 0.5 | 0.7 | 0.8 | 0.8 | 0.8 | 0.8 | 0.8 | 0.5 | 0.4 | 0.8 |
| Belgium | 1.1 | 0.8 | 0.4 | 0.8 | 0.7 | 1.5 | 0.1 | 0.7 | 0.6 | 0.6 | 1.1 | 1.2 | 0.5 |
| Others | 4.9 | 5.0 | 6.0 | 7.2 | 5.2 | 4.2 | 5.6 | 7.5 | 5.3 | 5.7 | 4.7 | 3.2 | 6.7 |
| Total | 37.4 | 39.8 | 33.5 | 37.0 | 44.2 | 30.0 | 37.8 | 43.3 | 43.7 | 39.7 | 36.3 | 26.7 | 42.4 |
Imports by Country
Italy (315K units), China (221K units) and Spain (17K units) were the main suppliers of spectacle frame imports to France, together accounting for 88% of total imports. Germany and Belgium lagged somewhat behind, together accounting for a further 5.1%.
From September 2022 to September 2023, the most notable rate of growth in terms of purchases, amongst the main suppliers, was attained by Germany (with a CAGR of +3.3%), while imports for the other leaders experienced more modest paces of growth.
In value terms, Italy ($22M), China ($11M) and Germany ($876K) appeared to be the largest spectacle frame suppliers to France, together comprising 81% of total imports.
Among the main suppliers, Italy, with a CAGR of +1.8%, recorded the highest rates of growth with regard to the value of imports, over the period under review, while purchases for the other leaders experienced more modest paces of growth.
Imports by Type
Plastic frames and mountings for spectacles and goggles (367K units) and non-plastic frames and mountings for spectacles and goggles (258K units) were the main products of spectacle frame imports to France.
From September 2022 to September 2023, the biggest increases were in spectacle plastic frame (with a CAGR of +0.4%).
In value terms, the most traded types of frames and mountings for spectacles, goggles or the like in France were plastic frames and mountings for spectacles and goggles ($24M) and non-plastic frames and mountings for spectacles and goggles ($19M).
Import Prices by Country
In September 2023, the spectacle frame price stood at $67.8 per unit (CIF, France), surging by 22% against the previous month. In general, the import price showed a relatively flat trend pattern. Over the period under review, average import prices hit record highs at $67.9 per unit in July 2023; however, from August 2023 to September 2023, import prices failed to regain momentum.
There were significant differences in the average prices amongst the major supplying countries. In September 2023, the country with the highest price was the Netherlands ($229 per unit), while the price for Belgium ($30.7 per unit) was amongst the lowest.
From September 2022 to September 2023, the most notable rate of growth in terms of prices was attained by Belgium (+1.7%), while the prices for the other major suppliers experienced more modest paces of growth.
This report provides an in-depth analysis of the spectacle frame market in France. Within it, you will discover the latest data on market trends and opportunities by country, consumption, production and price developments, as well as the global trade (imports and exports). The forecast exhibits the market prospects through 2030.
Product coverage:
- Prodcom 32504350 - Plastic frames and mountings for spectacles, goggles or the like
- Prodcom 32504390 - Non-plastic frames and mountings for spectacles, goggles and the like
Country coverage:
- France
Data coverage:
- Market volume and value
- Per Capita consumption
- Forecast of the market dynamics in the medium term
- Trade (exports and imports) in France
- Export and import prices
- Market trends, drivers and restraints
- Key market players and their profiles
Reasons to buy this report:
- Take advantage of the latest data
- Find deeper insights into current market developments
- Discover vital success factors affecting the market
This report is designed for manufacturers, distributors, importers, and wholesalers, as well as for investors, consultants and advisors.
In this report, you can find information that helps you to make informed decisions on the following issues:
- How to diversify your business and benefit from new market opportunities
- How to load your idle production capacity
- How to boost your sales on overseas markets
- How to increase your profit margins
- How to make your supply chain more sustainable
- How to reduce your production and supply chain costs
- How to outsource production to other countries
- How to prepare your business for global expansion
While doing this research, we combine the accumulated expertise of our analysts and the capabilities of artificial intelligence. The AI-based platform, developed by our data scientists, constitutes the key working tool for business analysts, empowering them to discover deep insights and ideas from the marketing data.
-
1. INTRODUCTION
Making Data-Driven Decisions to Grow Your Business
- REPORT DESCRIPTION
- RESEARCH METHODOLOGY AND AI PLATFORM
- DATA-DRIVEN DECISIONS FOR YOUR BUSINESS
- GLOSSARY AND SPECIFIC TERMS
-
2. EXECUTIVE SUMMARY
A Quick Overview of Market Performance
- KEY FINDINGS
- MARKET TRENDS This Chapter is Available Only for the Professional Edition PRO
-
3. MARKET OVERVIEW
Understanding the Current State of The Market and Its Prospects
- MARKET SIZE
- MARKET STRUCTURE
- TRADE BALANCE
- PER CAPITA CONSUMPTION
- MARKET FORECAST TO 2030
-
4. MOST PROMISING PRODUCT
Finding New Products to Diversify Your Business
This Chapter is Available Only for the Professional Edition PRO- TOP PRODUCTS TO DIVERSIFY YOUR BUSINESS
- BEST-SELLING PRODUCTS
- MOST CONSUMED PRODUCT
- MOST TRADED PRODUCT
- MOST PROFITABLE PRODUCT FOR EXPORT
-
5. MOST PROMISING SUPPLYING COUNTRIES
Choosing the Best Countries to Establish Your Sustainable Supply Chain
This Chapter is Available Only for the Professional Edition PRO- TOP COUNTRIES TO SOURCE YOUR PRODUCT
- TOP PRODUCING COUNTRIES
- TOP EXPORTING COUNTRIES
- LOW-COST EXPORTING COUNTRIES
-
6. MOST PROMISING OVERSEAS MARKETS
Choosing the Best Countries to Boost Your Exports
This Chapter is Available Only for the Professional Edition PRO- TOP OVERSEAS MARKETS FOR EXPORTING YOUR PRODUCT
- TOP CONSUMING MARKETS
- UNSATURATED MARKETS
- TOP IMPORTING MARKETS
- MOST PROFITABLE MARKETS
7. PRODUCTION
The Latest Trends and Insights into The Industry
- PRODUCTION VOLUME AND VALUE
8. IMPORTS
The Largest Import Supplying Countries
- IMPORTS FROM 2012–2023
- IMPORTS BY COUNTRY
- IMPORT PRICES BY COUNTRY
9. EXPORTS
The Largest Destinations for Exports
- EXPORTS FROM 2012–2023
- EXPORTS BY COUNTRY
- EXPORT PRICES BY COUNTRY
-
10. PROFILES OF MAJOR PRODUCERS
The Largest Producers on The Market and Their Profiles
This Chapter is Available Only for the Professional Edition PRO -
LIST OF TABLES
- Key Findings In 2023
- Market Volume, In Physical Terms, 2012–2023
- Market Value, 2012–2023
- Per Capita Consumption In 2012-2023
- Imports, In Physical Terms, By Country, 2012–2023
- Imports, In Value Terms, By Country, 2012–2023
- Import Prices, By Country Of Origin, 2012–2023
- Exports, In Physical Terms, By Country, 2012–2023
- Exports, In Value Terms, By Country, 2012–2023
- Export Prices, By Country Of Destination, 2012–2023
-
LIST OF FIGURES
- Market Volume, In Physical Terms, 2012–2023
- Market Value, 2012–2023
- Market Structure – Domestic Supply vs. Imports, In Physical Terms, 2012-2023
- Market Structure – Domestic Supply vs. Imports, In Value Terms, 2012-2023
- Trade Balance, In Physical Terms, 2012-2023
- Trade Balance, In Value Terms, 2012-2023
- Per Capita Consumption, 2012-2023
- Market Volume Forecast to 2030
- Market Value Forecast to 2030
- Products: Market Size And Growth, By Type
- Products: Average Per Capita Consumption, By Type
- Products: Exports And Growth, By Type
- Products: Export Prices And Growth, By Type
- Production Volume And Growth
- Exports And Growth
- Export Prices And Growth
- Market Size And Growth
- Per Capita Consumption
- Imports And Growth
- Import Prices
- Production, In Physical Terms, 2012–2023
- Production, In Value Terms, 2012–2023
- Imports, In Physical Terms, 2012–2023
- Imports, In Value Terms, 2012–2023
- Imports, In Physical Terms, By Country, 2023
- Imports, In Physical Terms, By Country, 2012–2023
- Imports, In Value Terms, By Country, 2012–2023
- Import Prices, By Country Of Origin, 2012–2023
- Exports, In Physical Terms, 2012–2023
- Exports, In Value Terms, 2012–2023
- Exports, In Physical Terms, By Country, 2023
- Exports, In Physical Terms, By Country, 2012–2023
- Exports, In Value Terms, By Country, 2012–2023
- Export Prices, By Country Of Destination, 2012–2023


