China - Tanks, Casks, Drums, Cans, Boxes And Similar Containers - Market Analysis, Forecast, Size, Trends and Insights
Get instant access to more than 2 million reports, dashboards, and datasets on the IndexBox Platform.
View PricingChina's September 2023 Export of Containers Plummets by 10% to $138M
China Container Exports
In September 2023, overseas shipments of tanks, casks, drums, cans, boxes and similar containers decreased by -8.9% to 557M units for the first time since February 2023, thus ending a six-month rising trend. Over the period under review, exports, however, showed a relatively flat trend pattern. The pace of growth appeared the most rapid in March 2023 when exports increased by 48% against the previous month. Over the period under review, the exports attained the peak figure at 612M units in August 2023, and then dropped in the following month.
In value terms, container exports reduced to $138M (IndexBox estimates) in September 2023. Overall, exports showed a slight decline. The most prominent rate of growth was recorded in March 2023 when exports increased by 77% against the previous month. The exports peaked at 171M units in September 2022; however, from October 2022 to September 2023, the exports stood at a somewhat lower figure.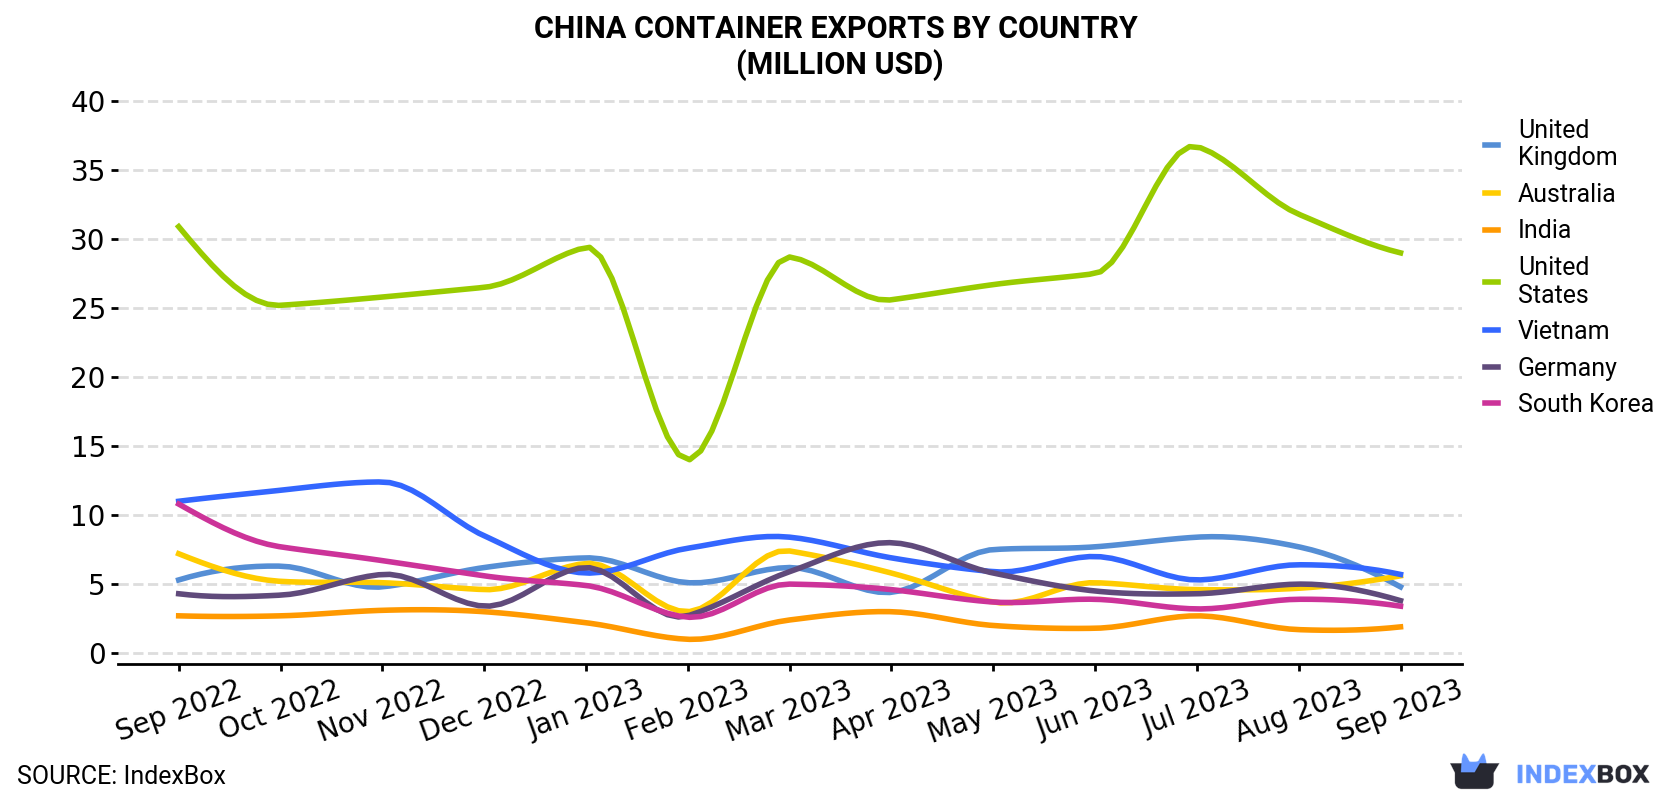
| COUNTRY | Export Value of Container in China (million USD) | ||||||||||||
|---|---|---|---|---|---|---|---|---|---|---|---|---|---|
| Sep 2022 | Oct 2022 | Nov 2022 | Dec 2022 | Jan 2023 | Feb 2023 | Mar 2023 | Apr 2023 | May 2023 | Jun 2023 | Jul 2023 | Aug 2023 | Sep 2023 | |
| United States | 30.9 | 25.2 | 25.8 | 26.5 | 29.4 | 14.0 | 28.7 | 25.6 | 26.7 | 27.5 | 36.7 | 31.8 | 29.0 |
| Vietnam | 11.0 | 11.8 | 12.4 | 8.5 | 5.8 | 7.6 | 8.4 | 6.9 | 5.9 | 7.0 | 5.3 | 6.4 | 5.7 |
| Australia | 7.2 | 5.2 | 5.1 | 4.6 | 6.5 | 3.0 | 7.4 | 5.8 | 3.7 | 5.1 | 4.6 | 4.7 | 5.6 |
| United Kingdom | 5.3 | 6.3 | 4.8 | 6.2 | 6.9 | 5.1 | 6.2 | 4.4 | 7.5 | 7.7 | 8.4 | 7.7 | 4.8 |
| Germany | 4.3 | 4.2 | 5.7 | 3.4 | 6.2 | 2.7 | 5.9 | 8.0 | 5.8 | 4.5 | 4.3 | 5.0 | 3.8 |
| South Korea | 10.8 | 7.7 | 6.7 | 5.6 | 4.9 | 2.6 | 5.0 | 4.6 | 3.7 | 3.9 | 3.2 | 3.9 | 3.4 |
| India | 2.7 | 2.7 | 3.1 | 3.0 | 2.2 | 1.0 | 2.4 | 3.0 | 2.0 | 1.8 | 2.7 | 1.7 | 1.9 |
| Others | 99.0 | 92.0 | 96.9 | 86.7 | 84.8 | 47.4 | 83.8 | 79.3 | 75.7 | 89.4 | 93.1 | 92.2 | 84.2 |
| Total | 171 | 155 | 161 | 144 | 147 | 83.5 | 148 | 138 | 131 | 147 | 158 | 153 | 138 |
Exports by Country
The United States (119M units) was the main destination for container exports from China, accounting for a 21% share of total exports. Moreover, container exports to the United States exceeded the volume sent to the second major destination, Vietnam (27M units), fourfold. The UK (16M units) ranked third in terms of total exports with a 2.8% share.
From September 2022 to September 2023, the average monthly rate of growth in terms of volume to the United States stood at +1.3%. Exports to the other major destinations recorded the following average monthly rates of exports growth: Vietnam (-4.9% per month) and the UK (+1.0% per month).
In value terms, the United States ($29M) remains the key foreign market for container exports from China, comprising 21% of total exports. The second position in the ranking was taken by Vietnam ($5.7M), with a 4.1% share of total exports. It was followed by Australia, with a 4.1% share.
From September 2022 to September 2023, the average monthly growth rate of value to the United States was relatively modest. Exports to the other major destinations recorded the following average monthly rates of exports growth: Vietnam (-5.3% per month) and Australia (-2.0% per month).
Exports by Type
Tanks, casks, drums, cans, boxes and similar containers, for any material (excluding compressed or liquefied gas), of iron or steel, capacity not exceeding 300l, whether or not lined or heat-insulated (372M units) was the largest type of container exported from China, accounting for a 67% share of total exports. Moreover, tanks, casks, drums, cans, boxes and similar containers, for any material (excluding compressed or liquefied gas), of iron or steel, capacity not exceeding 300l, whether or not lined or heat-insulated exceeded the volume of the second product type, aluminium casks, drums, cans, boxes etc (including rigid, collapsible tubular containers), for materials other than compressed, liquefied gas, 300l capacity or less, lined, heat-insulated or not (186M units), twofold.
From September 2022 to September 2023, the average monthly growth rate of the volume of export of tanks, casks, drums, cans, boxes and similar containers, for any material (excluding compressed or liquefied gas), of iron or steel, capacity not exceeding 300l, whether or not lined or heat-insulated stood at +1.2%.
In value terms, tanks, casks, drums, cans, boxes and similar containers, for any material (excluding compressed or liquefied gas), of iron or steel, capacity not exceeding 300l, whether or not lined or heat-insulated ($108M) remains the largest type of container exported from China, comprising 78% of total exports. The second position in the ranking was taken by aluminium casks, drums, cans, boxes etc (including rigid, collapsible tubular containers), for materials other than compressed, liquefied gas, 300l capacity or less, lined, heat-insulated or not ($30M), with a 22% share of total exports.
From September 2022 to September 2023, the average monthly rate of growth in terms of the export volume of tanks, casks, drums, cans, boxes and similar containers, for any material (excluding compressed or liquefied gas), of iron or steel, capacity not exceeding 300l, whether or not lined or heat-insulated stood at -1.7%.
Export Prices by Country
In September 2023, the container price stood at $248 per thousand units (FOB, China), remaining constant against the previous month. Overall, the export price saw a perceptible decrease. The pace of growth appeared the most rapid in March 2023 an increase of 20% against the previous month. The export price peaked at $344 per thousand units in November 2022; however, from December 2022 to September 2023, the export prices stood at a somewhat lower figure.
There were significant differences in the average prices for the major export markets. In September 2023, the country with the highest price was Japan ($506 per thousand units), while the average price for exports to Venezuela ($110 per thousand units) was amongst the lowest.
From September 2022 to September 2023, the most notable rate of growth in terms of prices was recorded for supplies to Australia (+0.7%), while the prices for the other major destinations experienced a decline.
This report provides an in-depth analysis of the container market in China. Within it, you will discover the latest data on market trends and opportunities by country, consumption, production and price developments, as well as the global trade (imports and exports). The forecast exhibits the market prospects through 2030.
Product coverage:
- Prodcom 25911100 - Tanks, casks, drums, cans... (excluding for gas) of iron or steel, . .50 l, . .300 l
- Prodcom 25911200 - Tanks, casks, drums... (excluding for gas) of iron or steel, < .50 l
- Prodcom 25921133 - Cans used for preserving food and drink of iron or steel, < .50 l, food cans
- Prodcom 25921135 - Cans used for preserving food and drink of iron or steel, < .50 l, drinks
- Prodcom 25921150 - Cans other than for preserving food and drink of iron or steel, < .50 l
- Prodcom 25921210 - Aluminium collapsible tubular containers of a capacity . .300 litres, for any material except compressed or liquefied gas
- Prodcom 25921240 - Casks, drums, cans, boxes and similar containers, of aluminium, for any material (other than compressed or liquefied gas), n.e.s. (other than collapsible tubular containers and containers for aerosols)
- Prodcom 25921260 - Aluminium aerosol containers, with a capacity . .300 litres
Country coverage:
Data coverage:
- Market volume and value
- Per Capita consumption
- Forecast of the market dynamics in the medium term
- Trade (exports and imports) in China
- Export and import prices
- Market trends, drivers and restraints
- Key market players and their profiles
Reasons to buy this report:
- Take advantage of the latest data
- Find deeper insights into current market developments
- Discover vital success factors affecting the market
This report is designed for manufacturers, distributors, importers, and wholesalers, as well as for investors, consultants and advisors.
In this report, you can find information that helps you to make informed decisions on the following issues:
- How to diversify your business and benefit from new market opportunities
- How to load your idle production capacity
- How to boost your sales on overseas markets
- How to increase your profit margins
- How to make your supply chain more sustainable
- How to reduce your production and supply chain costs
- How to outsource production to other countries
- How to prepare your business for global expansion
While doing this research, we combine the accumulated expertise of our analysts and the capabilities of artificial intelligence. The AI-based platform, developed by our data scientists, constitutes the key working tool for business analysts, empowering them to discover deep insights and ideas from the marketing data.
-
1. INTRODUCTION
Making Data-Driven Decisions to Grow Your Business
- REPORT DESCRIPTION
- RESEARCH METHODOLOGY AND AI PLATFORM
- DATA-DRIVEN DECISIONS FOR YOUR BUSINESS
- GLOSSARY AND SPECIFIC TERMS
-
2. EXECUTIVE SUMMARY
A Quick Overview of Market Performance
- KEY FINDINGS
- MARKET TRENDS This Chapter is Available Only for the Professional Edition PRO
-
3. MARKET OVERVIEW
Understanding the Current State of The Market and Its Prospects
- MARKET SIZE
- MARKET STRUCTURE
- TRADE BALANCE
- PER CAPITA CONSUMPTION
- MARKET FORECAST TO 2030
-
4. MOST PROMISING PRODUCT
Finding New Products to Diversify Your Business
This Chapter is Available Only for the Professional Edition PRO- TOP PRODUCTS TO DIVERSIFY YOUR BUSINESS
- BEST-SELLING PRODUCTS
- MOST CONSUMED PRODUCT
- MOST TRADED PRODUCT
- MOST PROFITABLE PRODUCT FOR EXPORT
-
5. MOST PROMISING SUPPLYING COUNTRIES
Choosing the Best Countries to Establish Your Sustainable Supply Chain
This Chapter is Available Only for the Professional Edition PRO- TOP COUNTRIES TO SOURCE YOUR PRODUCT
- TOP PRODUCING COUNTRIES
- TOP EXPORTING COUNTRIES
- LOW-COST EXPORTING COUNTRIES
-
6. MOST PROMISING OVERSEAS MARKETS
Choosing the Best Countries to Boost Your Exports
This Chapter is Available Only for the Professional Edition PRO- TOP OVERSEAS MARKETS FOR EXPORTING YOUR PRODUCT
- TOP CONSUMING MARKETS
- UNSATURATED MARKETS
- TOP IMPORTING MARKETS
- MOST PROFITABLE MARKETS
7. PRODUCTION
The Latest Trends and Insights into The Industry
- PRODUCTION VOLUME AND VALUE
8. IMPORTS
The Largest Import Supplying Countries
- IMPORTS FROM 2012–2023
- IMPORTS BY COUNTRY
- IMPORT PRICES BY COUNTRY
9. EXPORTS
The Largest Destinations for Exports
- EXPORTS FROM 2012–2023
- EXPORTS BY COUNTRY
- EXPORT PRICES BY COUNTRY
-
10. PROFILES OF MAJOR PRODUCERS
The Largest Producers on The Market and Their Profiles
This Chapter is Available Only for the Professional Edition PRO -
LIST OF TABLES
- Key Findings In 2023
- Market Volume, In Physical Terms, 2012–2023
- Market Value, 2012–2023
- Per Capita Consumption In 2012-2023
- Imports, In Physical Terms, By Country, 2012–2023
- Imports, In Value Terms, By Country, 2012–2023
- Import Prices, By Country Of Origin, 2012–2023
- Exports, In Physical Terms, By Country, 2012–2023
- Exports, In Value Terms, By Country, 2012–2023
- Export Prices, By Country Of Destination, 2012–2023
-
LIST OF FIGURES
- Market Volume, In Physical Terms, 2012–2023
- Market Value, 2012–2023
- Market Structure – Domestic Supply vs. Imports, In Physical Terms, 2012-2023
- Market Structure – Domestic Supply vs. Imports, In Value Terms, 2012-2023
- Trade Balance, In Physical Terms, 2012-2023
- Trade Balance, In Value Terms, 2012-2023
- Per Capita Consumption, 2012-2023
- Market Volume Forecast to 2030
- Market Value Forecast to 2030
- Products: Market Size And Growth, By Type
- Products: Average Per Capita Consumption, By Type
- Products: Exports And Growth, By Type
- Products: Export Prices And Growth, By Type
- Production Volume And Growth
- Exports And Growth
- Export Prices And Growth
- Market Size And Growth
- Per Capita Consumption
- Imports And Growth
- Import Prices
- Production, In Physical Terms, 2012–2023
- Production, In Value Terms, 2012–2023
- Imports, In Physical Terms, 2012–2023
- Imports, In Value Terms, 2012–2023
- Imports, In Physical Terms, By Country, 2023
- Imports, In Physical Terms, By Country, 2012–2023
- Imports, In Value Terms, By Country, 2012–2023
- Import Prices, By Country Of Origin, 2012–2023
- Exports, In Physical Terms, 2012–2023
- Exports, In Value Terms, 2012–2023
- Exports, In Physical Terms, By Country, 2023
- Exports, In Physical Terms, By Country, 2012–2023
- Exports, In Value Terms, By Country, 2012–2023
- Export Prices, By Country Of Destination, 2012–2023


