
Canada - Ferro-Silicon - Market Analysis, Forecast, Size, Trends And Insights
Get instant access to more than 2 million reports, dashboards, and datasets on the IndexBox Platform.
View PricingCanada's Price for Ferro-silicon Drops to $2,440/Ton
Canada Ferrosilicon Export Price in June 2023
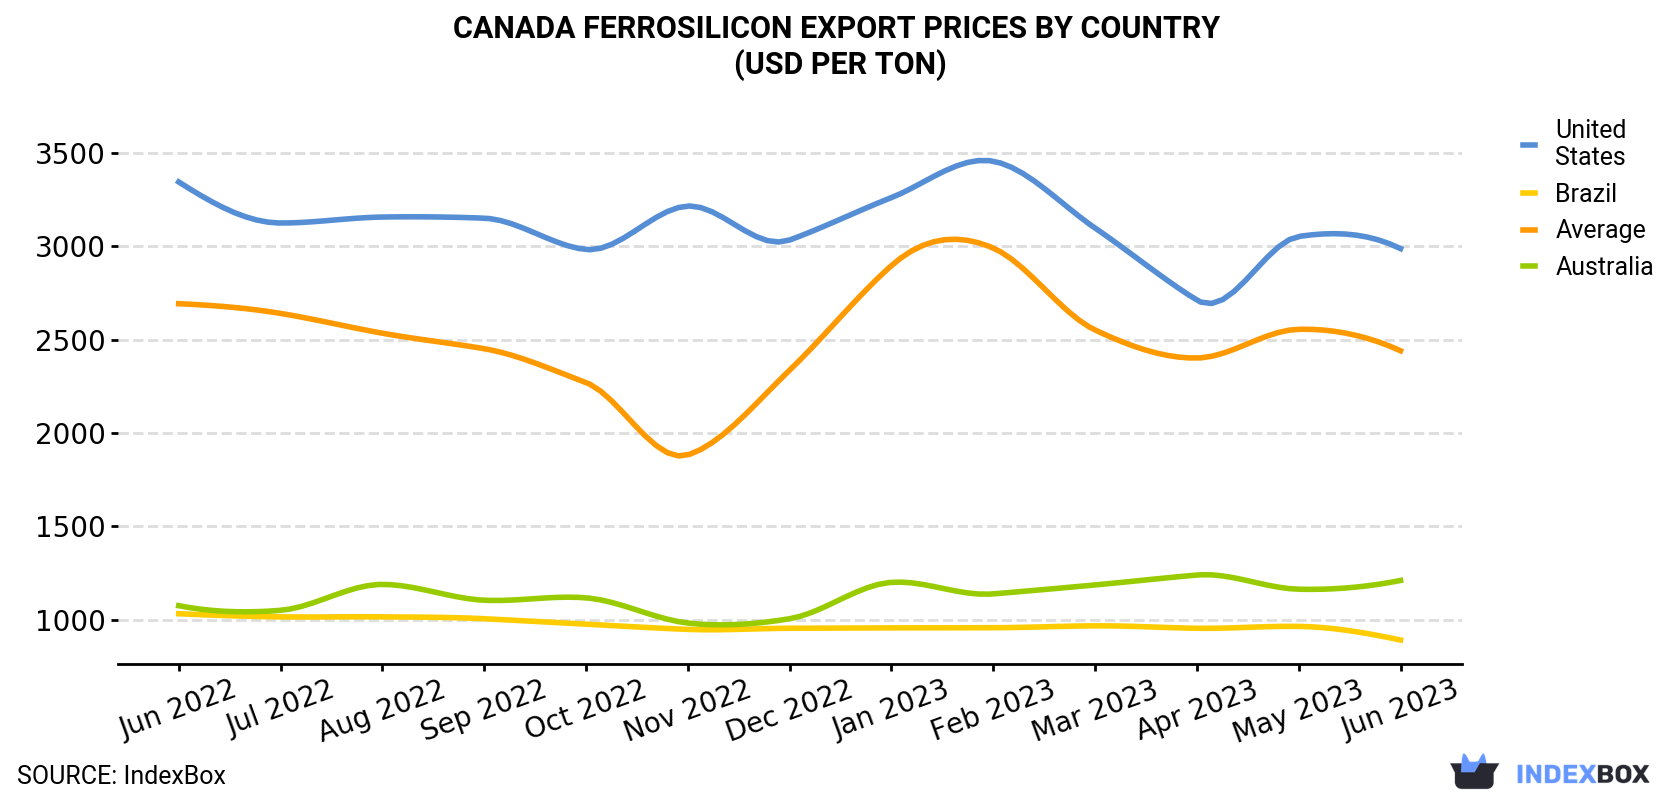
In June 2023, the ferrosilicon price stood at $2,440 per ton (FOB, Canada), shrinking by -4.5% against the previous month. Over the period under review, the export price saw a relatively flat trend pattern. The pace of growth was the most pronounced in December 2022 when the average export price increased by 24% month-to-month. The export price peaked at $2,990 per ton in February 2023; however, from March 2023 to June 2023, the export prices stood at a somewhat lower figure.
Prices varied noticeably by the country of destination: the country with the highest price was the United States ($2,987 per ton), while the average price for exports to Brazil ($891 per ton) was amongst the lowest.
From June 2022 to June 2023, the most notable rate of growth in terms of prices was recorded for supplies to Australia (+1.0%), while the prices for the other major destinations experienced a decline.
| COUNTRY | Export Price of Ferrosilicon in Canada (USD per ton) | ||||||||||||
|---|---|---|---|---|---|---|---|---|---|---|---|---|---|
| Jun 2022 | Jul 2022 | Aug 2022 | Sep 2022 | Oct 2022 | Nov 2022 | Dec 2022 | Jan 2023 | Feb 2023 | Mar 2023 | Apr 2023 | May 2023 | Jun 2023 | |
| United States | 3,344 | 3,124 | 3,156 | 3,150 | 2,982 | 3,215 | 3,033 | 3,260 | 3,455 | 3,097 | 2,711 | 3,052 | 2,987 |
| Australia | 1,075 | 1,050 | 1,189 | 1,104 | 1,117 | 982 | 1,005 | 1,200 | 1,138 | 1,186 | 1,239 | 1,163 | 1,210 |
| Brazil | 1,032 | 1,015 | 1,015 | 1,005 | 976 | 948 | 954 | 956 | 957 | 967 | 954 | 964 | 891 |
| Average | 2,692 | 2,640 | 2,534 | 2,451 | 2,270 | 1,882 | 2,336 | 2,896 | 2,990 | 2,551 | 2,401 | 2,555 | 2,440 |
Canada Ferrosilicon Export Prices by Type
Average prices varied somewhat for the major types of exported product. In June 2023, the product with the highest price was ferro-alloys; ferro-silicon, containing by weight more than 55% of silicon ($3,146 per ton), while the average price for exports of ferro-alloys; ferro-silicon, containing by weight 55% or less of silicon stood at $2,105 per ton.
From June 2022 to June 2023, the most notable rate of growth in terms of prices was recorded for the following types: ferro-alloys; ferro-silicon, containing by weight more than 55% of silicon (+0.3%).
Canada Ferrosilicon Exports
Ferro-silicon exports from Canada dropped to 5K tons in June 2023, standing approximately at May 2023. Overall, exports saw a relatively flat trend pattern. The most prominent rate of growth was recorded in March 2023 when exports increased by 60% against the previous month.
In value terms, ferro-silicon exports declined to $12M (IndexBox estimates) in June 2023. In general, exports recorded a mild setback. The growth pace was the most rapid in March 2023 with an increase of 36% against the previous month.
Canada Ferrosilicon Exports by Type
Ferro-alloys; ferro-silicon, containing by weight 55% or less of silicon (3.4K tons) was the largest type of ferro-silicon exported from Canada, with a 68% share of total exports. Moreover, ferro-alloys; ferro-silicon, containing by weight 55% or less of silicon exceeded the volume of the second product type, ferro-alloys; ferro-silicon, containing by weight more than 55% of silicon (1.6K tons), twofold.
From June 2022 to June 2023, the average monthly rate of growth in terms of the volume of export of ferro-alloys; ferro-silicon, containing by weight 55% or less of silicon was relatively modest.
In value terms, the most traded types of ferro-silicon in Canada were ferro-alloys; ferro-silicon, containing by weight 55% or less of silicon ($7.1M) and ferro-alloys; ferro-silicon, containing by weight more than 55% of silicon ($5M).
Ferro-alloys; ferro-silicon, containing by weight more than 55% of silicon, with a CAGR of -0.3%, recorded the highest rates of growth with regard to the value of exports, in terms of the main product categories over the period under review.
Canada Ferrosilicon Exports by Country
the United States (3.5K tons) was the main destination for ferro-silicon exports from Canada, with a 71% share of total exports. Moreover, ferro-silicon exports to the United States exceeded the volume sent to the second major destination, Australia (990 tons), fourfold. The third position in this ranking was held by Brazil (310 tons), with a 6.2% share.
From June 2022 to June 2023, the average monthly growth rate of volume to the United States was relatively modest. Exports to the other major destinations recorded the following average monthly rates of exports growth: Australia (+0.9% per month) and Brazil (+6.8% per month).
In value terms, the United States ($11M) remains the key foreign market for ferro-silicon exports from Canada, comprising 87% of total exports. The second position in the ranking was taken by Australia ($1.2M), with a 9.8% share of total exports. It was followed by Brazil, with a 2.3% share.
From June 2022 to June 2023, the average monthly growth rate of value to the United States totaled -1.6%. Exports to the other major destinations recorded the following average monthly rates of exports growth: Australia (+1.9% per month) and Brazil (+5.5% per month).
This report provides an in-depth analysis of the ferro-silicon market in Canada. Within it, you will discover the latest data on market trends and opportunities by country, consumption, production and price developments, as well as the global trade (imports and exports). The forecast exhibits the market prospects through 2030.
Product coverage:
- Prodcom 24101230 - Ferro-silicon
- Prodcom 24101235 -
- Prodcom 24101236 -
- Prodcom 24101239 -
Country coverage:
- Canada
Data coverage:
- Market volume and value
- Per Capita consumption
- Forecast of the market dynamics in the medium term
- Trade (exports and imports) in Canada
- Export and import prices
- Market trends, drivers and restraints
- Key market players and their profiles
Reasons to buy this report:
- Take advantage of the latest data
- Find deeper insights into current market developments
- Discover vital success factors affecting the market
This report is designed for manufacturers, distributors, importers, and wholesalers, as well as for investors, consultants and advisors.
In this report, you can find information that helps you to make informed decisions on the following issues:
- How to diversify your business and benefit from new market opportunities
- How to load your idle production capacity
- How to boost your sales on overseas markets
- How to increase your profit margins
- How to make your supply chain more sustainable
- How to reduce your production and supply chain costs
- How to outsource production to other countries
- How to prepare your business for global expansion
While doing this research, we combine the accumulated expertise of our analysts and the capabilities of artificial intelligence. The AI-based platform, developed by our data scientists, constitutes the key working tool for business analysts, empowering them to discover deep insights and ideas from the marketing data.
-
1. INTRODUCTION
Making Data-Driven Decisions to Grow Your Business
- REPORT DESCRIPTION
- RESEARCH METHODOLOGY AND AI PLATFORM
- DATA-DRIVEN DECISIONS FOR YOUR BUSINESS
- GLOSSARY AND SPECIFIC TERMS
-
2. EXECUTIVE SUMMARY
A Quick Overview of Market Performance
- KEY FINDINGS
- MARKET TRENDS This Chapter is Available Only for the Professional Edition PRO
-
3. MARKET OVERVIEW
Understanding the Current State of The Market and Its Prospects
- MARKET SIZE
- MARKET STRUCTURE
- TRADE BALANCE
- PER CAPITA CONSUMPTION
- MARKET FORECAST TO 2030
-
4. MOST PROMISING PRODUCT
Finding New Products to Diversify Your Business
This Chapter is Available Only for the Professional Edition PRO- TOP PRODUCTS TO DIVERSIFY YOUR BUSINESS
- BEST-SELLING PRODUCTS
- MOST CONSUMED PRODUCT
- MOST TRADED PRODUCT
- MOST PROFITABLE PRODUCT FOR EXPORT
-
5. MOST PROMISING SUPPLYING COUNTRIES
Choosing the Best Countries to Establish Your Sustainable Supply Chain
This Chapter is Available Only for the Professional Edition PRO- TOP COUNTRIES TO SOURCE YOUR PRODUCT
- TOP PRODUCING COUNTRIES
- TOP EXPORTING COUNTRIES
- LOW-COST EXPORTING COUNTRIES
-
6. MOST PROMISING OVERSEAS MARKETS
Choosing the Best Countries to Boost Your Exports
This Chapter is Available Only for the Professional Edition PRO- TOP OVERSEAS MARKETS FOR EXPORTING YOUR PRODUCT
- TOP CONSUMING MARKETS
- UNSATURATED MARKETS
- TOP IMPORTING MARKETS
- MOST PROFITABLE MARKETS
7. PRODUCTION
The Latest Trends and Insights into The Industry
- PRODUCTION VOLUME AND VALUE
8. IMPORTS
The Largest Import Supplying Countries
- IMPORTS FROM 2012–2023
- IMPORTS BY COUNTRY
- IMPORT PRICES BY COUNTRY
9. EXPORTS
The Largest Destinations for Exports
- EXPORTS FROM 2012–2023
- EXPORTS BY COUNTRY
- EXPORT PRICES BY COUNTRY
-
10. PROFILES OF MAJOR PRODUCERS
The Largest Producers on The Market and Their Profiles
This Chapter is Available Only for the Professional Edition PRO -
LIST OF TABLES
- Key Findings In 2023
- Market Volume, In Physical Terms, 2012–2023
- Market Value, 2012–2023
- Per Capita Consumption In 2012-2023
- Imports, In Physical Terms, By Country, 2012–2023
- Imports, In Value Terms, By Country, 2012–2023
- Import Prices, By Country Of Origin, 2012–2023
- Exports, In Physical Terms, By Country, 2012–2023
- Exports, In Value Terms, By Country, 2012–2023
- Export Prices, By Country Of Destination, 2012–2023
-
LIST OF FIGURES
- Market Volume, In Physical Terms, 2012–2023
- Market Value, 2012–2023
- Market Structure – Domestic Supply vs. Imports, In Physical Terms, 2012-2023
- Market Structure – Domestic Supply vs. Imports, In Value Terms, 2012-2023
- Trade Balance, In Physical Terms, 2012-2023
- Trade Balance, In Value Terms, 2012-2023
- Per Capita Consumption, 2012-2023
- Market Volume Forecast to 2030
- Market Value Forecast to 2030
- Products: Market Size And Growth, By Type
- Products: Average Per Capita Consumption, By Type
- Products: Exports And Growth, By Type
- Products: Export Prices And Growth, By Type
- Production Volume And Growth
- Exports And Growth
- Export Prices And Growth
- Market Size And Growth
- Per Capita Consumption
- Imports And Growth
- Import Prices
- Production, In Physical Terms, 2012–2023
- Production, In Value Terms, 2012–2023
- Imports, In Physical Terms, 2012–2023
- Imports, In Value Terms, 2012–2023
- Imports, In Physical Terms, By Country, 2023
- Imports, In Physical Terms, By Country, 2012–2023
- Imports, In Value Terms, By Country, 2012–2023
- Import Prices, By Country Of Origin, 2012–2023
- Exports, In Physical Terms, 2012–2023
- Exports, In Value Terms, 2012–2023
- Exports, In Physical Terms, By Country, 2023
- Exports, In Physical Terms, By Country, 2012–2023
- Exports, In Value Terms, By Country, 2012–2023
- Export Prices, By Country Of Destination, 2012–2023


