
Canada - Aluminium Tubes And Pipes - Market Analysis, Forecast, Size, Trends And Insights
Get instant access to more than 2 million reports, dashboards, and datasets on the IndexBox Platform.
View PricingDecline in Canadian Aluminium Tube Imports to $204K in December 2023
Canada Aluminium Tube Imports
In December 2023, the amount of aluminium tubes and pipes imported into Canada dropped dramatically to 28 tons, shrinking by -35.4% on the previous month's figure. Overall, imports saw a slight reduction. The pace of growth appeared the most rapid in February 2023 with an increase of 117% month-to-month.
In value terms, aluminium tube imports dropped dramatically to $204K (IndexBox estimates) in December 2023. In general, imports saw a pronounced slump. The growth pace was the most rapid in February 2023 with an increase of 64% against the previous month.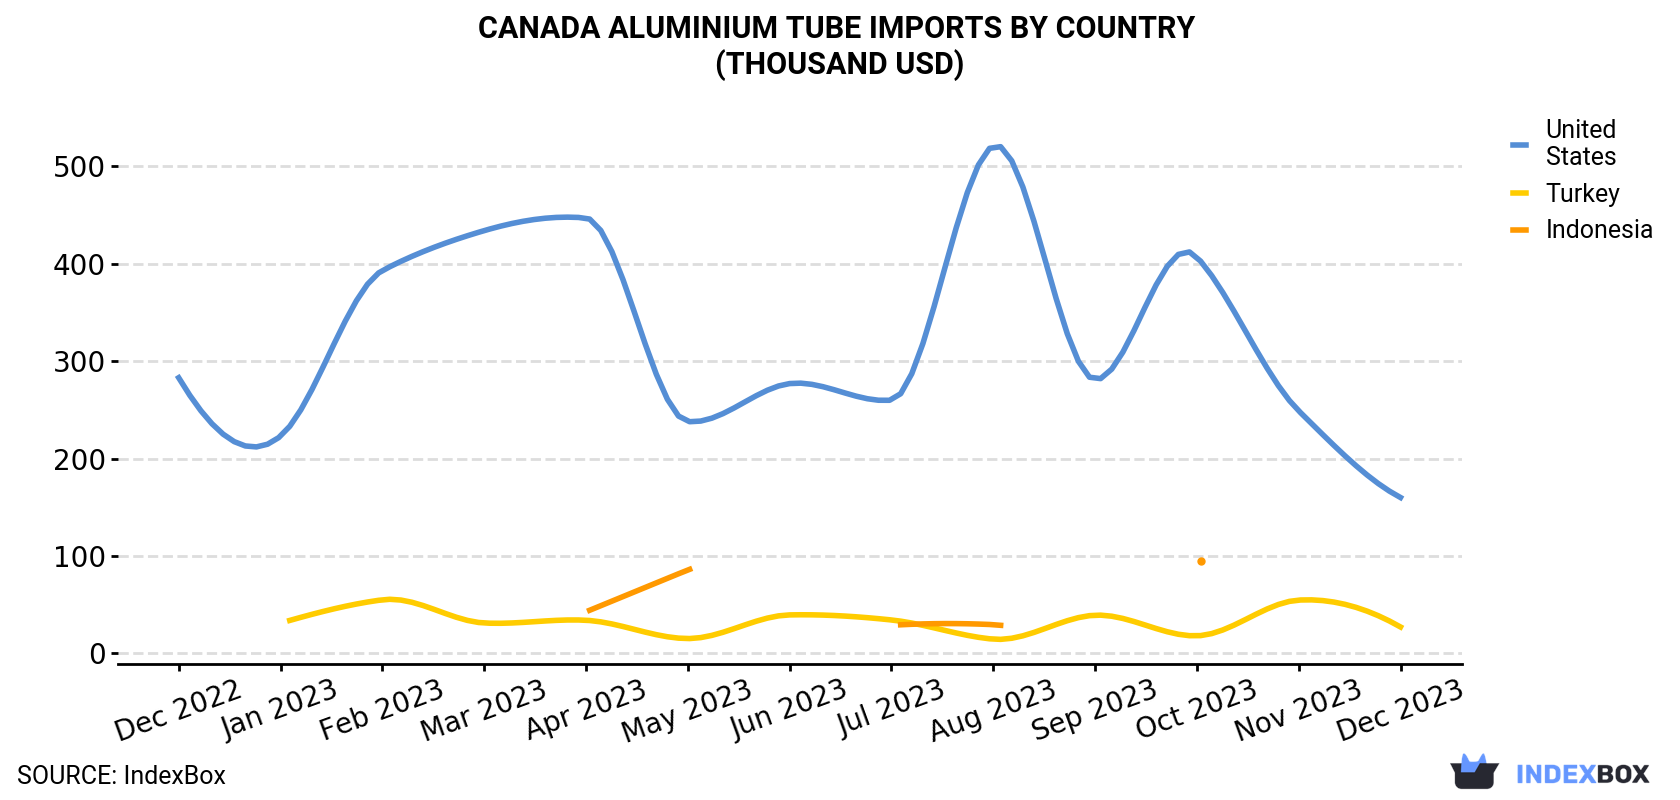
| COUNTRY | Import Value of Aluminium Tube in Canada (thousand USD) | ||||||||||||
|---|---|---|---|---|---|---|---|---|---|---|---|---|---|
| Dec 2022 | Jan 2023 | Feb 2023 | Mar 2023 | Apr 2023 | May 2023 | Jun 2023 | Jul 2023 | Aug 2023 | Sep 2023 | Oct 2023 | Nov 2023 | Dec 2023 | |
| United States | 283 | 223 | 393 | 434 | 447 | 238 | 277 | 260 | 521 | 281 | 407 | 249 | 160 |
| Turkey | N/A | 31.1 | 55.0 | 31.2 | 34.0 | 15.2 | 39.5 | 34.3 | 14.6 | 39.2 | 18.0 | 54.7 | 27.1 |
| Indonesia | N/A | N/A | N/A | N/A | 42.7 | 85.6 | N/A | 28.8 | 29.5 | N/A | 94.8 | N/A | N/A |
| Others | 41.4 | 47.7 | 46.5 | 38.9 | 82.5 | 56.2 | 117 | 82.3 | 56.1 | 240 | 88.1 | 43.0 | 16.7 |
| Total | 325 | 302 | 495 | 504 | 606 | 395 | 434 | 405 | 622 | 560 | 608 | 347 | 204 |
Imports by Country
In December 2023, the United States (23 tons) constituted the largest aluminium tube supplier to Canada, accounting for a 83% share of total imports. Moreover, aluminium tube imports from the United States exceeded the figures recorded by the second-largest supplier, Turkey (4.1 tons), sixfold.
From December 2022 to December 2023, the average monthly rate of growth in terms of volume from the United States amounted to -2.4%.
In value terms, the United States ($160K) constituted the largest supplier of aluminium tube to Canada, comprising 78% of total imports. The second position in the ranking was taken by Turkey ($27K), with a 13% share of total imports.
From December 2022 to December 2023, the average monthly rate of growth in terms of value from the United States amounted to -4.7%.
Import Prices by Country
In December 2023, the aluminium tube price stood at $7,208 per ton (CIF, Canada), shrinking by -9.3% against the previous month. In general, the import price recorded a noticeable setback. The most prominent rate of growth was recorded in June 2023 an increase of 41% m-o-m. Over the period under review, average import prices reached the peak figure at $12,433 per ton in September 2023; however, from October 2023 to December 2023, import prices remained at a lower figure.
Average prices varied noticeably amongst the major supplying countries. In December 2023, the country with the highest price was the United States ($6,803 per ton), while the price for Turkey totaled $6,682 per ton.
From December 2022 to December 2023, the most notable rate of growth in terms of prices was attained by Indonesia (-0.8%), while the prices for the other major suppliers experienced a decline.
This report provides an in-depth analysis of the aluminium tube market in Canada. Within it, you will discover the latest data on market trends and opportunities by country, consumption, production and price developments, as well as the global trade (imports and exports). The forecast exhibits the market prospects through 2030.
Product coverage:
- Prodcom 24422630 - Aluminium tubes and pipes (excluding hollow profiles, tube or pipe fittings, flexible tubing, tubes and pipes prepared for use in structures, machinery or vehicle parts, or the like)
Country coverage:
- Canada
Data coverage:
- Market volume and value
- Per Capita consumption
- Forecast of the market dynamics in the medium term
- Trade (exports and imports) in Canada
- Export and import prices
- Market trends, drivers and restraints
- Key market players and their profiles
Reasons to buy this report:
- Take advantage of the latest data
- Find deeper insights into current market developments
- Discover vital success factors affecting the market
This report is designed for manufacturers, distributors, importers, and wholesalers, as well as for investors, consultants and advisors.
In this report, you can find information that helps you to make informed decisions on the following issues:
- How to diversify your business and benefit from new market opportunities
- How to load your idle production capacity
- How to boost your sales on overseas markets
- How to increase your profit margins
- How to make your supply chain more sustainable
- How to reduce your production and supply chain costs
- How to outsource production to other countries
- How to prepare your business for global expansion
While doing this research, we combine the accumulated expertise of our analysts and the capabilities of artificial intelligence. The AI-based platform, developed by our data scientists, constitutes the key working tool for business analysts, empowering them to discover deep insights and ideas from the marketing data.
-
1. INTRODUCTION
Making Data-Driven Decisions to Grow Your Business
- REPORT DESCRIPTION
- RESEARCH METHODOLOGY AND AI PLATFORM
- DATA-DRIVEN DECISIONS FOR YOUR BUSINESS
- GLOSSARY AND SPECIFIC TERMS
-
2. EXECUTIVE SUMMARY
A Quick Overview of Market Performance
- KEY FINDINGS
- MARKET TRENDS This Chapter is Available Only for the Professional Edition PRO
-
3. MARKET OVERVIEW
Understanding the Current State of The Market and Its Prospects
- MARKET SIZE
- MARKET STRUCTURE
- TRADE BALANCE
- PER CAPITA CONSUMPTION
- MARKET FORECAST TO 2030
-
4. MOST PROMISING PRODUCT
Finding New Products to Diversify Your Business
This Chapter is Available Only for the Professional Edition PRO- TOP PRODUCTS TO DIVERSIFY YOUR BUSINESS
- BEST-SELLING PRODUCTS
- MOST CONSUMED PRODUCT
- MOST TRADED PRODUCT
- MOST PROFITABLE PRODUCT FOR EXPORT
-
5. MOST PROMISING SUPPLYING COUNTRIES
Choosing the Best Countries to Establish Your Sustainable Supply Chain
This Chapter is Available Only for the Professional Edition PRO- TOP COUNTRIES TO SOURCE YOUR PRODUCT
- TOP PRODUCING COUNTRIES
- TOP EXPORTING COUNTRIES
- LOW-COST EXPORTING COUNTRIES
-
6. MOST PROMISING OVERSEAS MARKETS
Choosing the Best Countries to Boost Your Exports
This Chapter is Available Only for the Professional Edition PRO- TOP OVERSEAS MARKETS FOR EXPORTING YOUR PRODUCT
- TOP CONSUMING MARKETS
- UNSATURATED MARKETS
- TOP IMPORTING MARKETS
- MOST PROFITABLE MARKETS
7. PRODUCTION
The Latest Trends and Insights into The Industry
- PRODUCTION VOLUME AND VALUE
8. IMPORTS
The Largest Import Supplying Countries
- IMPORTS FROM 2012–2023
- IMPORTS BY COUNTRY
- IMPORT PRICES BY COUNTRY
9. EXPORTS
The Largest Destinations for Exports
- EXPORTS FROM 2012–2023
- EXPORTS BY COUNTRY
- EXPORT PRICES BY COUNTRY
-
10. PROFILES OF MAJOR PRODUCERS
The Largest Producers on The Market and Their Profiles
This Chapter is Available Only for the Professional Edition PRO -
LIST OF TABLES
- Key Findings In 2023
- Market Volume, In Physical Terms, 2012–2023
- Market Value, 2012–2023
- Per Capita Consumption In 2012-2023
- Imports, In Physical Terms, By Country, 2012–2023
- Imports, In Value Terms, By Country, 2012–2023
- Import Prices, By Country Of Origin, 2012–2023
- Exports, In Physical Terms, By Country, 2012–2023
- Exports, In Value Terms, By Country, 2012–2023
- Export Prices, By Country Of Destination, 2012–2023
-
LIST OF FIGURES
- Market Volume, In Physical Terms, 2012–2023
- Market Value, 2012–2023
- Market Structure – Domestic Supply vs. Imports, In Physical Terms, 2012-2023
- Market Structure – Domestic Supply vs. Imports, In Value Terms, 2012-2023
- Trade Balance, In Physical Terms, 2012-2023
- Trade Balance, In Value Terms, 2012-2023
- Per Capita Consumption, 2012-2023
- Market Volume Forecast to 2030
- Market Value Forecast to 2030
- Products: Market Size And Growth, By Type
- Products: Average Per Capita Consumption, By Type
- Products: Exports And Growth, By Type
- Products: Export Prices And Growth, By Type
- Production Volume And Growth
- Exports And Growth
- Export Prices And Growth
- Market Size And Growth
- Per Capita Consumption
- Imports And Growth
- Import Prices
- Production, In Physical Terms, 2012–2023
- Production, In Value Terms, 2012–2023
- Imports, In Physical Terms, 2012–2023
- Imports, In Value Terms, 2012–2023
- Imports, In Physical Terms, By Country, 2023
- Imports, In Physical Terms, By Country, 2012–2023
- Imports, In Value Terms, By Country, 2012–2023
- Import Prices, By Country Of Origin, 2012–2023
- Exports, In Physical Terms, 2012–2023
- Exports, In Value Terms, 2012–2023
- Exports, In Physical Terms, By Country, 2023
- Exports, In Physical Terms, By Country, 2012–2023
- Exports, In Value Terms, By Country, 2012–2023
- Export Prices, By Country Of Destination, 2012–2023


