Brazil - Transmission Shafts And Cranks, Bearing Housings And Plain Shaft Bearings, Gears And Gearing And Articulated Link Chain - Market Analysis, Forecast, Size, Trends and Insights
Get instant access to more than 2 million reports, dashboards, and datasets on the IndexBox Platform.
View PricingBrazil Sees a Drop in Imports of Shafts to $158M in January 2024
Brazil Transmission Shaft Imports
In January 2024, the amount of transmission shafts and cranks, bearing housings and plain shaft bearings, gears and gearing and articulated link chain imported into Brazil amounted to 15K tons, growing by 5.3% against the previous month. Overall, imports, however, saw a relatively flat trend pattern. The pace of growth was the most pronounced in October 2023 when imports increased by 39% against the previous month.
In value terms, transmission shaft imports reduced modestly to $158M (IndexBox estimates) in January 2024. In general, imports, however, continue to indicate a slight contraction. The pace of growth appeared the most rapid in May 2023 when imports increased by 29% m-o-m. As a result, imports attained the peak of $214M. From June 2023 to January 2024, the growth of imports remained at a somewhat lower figure.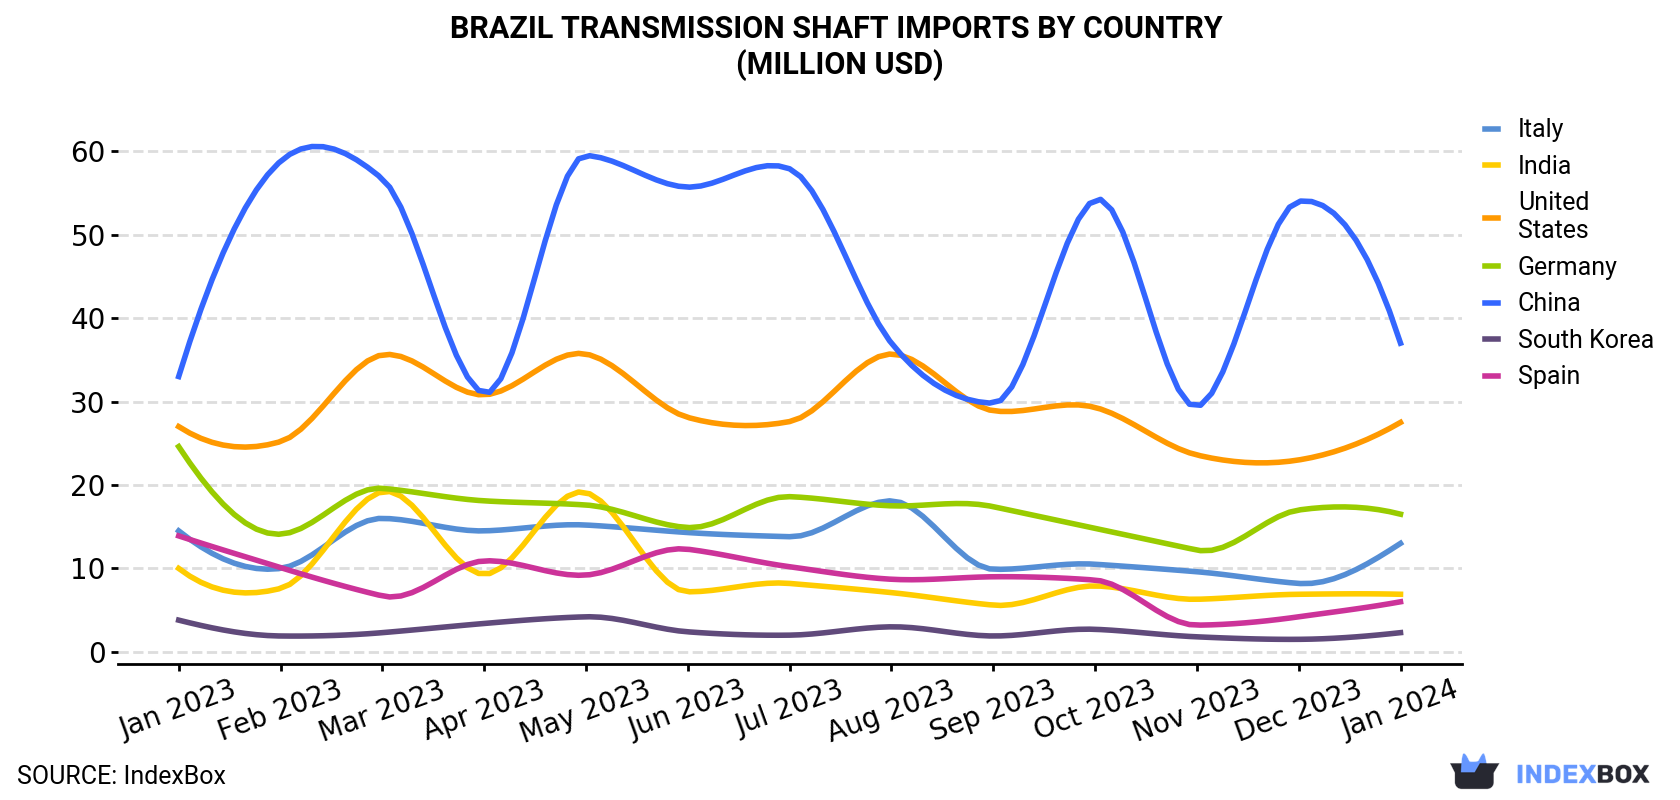
| COUNTRY | Import Value of Transmission Shaft in Brazil (million USD) | ||||||||||||
|---|---|---|---|---|---|---|---|---|---|---|---|---|---|
| Jan 2023 | Feb 2023 | Mar 2023 | Apr 2023 | May 2023 | Jun 2023 | Jul 2023 | Aug 2023 | Sep 2023 | Oct 2023 | Nov 2023 | Dec 2023 | Jan 2024 | |
| China | 33.0 | 58.8 | 56.7 | 31.0 | 59.5 | 55.7 | 57.9 | 37.0 | 29.8 | 54.2 | 29.4 | 54.0 | 37.0 |
| United States | 27.0 | 25.2 | 35.6 | 30.8 | 35.7 | 28.1 | 27.6 | 35.7 | 28.9 | 29.3 | 23.6 | 23.0 | 27.5 |
| Germany | 24.6 | 14.1 | 19.6 | 18.1 | 17.6 | 14.9 | 18.6 | 17.5 | 17.4 | 14.8 | 12.2 | 17.0 | 16.5 |
| Italy | 14.5 | 10.0 | 16.0 | 14.5 | 15.2 | 14.3 | 13.8 | 18.1 | 9.9 | 10.5 | 9.6 | 8.2 | 13.0 |
| India | 10.0 | 7.6 | 19.2 | 9.3 | 19.1 | 7.2 | 8.2 | 7.1 | 5.6 | 7.9 | 6.3 | 6.9 | 6.9 |
| Spain | 13.9 | 10.1 | 6.7 | 10.9 | 9.2 | 12.3 | 10.2 | 8.7 | 9.0 | 8.6 | 3.2 | 4.2 | 6.0 |
| South Korea | 3.8 | 1.9 | 2.3 | 3.4 | 4.2 | 2.4 | 2.0 | 3.0 | 1.9 | 2.7 | 1.8 | 1.5 | 2.3 |
| Others | 50.3 | 39.7 | 57.0 | 48.0 | 54.0 | 45.4 | 50.6 | 51.6 | 40.6 | 47.7 | 39.9 | 45.0 | 48.2 |
| Total | 177 | 167 | 213 | 166 | 214 | 180 | 189 | 179 | 143 | 176 | 126 | 160 | 158 |
Imports by Country
In January 2024, China (7.9K tons) constituted the largest transmission shaft supplier to Brazil, accounting for a 53% share of total imports. Moreover, transmission shaft imports from China exceeded the figures recorded by the second-largest supplier, Germany (983 tons), eightfold. Italy (929 tons) ranked third in terms of total imports with a 6.2% share.
From January 2023 to January 2024, the average monthly growth rate of volume from China stood at +3.0%. The remaining supplying countries recorded the following average monthly rates of imports growth: Germany (-4.0% per month) and Italy (-1.8% per month).
In value terms, China ($37M), the United States ($28M) and Germany ($16M) constituted the largest transmission shaft suppliers to Brazil, with a combined 51% share of total imports.
In terms of the main suppliers, China, with a CAGR of +0.9%, saw the highest rates of growth with regard to the value of imports, over the period under review, while purchases for the other leaders experienced mixed trend patterns.
Imports by Type
Gearboxes and speed changers (4.7K tons), cranks and crankshafts (3.8K tons) and chain; articulated link, roller, of iron or steel (2.3K tons) were the main products of transmission shaft imports to Brazil, with a combined 72% share of total imports.
From January 2023 to January 2024, the most notable rate of growth in terms of purchases, amongst the major product types, was attained by chain; articulated link, roller, of iron or steel (with a CAGR of +4.7%), while imports for the other products experienced more modest paces of growth.
In value terms, the most traded types of transmission shafts and cranks, bearing housings and plain shaft bearings, gears and gearing and articulated link chain in Brazil were gearboxes and speed changers ($55M), cranks and crankshafts ($52M) and bearing housings not incorporating ball or roller bearings, plain shaft bearings ($17M), with a combined 79% share of total imports. Flywheels and pulleys, clutches and shaft couplings, chain; articulated link, roller, of iron or steel, iron or steel articulated link chain and bearing housings incorporating ball or roller bearings lagged somewhat behind, together comprising a further 21%.
Import Prices by Country
In January 2024, the transmission shaft price stood at $10,559 per ton (CIF, Brazil), with a decrease of -6.3% against the previous month. Overall, the import price showed a relatively flat trend pattern. The most prominent rate of growth was recorded in November 2023 when the average import price increased by 12% against the previous month. The import price peaked at $12,275 per ton in September 2023; however, from October 2023 to January 2024, import prices failed to regain momentum.
Prices varied noticeably by the country of origin: the country with the highest price was the United States ($45,191 per ton), while the price for China ($4,666 per ton) was amongst the lowest.
From January 2023 to January 2024, the most notable rate of growth in terms of prices was attained by the United States (+3.2%), while the prices for the other major suppliers experienced more modest paces of growth.
This report provides an in-depth analysis of the transmission shaft market in Brazil. Within it, you will discover the latest data on market trends and opportunities by country, consumption, production and price developments, as well as the global trade (imports and exports). The forecast exhibits the market prospects through 2030.
Product coverage:
- Prodcom 28152130 - Iron or steel roller chain of a kind used for cycles and motor cycles
- Prodcom 28152150 - Iron or steel roller chain (excluding of a kind used for cycles or motor-cycles)
- Prodcom 28152170 - Iron or steel articulated link chain (excluding roller chain)
- Prodcom 28152230 - Cranks and crankshafts
- Prodcom 28152250 - Cardan shafts
- Prodcom 28152270 - Other shafts
- Prodcom 28152330 - Bearing housings incorporating ball or roller bearings
- Prodcom 28152350 - Bearing housings not incorporating ball or roller bearings, p lain shaft bearings
- Prodcom 28152432 - Gear boxes for stationary equipment, spur and helical gear boxes
- Prodcom 28152433 - Gear boxes ..., bevel and bevel/spur and helical gear boxes
- Prodcom 28152434 - Gear boxes ..., worm gear boxes
- Prodcom 28152440 - Other gear boxes
- Prodcom 28152450 - Gearboxes and other speed changers for machinery and land/sea vehicles excluding gears and gearing
- Prodcom 28152473 - Ball or roller screws
- Prodcom 28152475 - Other transmission elements (excluding gears and gearing, b all or roller screws, gearboxes and other speed changers)
- Prodcom 28152500 - Flywheels and pulleys (including pulley blocks)
- Prodcom 28152600 - Clutches and shaft couplings (including universal joints)
- Prodcom 28153930 - Parts of bearing housings
- Prodcom 28153950 - Parts of transmission, cam and crankshafts, cranks, plain shaft bearings, gears, ball/roller screws, gearboxes, torque converters, flywheels, pulleys, clutches, shaft couplings, u niversal joints
Country coverage:
- Brazil
Data coverage:
- Market volume and value
- Per Capita consumption
- Forecast of the market dynamics in the medium term
- Trade (exports and imports) in Brazil
- Export and import prices
- Market trends, drivers and restraints
- Key market players and their profiles
Reasons to buy this report:
- Take advantage of the latest data
- Find deeper insights into current market developments
- Discover vital success factors affecting the market
This report is designed for manufacturers, distributors, importers, and wholesalers, as well as for investors, consultants and advisors.
In this report, you can find information that helps you to make informed decisions on the following issues:
- How to diversify your business and benefit from new market opportunities
- How to load your idle production capacity
- How to boost your sales on overseas markets
- How to increase your profit margins
- How to make your supply chain more sustainable
- How to reduce your production and supply chain costs
- How to outsource production to other countries
- How to prepare your business for global expansion
While doing this research, we combine the accumulated expertise of our analysts and the capabilities of artificial intelligence. The AI-based platform, developed by our data scientists, constitutes the key working tool for business analysts, empowering them to discover deep insights and ideas from the marketing data.
-
1. INTRODUCTION
Making Data-Driven Decisions to Grow Your Business
- REPORT DESCRIPTION
- RESEARCH METHODOLOGY AND AI PLATFORM
- DATA-DRIVEN DECISIONS FOR YOUR BUSINESS
- GLOSSARY AND SPECIFIC TERMS
-
2. EXECUTIVE SUMMARY
A Quick Overview of Market Performance
- KEY FINDINGS
- MARKET TRENDS This Chapter is Available Only for the Professional Edition PRO
-
3. MARKET OVERVIEW
Understanding the Current State of The Market and Its Prospects
- MARKET SIZE
- MARKET STRUCTURE
- TRADE BALANCE
- PER CAPITA CONSUMPTION
- MARKET FORECAST TO 2030
-
4. MOST PROMISING PRODUCT
Finding New Products to Diversify Your Business
This Chapter is Available Only for the Professional Edition PRO- TOP PRODUCTS TO DIVERSIFY YOUR BUSINESS
- BEST-SELLING PRODUCTS
- MOST CONSUMED PRODUCT
- MOST TRADED PRODUCT
- MOST PROFITABLE PRODUCT FOR EXPORT
-
5. MOST PROMISING SUPPLYING COUNTRIES
Choosing the Best Countries to Establish Your Sustainable Supply Chain
This Chapter is Available Only for the Professional Edition PRO- TOP COUNTRIES TO SOURCE YOUR PRODUCT
- TOP PRODUCING COUNTRIES
- TOP EXPORTING COUNTRIES
- LOW-COST EXPORTING COUNTRIES
-
6. MOST PROMISING OVERSEAS MARKETS
Choosing the Best Countries to Boost Your Exports
This Chapter is Available Only for the Professional Edition PRO- TOP OVERSEAS MARKETS FOR EXPORTING YOUR PRODUCT
- TOP CONSUMING MARKETS
- UNSATURATED MARKETS
- TOP IMPORTING MARKETS
- MOST PROFITABLE MARKETS
7. PRODUCTION
The Latest Trends and Insights into The Industry
- PRODUCTION VOLUME AND VALUE
8. IMPORTS
The Largest Import Supplying Countries
- IMPORTS FROM 2012–2023
- IMPORTS BY COUNTRY
- IMPORT PRICES BY COUNTRY
9. EXPORTS
The Largest Destinations for Exports
- EXPORTS FROM 2012–2023
- EXPORTS BY COUNTRY
- EXPORT PRICES BY COUNTRY
-
10. PROFILES OF MAJOR PRODUCERS
The Largest Producers on The Market and Their Profiles
This Chapter is Available Only for the Professional Edition PRO -
LIST OF TABLES
- Key Findings In 2023
- Market Volume, In Physical Terms, 2012–2023
- Market Value, 2012–2023
- Per Capita Consumption In 2012-2023
- Imports, In Physical Terms, By Country, 2012–2023
- Imports, In Value Terms, By Country, 2012–2023
- Import Prices, By Country Of Origin, 2012–2023
- Exports, In Physical Terms, By Country, 2012–2023
- Exports, In Value Terms, By Country, 2012–2023
- Export Prices, By Country Of Destination, 2012–2023
-
LIST OF FIGURES
- Market Volume, In Physical Terms, 2012–2023
- Market Value, 2012–2023
- Market Structure – Domestic Supply vs. Imports, In Physical Terms, 2012-2023
- Market Structure – Domestic Supply vs. Imports, In Value Terms, 2012-2023
- Trade Balance, In Physical Terms, 2012-2023
- Trade Balance, In Value Terms, 2012-2023
- Per Capita Consumption, 2012-2023
- Market Volume Forecast to 2030
- Market Value Forecast to 2030
- Products: Market Size And Growth, By Type
- Products: Average Per Capita Consumption, By Type
- Products: Exports And Growth, By Type
- Products: Export Prices And Growth, By Type
- Production Volume And Growth
- Exports And Growth
- Export Prices And Growth
- Market Size And Growth
- Per Capita Consumption
- Imports And Growth
- Import Prices
- Production, In Physical Terms, 2012–2023
- Production, In Value Terms, 2012–2023
- Imports, In Physical Terms, 2012–2023
- Imports, In Value Terms, 2012–2023
- Imports, In Physical Terms, By Country, 2023
- Imports, In Physical Terms, By Country, 2012–2023
- Imports, In Value Terms, By Country, 2012–2023
- Import Prices, By Country Of Origin, 2012–2023
- Exports, In Physical Terms, 2012–2023
- Exports, In Value Terms, 2012–2023
- Exports, In Physical Terms, By Country, 2023
- Exports, In Physical Terms, By Country, 2012–2023
- Exports, In Value Terms, By Country, 2012–2023
- Export Prices, By Country Of Destination, 2012–2023


