
Brazil - Tapered Roller Bearings - Market Analysis, Forecast, Size, Trends And Insights
Get instant access to more than 2 million reports, dashboards, and datasets on the IndexBox Platform.
View PricingSignificant Surge in Brazil's Tapered Roller Bearing Imports Hits $12M in October 2023
Brazil Tapered Roller Bearing Imports
In October 2023, supplies from abroad of tapered roller bearings decreased by -20% to 1.5K tons, falling for the second consecutive month after two months of growth. In general, imports saw a perceptible contraction. The most prominent rate of growth was recorded in March 2023 with an increase of 75% m-o-m. As a result, imports reached the peak of 2.2K tons. From April 2023 to October 2023, the growth of imports remained at a somewhat lower figure.
In value terms, tapered roller bearing imports rose slightly to $12M (IndexBox estimates) in October 2023. Over the period under review, imports recorded a slight downturn. The growth pace was the most rapid in March 2023 when imports increased by 48% m-o-m. As a result, imports attained the peak of $16M. From April 2023 to October 2023, the growth of imports remained at a somewhat lower figure.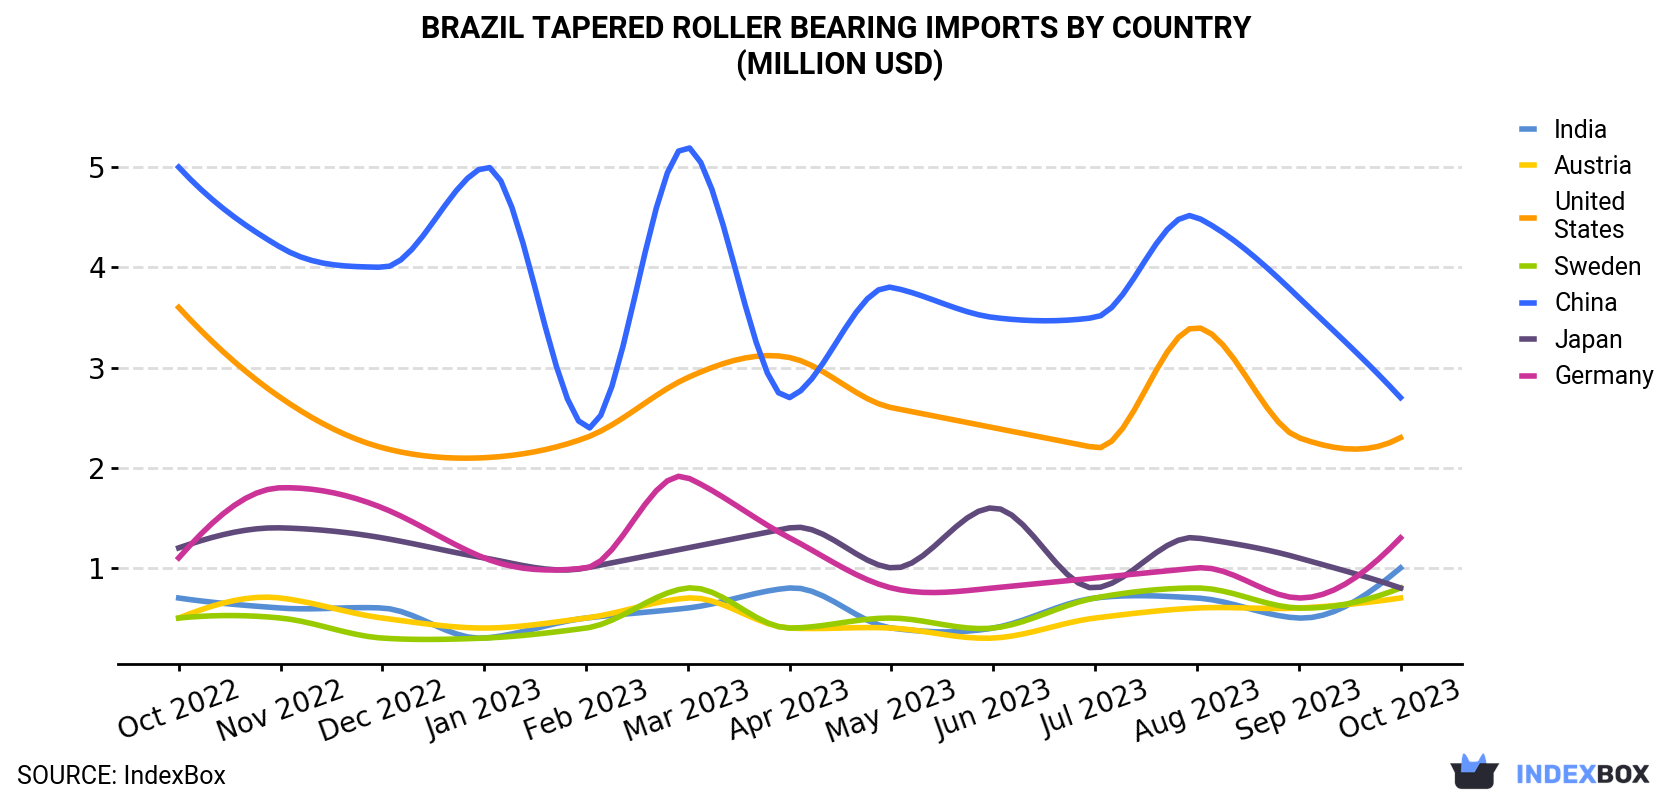
| COUNTRY | Import Value of Tapered Roller Bearing in Brazil (million USD) | ||||||||||||
|---|---|---|---|---|---|---|---|---|---|---|---|---|---|
| Oct 2022 | Nov 2022 | Dec 2022 | Jan 2023 | Feb 2023 | Mar 2023 | Apr 2023 | May 2023 | Jun 2023 | Jul 2023 | Aug 2023 | Sep 2023 | Oct 2023 | |
| China | 5.0 | 4.2 | 4.0 | 5.0 | 2.4 | 5.2 | 2.7 | 3.8 | 3.5 | 3.5 | 4.5 | 3.7 | 2.7 |
| United States | 3.6 | 2.7 | 2.2 | 2.1 | 2.3 | 2.9 | 3.1 | 2.6 | 2.4 | 2.2 | 3.4 | 2.3 | 2.3 |
| Germany | 1.1 | 1.8 | 1.6 | 1.1 | 1.0 | 1.9 | 1.3 | 0.8 | 0.8 | 0.9 | 1.0 | 0.7 | 1.3 |
| India | 0.7 | 0.6 | 0.6 | 0.3 | 0.5 | 0.6 | 0.8 | 0.4 | 0.4 | 0.7 | 0.7 | 0.5 | 1.0 |
| Sweden | 0.5 | 0.5 | 0.3 | 0.3 | 0.4 | 0.8 | 0.4 | 0.5 | 0.4 | 0.7 | 0.8 | 0.6 | 0.8 |
| Japan | 1.2 | 1.4 | 1.3 | 1.1 | 1.0 | 1.2 | 1.4 | 1.0 | 1.6 | 0.8 | 1.3 | 1.1 | 0.8 |
| Austria | 0.5 | 0.7 | 0.5 | 0.4 | 0.5 | 0.7 | 0.4 | 0.4 | 0.3 | 0.5 | 0.6 | 0.6 | 0.7 |
| Others | 2.7 | 2.9 | 2.6 | 2.8 | 2.8 | 2.8 | 2.7 | 2.4 | 1.8 | 2.4 | 2.1 | 2.4 | 2.9 |
| Total | 15.4 | 14.8 | 13.0 | 13.2 | 10.9 | 16.1 | 12.7 | 12.0 | 11.2 | 11.8 | 14.4 | 11.9 | 12.5 |
Imports by Country
In October 2023, China (702 tons), followed by the United States (103 tons), Japan (56 tons) and Germany (103 tons) were the key importers of tapered roller bearings, together comprising 5.4% of total imports. The following importers - India (87,174 kg), Austria (78,507 kg) and Sweden (61,971 kg) - each resulted at a 1.3% share of total imports.
From October 2022 to October 2023, average monthly rates of growth with regard to tapered roller bearing imports into China stood at -4.3%. At the same time, Sweden (+1.9%) and Austria (+1.2%) displayed positive paces of growth. Moreover, Sweden emerged as the fastest-growing importer imported in the world, with a CAGR of +1.9% from October 2022-October 2023. Germany experienced a relatively flat trend pattern. By contrast, India (-1.6%), Japan (-4.3%) and the United States (-4.6%) illustrated a downward trend over the same period. The shares of the largest importers remained relatively stable throughout the analyzed period.
In value terms, the largest tapered roller bearing importing markets into Brazil were China ($2.7M), the United States ($2.3M) and Germany ($1.3M), together accounting for 3.2% of total imports. These countries were followed by India, Sweden, Japan and Austria, which together accounted for a further 1.6%.
In terms of the main importing countries, Sweden, with a CAGR of +4.4%, recorded the highest rates of growth with regard to the value of imports, over the period under review, while purchases for the other leaders experienced more modest paces of growth.
Import Prices by Country
In October 2023, the tapered roller bearing price amounted to $8,507 per ton (CIF, Brazil), jumping by 31% against the previous month. Over the period from October 2022 to October 2023, it increased at an average monthly rate of +1.1%. The pace of growth was the most pronounced in February 2023 when the import price increased by 39% m-o-m. As a result, import price attained the peak level of $8,678 per ton. From March 2023 to October 2023, the import prices remained at a lower figure.
There were significant differences in the average prices amongst the major importing countries. In October 2023, the country with the highest price was the United States ($22,838 per ton), while Hong Kong ($2,919 per ton) was amongst the lowest.
From October 2022 to October 2023, the most notable rate of growth in terms of prices was attained by Spain (+4.8%), while the other leaders experienced more modest paces of growth.
This report provides an in-depth analysis of the tapered roller bearing market in Brazil. Within it, you will discover the latest data on market trends and opportunities by country, consumption, production and price developments, as well as the global trade (imports and exports). The forecast exhibits the market prospects through 2030.
Product coverage:
- Prodcom 28151053 - Tapered roller bearings (including cone and tapered roller assemblies)
Country coverage:
- Brazil
Data coverage:
- Market volume and value
- Per Capita consumption
- Forecast of the market dynamics in the medium term
- Trade (exports and imports) in Brazil
- Export and import prices
- Market trends, drivers and restraints
- Key market players and their profiles
Reasons to buy this report:
- Take advantage of the latest data
- Find deeper insights into current market developments
- Discover vital success factors affecting the market
This report is designed for manufacturers, distributors, importers, and wholesalers, as well as for investors, consultants and advisors.
In this report, you can find information that helps you to make informed decisions on the following issues:
- How to diversify your business and benefit from new market opportunities
- How to load your idle production capacity
- How to boost your sales on overseas markets
- How to increase your profit margins
- How to make your supply chain more sustainable
- How to reduce your production and supply chain costs
- How to outsource production to other countries
- How to prepare your business for global expansion
While doing this research, we combine the accumulated expertise of our analysts and the capabilities of artificial intelligence. The AI-based platform, developed by our data scientists, constitutes the key working tool for business analysts, empowering them to discover deep insights and ideas from the marketing data.
-
1. INTRODUCTION
Making Data-Driven Decisions to Grow Your Business
- REPORT DESCRIPTION
- RESEARCH METHODOLOGY AND AI PLATFORM
- DATA-DRIVEN DECISIONS FOR YOUR BUSINESS
- GLOSSARY AND SPECIFIC TERMS
-
2. EXECUTIVE SUMMARY
A Quick Overview of Market Performance
- KEY FINDINGS
- MARKET TRENDS This Chapter is Available Only for the Professional Edition PRO
-
3. MARKET OVERVIEW
Understanding the Current State of The Market and Its Prospects
- MARKET SIZE
- MARKET STRUCTURE
- TRADE BALANCE
- PER CAPITA CONSUMPTION
- MARKET FORECAST TO 2030
-
4. MOST PROMISING PRODUCT
Finding New Products to Diversify Your Business
This Chapter is Available Only for the Professional Edition PRO- TOP PRODUCTS TO DIVERSIFY YOUR BUSINESS
- BEST-SELLING PRODUCTS
- MOST CONSUMED PRODUCT
- MOST TRADED PRODUCT
- MOST PROFITABLE PRODUCT FOR EXPORT
-
5. MOST PROMISING SUPPLYING COUNTRIES
Choosing the Best Countries to Establish Your Sustainable Supply Chain
This Chapter is Available Only for the Professional Edition PRO- TOP COUNTRIES TO SOURCE YOUR PRODUCT
- TOP PRODUCING COUNTRIES
- TOP EXPORTING COUNTRIES
- LOW-COST EXPORTING COUNTRIES
-
6. MOST PROMISING OVERSEAS MARKETS
Choosing the Best Countries to Boost Your Exports
This Chapter is Available Only for the Professional Edition PRO- TOP OVERSEAS MARKETS FOR EXPORTING YOUR PRODUCT
- TOP CONSUMING MARKETS
- UNSATURATED MARKETS
- TOP IMPORTING MARKETS
- MOST PROFITABLE MARKETS
7. PRODUCTION
The Latest Trends and Insights into The Industry
- PRODUCTION VOLUME AND VALUE
8. IMPORTS
The Largest Import Supplying Countries
- IMPORTS FROM 2012–2023
- IMPORTS BY COUNTRY
- IMPORT PRICES BY COUNTRY
9. EXPORTS
The Largest Destinations for Exports
- EXPORTS FROM 2012–2023
- EXPORTS BY COUNTRY
- EXPORT PRICES BY COUNTRY
-
10. PROFILES OF MAJOR PRODUCERS
The Largest Producers on The Market and Their Profiles
This Chapter is Available Only for the Professional Edition PRO -
LIST OF TABLES
- Key Findings In 2023
- Market Volume, In Physical Terms, 2012–2023
- Market Value, 2012–2023
- Per Capita Consumption In 2012-2023
- Imports, In Physical Terms, By Country, 2012–2023
- Imports, In Value Terms, By Country, 2012–2023
- Import Prices, By Country Of Origin, 2012–2023
- Exports, In Physical Terms, By Country, 2012–2023
- Exports, In Value Terms, By Country, 2012–2023
- Export Prices, By Country Of Destination, 2012–2023
-
LIST OF FIGURES
- Market Volume, In Physical Terms, 2012–2023
- Market Value, 2012–2023
- Market Structure – Domestic Supply vs. Imports, In Physical Terms, 2012-2023
- Market Structure – Domestic Supply vs. Imports, In Value Terms, 2012-2023
- Trade Balance, In Physical Terms, 2012-2023
- Trade Balance, In Value Terms, 2012-2023
- Per Capita Consumption, 2012-2023
- Market Volume Forecast to 2030
- Market Value Forecast to 2030
- Products: Market Size And Growth, By Type
- Products: Average Per Capita Consumption, By Type
- Products: Exports And Growth, By Type
- Products: Export Prices And Growth, By Type
- Production Volume And Growth
- Exports And Growth
- Export Prices And Growth
- Market Size And Growth
- Per Capita Consumption
- Imports And Growth
- Import Prices
- Production, In Physical Terms, 2012–2023
- Production, In Value Terms, 2012–2023
- Imports, In Physical Terms, 2012–2023
- Imports, In Value Terms, 2012–2023
- Imports, In Physical Terms, By Country, 2023
- Imports, In Physical Terms, By Country, 2012–2023
- Imports, In Value Terms, By Country, 2012–2023
- Import Prices, By Country Of Origin, 2012–2023
- Exports, In Physical Terms, 2012–2023
- Exports, In Value Terms, 2012–2023
- Exports, In Physical Terms, By Country, 2023
- Exports, In Physical Terms, By Country, 2012–2023
- Exports, In Value Terms, By Country, 2012–2023
- Export Prices, By Country Of Destination, 2012–2023


