World - Lemons And Limes - Market Analysis, Forecast, Size, Trends and Insights
Get instant access to more than 2 million reports, dashboards, and datasets on the IndexBox Platform.
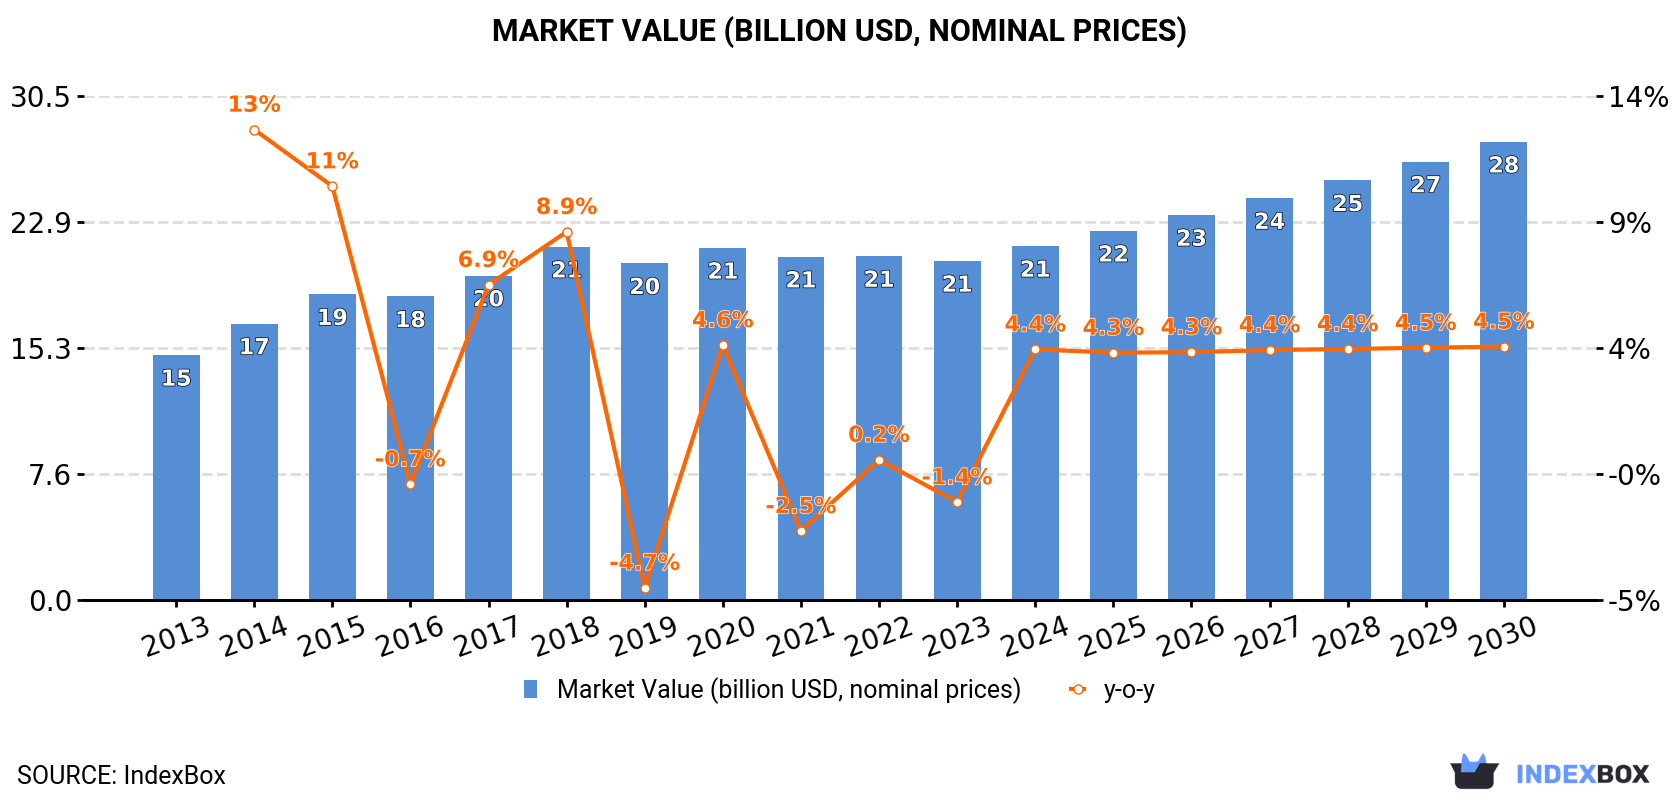
View PricingGlobal Lemons and Limes Market to Reach $27.7B by 2030, with a CAGR of +4.4%
IndexBox has just published a new report: World - Lemons And Limes - Market Analysis, Forecast, Size, Trends and Insights.
The global lemon and lime market is expected to show positive growth in both consumption and production over the next seven years. The article provides detailed insights into consumption, production, import, and export trends from 2013 to 2023, highlighting key countries and their growth rates in the market.
Market Forecast
Driven by increasing demand for lemons and limes worldwide, the market is expected to continue an upward consumption trend over the next seven-year period. Market performance is forecast to retain its current trend pattern, expanding with an anticipated CAGR of +2.4% for the period from 2023 to 2030, which is projected to bring the market volume to 25M tons by the end of 2030.
In value terms, the market is forecast to increase with an anticipated CAGR of +4.4% for the period from 2023 to 2030, which is projected to bring the market value to $27.7B (in nominal prices) by the end of 2030.
Consumption
World Consumption of Lemons And Limes
In 2023, after ten years of growth, there was decline in consumption of lemons and limes, when its volume decreased by -1.7% to 21M tons. The total consumption volume increased at an average annual rate of +3.2% from 2013 to 2023; however, the trend pattern indicated some noticeable fluctuations being recorded in certain years. Over the period under review, global consumption hit record highs at 21M tons in 2022, and then fell modestly in the following year.
The global lemon and lime market size fell modestly to $20.5B in 2023, almost unchanged from the previous year. This figure reflects the total revenues of producers and importers (excluding logistics costs, retail marketing costs, and retailers' margins, which will be included in the final consumer price). The market value increased at an average annual rate of +3.3% over the period from 2013 to 2023; however, the trend pattern indicated some noticeable fluctuations being recorded throughout the analyzed period. Over the period under review, the global market reached the peak level at $21.4B in 2018; however, from 2019 to 2023, consumption remained at a lower figure.
Consumption By Country
The countries with the highest volumes of consumption in 2023 were India (3.7M tons), China (2.5M tons) and Mexico (2.4M tons), together accounting for 41% of global consumption. Argentina, Brazil, the United States, Turkey, Italy, Iran, Spain and Sudan lagged somewhat behind, together comprising a further 33%.
From 2013 to 2023, the biggest increases were recorded for Turkey (with a CAGR of +7.1%), while consumption for the other global leaders experienced more modest paces of growth.
In value terms, China ($4.1B), Mexico ($2.2B) and the United States ($2.1B) appeared to be the countries with the highest levels of market value in 2023, together accounting for 41% of the global market.
In terms of the main consuming countries, Mexico, with a CAGR of +8.2%, recorded the highest rates of growth with regard to market size over the period under review, while market for the other global leaders experienced more modest paces of growth.
In 2023, the highest levels of lemon and lime per capita consumption was registered in Argentina (37 kg per person), followed by Mexico (18 kg per person), Italy (8.8 kg per person) and Spain (8.3 kg per person), while the world average per capita consumption of lemon and lime was estimated at 2.7 kg per person.
In Argentina, lemon and lime per capita consumption expanded at an average annual rate of +2.5% over the period from 2013-2023. The remaining consuming countries recorded the following average annual rates of per capita consumption growth: Mexico (+2.9% per year) and Italy (+3.3% per year).
Production
World Production of Lemons And Limes
After ten years of growth, production of lemons and limes decreased by -1.2% to 21M tons in 2023. The total output volume increased at an average annual rate of +3.2% from 2013 to 2023; however, the trend pattern indicated some noticeable fluctuations being recorded throughout the analyzed period. The most prominent rate of growth was recorded in 2018 with an increase of 11%. Over the period under review, global production reached the maximum volume at 22M tons in 2022, and then reduced modestly in the following year. The general positive trend in terms output was largely conditioned by a noticeable expansion of the harvested area and a relatively flat trend pattern in yield figures.
In value terms, lemon and lime production fell slightly to $20.4B in 2023 estimated in export price. The total output value increased at an average annual rate of +3.7% from 2013 to 2023; however, the trend pattern indicated some noticeable fluctuations being recorded in certain years. The pace of growth appeared the most rapid in 2014 when the production volume increased by 20% against the previous year. Over the period under review, global production hit record highs at $22B in 2018; however, from 2019 to 2023, production remained at a lower figure.
Production By Country
The countries with the highest volumes of production in 2023 were India (3.7M tons), Mexico (3M tons) and China (2.6M tons), with a combined 43% share of global production. Argentina, Brazil, Turkey, Spain, the United States, South Africa, Iran, Italy and Sudan lagged somewhat behind, together accounting for a further 41%.
From 2013 to 2023, the most notable rate of growth in terms of production, amongst the leading producing countries, was attained by South Africa (with a CAGR of +10.8%), while production for the other global leaders experienced more modest paces of growth.
Yield
In 2023, the global average yield of lemons and limes amounted to 16 tons per ha, stabilizing at the previous year. Over the period under review, the yield continues to indicate a relatively flat trend pattern. The most prominent rate of growth was recorded in 2018 when the yield increased by 5.6% against the previous year. As a result, the yield attained the peak level of 17 tons per ha. From 2019 to 2023, the growth of the average lemon and lime yield failed to regain momentum.
Harvested Area
The global lemon and lime harvested area reduced slightly to 1.3M ha in 2023, with a decrease of -1.7% against 2022. The harvested area increased at an average annual rate of +2.7% from 2013 to 2023; the trend pattern remained consistent, with somewhat noticeable fluctuations being recorded throughout the analyzed period. The growth pace was the most rapid in 2018 when the harvested area increased by 5.4%. Over the period under review, the harvested area dedicated to lemon and lime production reached the maximum at 1.3M ha in 2022, and then declined modestly in the following year.
Imports
World Imports of Lemons And Limes
In 2023, overseas purchases of lemons and limes decreased by -4.9% to 3.6M tons, falling for the second year in a row after nine years of growth. The total import volume increased at an average annual rate of +3.6% over the period from 2013 to 2023; however, the trend pattern indicated some noticeable fluctuations being recorded in certain years. The pace of growth was the most pronounced in 2015 with an increase of 12%. Over the period under review, global imports reached the maximum at 4M tons in 2021; however, from 2022 to 2023, imports stood at a somewhat lower figure.
In value terms, lemon and lime imports reduced to $4B in 2023. The total import value increased at an average annual rate of +4.4% from 2013 to 2023; however, the trend pattern indicated some noticeable fluctuations being recorded throughout the analyzed period. The pace of growth appeared the most rapid in 2016 with an increase of 22%. Global imports peaked at $4.2B in 2020; however, from 2021 to 2023, imports stood at a somewhat lower figure.
Imports By Country
In 2023, the United States (575K tons), distantly followed by the Netherlands (325K tons), Russia (247K tons), Germany (225K tons) and Iraq (211K tons) were the largest importers of lemons and limes, together constituting 44% of total imports. France (160K tons), the UK (149K tons), Poland (138K tons), the United Arab Emirates (116K tons), Canada (112K tons), Italy (99K tons), Spain (68K tons) and Saudi Arabia (66K tons) held a minor share of total imports.
From 2013 to 2023, the biggest increases were recorded for Iraq (with a CAGR of +39.4%), while purchases for the other global leaders experienced more modest paces of growth.
In value terms, the United States ($643M), the Netherlands ($417M) and Germany ($413M) appeared to be the countries with the highest levels of imports in 2023, with a combined 37% share of global imports. France, the UK, Poland, Russia, Canada, Italy, Spain, the United Arab Emirates, Iraq and Saudi Arabia lagged somewhat behind, together comprising a further 33%.
Iraq, with a CAGR of +30.4%, recorded the highest growth rate of the value of imports, in terms of the main importing countries over the period under review, while purchases for the other global leaders experienced more modest paces of growth.
Import Prices By Country
The average lemon and lime import price stood at $1,124 per ton in 2023, surging by 2.3% against the previous year. Overall, the import price recorded a relatively flat trend pattern. The growth pace was the most rapid in 2016 an increase of 17%. As a result, import price reached the peak level of $1,246 per ton. From 2017 to 2023, the average import prices remained at a somewhat lower figure.
There were significant differences in the average prices amongst the major importing countries. In 2023, amid the top importers, the country with the highest price was Germany ($1,835 per ton), while Iraq ($337 per ton) was amongst the lowest.
From 2013 to 2023, the most notable rate of growth in terms of prices was attained by the United States (+6.7%), while the other global leaders experienced more modest paces of growth.
Exports
World Exports of Lemons And Limes
In 2023, shipments abroad of lemons and limes decreased by -1.8% to 3.9M tons, falling for the second year in a row after six years of growth. Over the period under review, total exports indicated a noticeable expansion from 2013 to 2023: its volume increased at an average annual rate of +3.7% over the last decade. The trend pattern, however, indicated some noticeable fluctuations being recorded throughout the analyzed period. Based on 2023 figures, exports decreased by -3.8% against 2021 indices. The pace of growth was the most pronounced in 2021 with an increase of 13% against the previous year. As a result, the exports attained the peak of 4M tons. From 2022 to 2023, the growth of the global exports remained at a lower figure.
In value terms, lemon and lime exports expanded slightly to $4B in 2023. The total export value increased at an average annual rate of +5.0% from 2013 to 2023; however, the trend pattern indicated some noticeable fluctuations being recorded in certain years. The pace of growth appeared the most rapid in 2016 with an increase of 24%. The global exports peaked in 2023 and are expected to retain growth in years to come.
Exports By Country
In 2023, Turkey (660K tons), Mexico (644K tons), Spain (615K tons) and South Africa (565K tons) was the key exporter of lemons and limes in the world, generating 64% of total export. The Netherlands (250K tons) took a 6.5% share (based on physical terms) of total exports, which put it in second place, followed by Argentina (5.6%). The following exporters - Brazil (167K tons), the United States (110K tons) and Vietnam (60K tons) - together made up 8.7% of total exports.
From 2013 to 2023, the most notable rate of growth in terms of shipments, amongst the main exporting countries, was attained by Vietnam (with a CAGR of +31.9%), while the other global leaders experienced more modest paces of growth.
In value terms, Spain ($894M), Mexico ($723M) and the Netherlands ($446M) appeared to be the countries with the highest levels of exports in 2023, together accounting for 52% of global exports. South Africa, Turkey, the United States, Brazil, Argentina and Vietnam lagged somewhat behind, together comprising a further 32%.
Among the main exporting countries, Vietnam, with a CAGR of +28.6%, saw the highest growth rate of the value of exports, over the period under review, while shipments for the other global leaders experienced more modest paces of growth.
Export Prices By Country
The average lemon and lime export price stood at $1,033 per ton in 2023, surging by 4% against the previous year. Over the last decade, it increased at an average annual rate of +1.3%. The pace of growth was the most pronounced in 2014 an increase of 17%. Over the period under review, the average export prices attained the maximum at $1,235 per ton in 2016; however, from 2017 to 2023, the export prices failed to regain momentum.
There were significant differences in the average prices amongst the major exporting countries. In 2023, amid the top suppliers, the country with the highest price was the Netherlands ($1,783 per ton), while Turkey ($544 per ton) was amongst the lowest.
From 2013 to 2023, the most notable rate of growth in terms of prices was attained by Mexico (+8.0%), while the other global leaders experienced more modest paces of growth.
This report provides an in-depth analysis of the global lemon and lime market. Within it, you will discover the latest data on market trends and opportunities by country, consumption, production and price developments, as well as the global trade (imports and exports). The forecast exhibits the market prospects through 2030.
Product coverage:
- FCL 497 - Lemons and limes
Country coverage:
Worldwide - the report contains statistical data for 200 countries and includes detailed profiles of the 50 largest consuming countries:
- USA
- China
- Japan
- Germany
- United Kingdom
- France
- Brazil
- Italy
- Russian Federation
- India
- Canada
- Australia
- Republic of Korea
- Spain
- Mexico
- Indonesia
- Netherlands
- Turkey
- Saudi Arabia
- Switzerland
- Sweden
- Nigeria
- Poland
- Belgium
- Argentina
- Norway
- Austria
- Thailand
- United Arab Emirates
- Colombia
- Denmark
- South Africa
- Malaysia
- Israel
- Singapore
- Egypt
- Philippines
- Finland
- Chile
- Ireland
- Pakistan
- Greece
- Portugal
- Kazakhstan
- Algeria
- Czech Republic
- Qatar
- Peru
- Romania
- Vietnam
+ the largest producing countries
Data coverage:
- Global market volume and value
- Per Capita consumption
- Forecast of the market dynamics in the medium term
- Global production, split by region and country
- Global trade (exports and imports)
- Export and import prices
- Market trends, drivers and restraints
- Key market players and their profiles
Reasons to buy this report:
- Take advantage of the latest data
- Find deeper insights into current market developments
- Discover vital success factors affecting the market
This report is designed for manufacturers, distributors, importers, and wholesalers, as well as for investors, consultants and advisors.
In this report, you can find information that helps you to make informed decisions on the following issues:
- How to diversify your business and benefit from new market opportunities
- How to load your idle production capacity
- How to boost your sales on overseas markets
- How to increase your profit margins
- How to make your supply chain more sustainable
- How to reduce your production and supply chain costs
- How to outsource production to other countries
- How to prepare your business for global expansion
While doing this research, we combine the accumulated expertise of our analysts and the capabilities of artificial intelligence. The AI-based platform, developed by our data scientists, constitutes the key working tool for business analysts, empowering them to discover deep insights and ideas from the marketing data.
-
1. INTRODUCTION
Making Data-Driven Decisions to Grow Your Business
- REPORT DESCRIPTION
- RESEARCH METHODOLOGY AND AI PLATFORM
- DATA-DRIVEN DECISIONS FOR YOUR BUSINESS
- GLOSSARY AND SPECIFIC TERMS
-
2. EXECUTIVE SUMMARY
A Quick Overview of Market Performance
- KEY FINDINGS
- MARKET TRENDS This Chapter is Available Only for the Professional Edition PRO
-
3. MARKET OVERVIEW
Understanding the Current State of The Market and Its Prospects
- MARKET SIZE
- CONSUMPTION BY COUNTRY
- MARKET FORECAST TO 2030
-
4. MOST PROMISING PRODUCT
Finding New Products to Diversify Your Business
This Chapter is Available Only for the Professional Edition PRO- TOP PRODUCTS TO DIVERSIFY YOUR BUSINESS
- BEST-SELLING PRODUCTS
- MOST CONSUMED PRODUCT
- MOST TRADED PRODUCT
- MOST PROFITABLE PRODUCT FOR EXPORT
-
5. MOST PROMISING SUPPLYING COUNTRIES
Choosing the Best Countries to Establish Your Sustainable Supply Chain
This Chapter is Available Only for the Professional Edition PRO- TOP COUNTRIES TO SOURCE YOUR PRODUCT
- TOP PRODUCING COUNTRIES
- COUNTRIES WITH TOP YIELDS
- TOP EXPORTING COUNTRIES
- LOW-COST EXPORTING COUNTRIES
-
6. MOST PROMISING OVERSEAS MARKETS
Choosing the Best Countries to Boost Your Exports
This Chapter is Available Only for the Professional Edition PRO- TOP OVERSEAS MARKETS FOR EXPORTING YOUR PRODUCT
- TOP CONSUMING MARKETS
- UNSATURATED MARKETS
- TOP IMPORTING MARKETS
- MOST PROFITABLE MARKETS
7. GLOBAL PRODUCTION
The Latest Trends and Insights into The Industry
- PRODUCTION VOLUME AND VALUE
- PRODUCTION BY COUNTRY
- HARVESTED AREA AND YIELD BY COUNTRY
8. GLOBAL IMPORTS
The Largest Importers on The Market and How They Succeed
- IMPORTS FROM 2012–2023
- IMPORTS BY COUNTRY
- IMPORT PRICES BY COUNTRY
9. GLOBAL EXPORTS
The Largest Exporters on The Market and How They Succeed
- EXPORTS FROM 2012–2023
- EXPORTS BY COUNTRY
- EXPORT PRICES BY COUNTRY
-
10. PROFILES OF MAJOR PRODUCERS
The Largest Producers on The Market and Their Profiles
This Chapter is Available Only for the Professional Edition PRO -
11. COUNTRY PROFILES
The Largest Markets And Their Profiles
This Chapter is Available Only for the Professional Edition PRO- United States
- China
- Japan
- Germany
- United Kingdom
- France
- Brazil
- Italy
- Russian Federation
- India
- Canada
- Australia
- Republic of Korea
- Spain
- Mexico
- Indonesia
- Netherlands
- Turkey
- Saudi Arabia
- Switzerland
- Sweden
- Nigeria
- Poland
- Belgium
- Argentina
- Norway
- Austria
- Thailand
- United Arab Emirates
- Colombia
- Denmark
- South Africa
- Malaysia
- Israel
- Singapore
- Egypt
- Philippines
- Finland
- Chile
- Ireland
- Pakistan
- Greece
- Portugal
- Kazakhstan
- Algeria
- Czech Republic
- Qatar
- Peru
- Romania
- Vietnam
-
LIST OF TABLES
- Key Findings In 2023
- Market Volume, In Physical Terms, 2012–2023
- Market Value, 2012–2023
- Per Capita Consumption, By Country, 2018–2023
- Production, In Physical Terms, By Country, 2012–2023
- Harvested Area, By Country, 2012-2023
- Yield, By Country, 2012-2023
- Imports, In Physical Terms, By Country, 2012–2023
- Imports, In Value Terms, By Country, 2012–2023
- Import Prices, By Country Of Destination, 2012–2023
- Exports, In Physical Terms, By Country, 2012–2023
- Exports, In Value Terms, By Country, 2012–2023
- Export Prices, By Country Of Origin, 2012–2023
-
LIST OF FIGURES
- Market Volume, In Physical Terms, 2012–2023
- Market Value, 2012–2023
- Consumption, By Country, 2023
- Market Volume Forecast to 2030
- Market Value Forecast to 2030
- Products: Market Size And Growth, By Type
- Products: Average Per Capita Consumption, By Type
- Products: Exports And Growth, By Type
- Products: Export Prices And Growth, By Type
- Production Volume And Growth
- Yield And Growth
- Exports And Growth
- Export Prices And Growth
- Market Size And Growth
- Per Capita Consumption
- Imports And Growth
- Import Prices
- Production, In Physical Terms, 2012–2023
- Production, In Value Terms, 2012–2023
- Area Harvested, 2012–2023
- Yield, 2012–2023
- Production, By Country, 2023
- Production, In Physical Terms, By Country, 2012–2023
- Harvested Area, By Country, 2023
- Harvested Area, By Country, 2012-2023
- Yield, By Country, 2012-2023
- Imports, In Physical Terms, 2012–2023
- Imports, In Value Terms, 2012–2023
- Imports, In Physical Terms, By Country, 2023
- Imports, In Physical Terms, By Country, 2012–2023
- Imports, In Value Terms, By Country, 2012–2023
- Import Prices, By Country, 2012–2023
- Exports, In Physical Terms, 2012–2023
- Exports, In Value Terms, 2012–2023
- Exports, In Physical Terms, By Country, 2023
- Exports, In Physical Terms, By Country, 2012–2023
- Exports, In Value Terms, By Country, 2012–2023
- Export Prices, 2012–2023


