Report World Dielectric-Dried Feeds - Market Analysis, Forecast, Size, Trends and Insights for 499$
Report Update Mar 15, 2026

World Dielectric-Dried Feeds - Market Analysis, Forecast, Size, Trends and Insights

Common to all licenses: PDF report + Excel data package, delivery by email attachments, content copy-paste enabled, printable format, and one clarification round after delivery.

World Dielectric-Dried Feeds Market 2026 Analysis and Forecast to 2035

Executive Summary

The global market for dielectric-dried feeds represents a critical and technologically advanced segment within the broader animal nutrition and feed processing industry. This report provides a comprehensive analysis of the market's current state as of 2026, projecting trends and dynamics through to 2035. The sector is characterized by its reliance on specialized dielectric (RF) drying technology, which offers distinct advantages in preserving nutrient integrity and enhancing feed safety compared to conventional thermal drying methods. Understanding the interplay between technological adoption, regional production shifts, and evolving end-user demand is paramount for stakeholders navigating this space.

Growth is fundamentally underpinned by the global intensification of livestock production and the escalating demand for high-quality, safe, and traceable animal protein. The dielectric drying process, by effectively controlling pathogens like Salmonella and maintaining higher levels of heat-sensitive nutrients, aligns perfectly with these industry imperatives. While established markets demonstrate steady demand driven by regulatory and quality standards, emerging regions present significant growth opportunities linked to modernization of their agricultural sectors.

This analysis concludes that the market is on a trajectory of steady expansion, though its path is influenced by capital investment cycles, raw material input volatility, and competitive pressure from alternative feed processing technologies. Strategic positioning will require a deep understanding of regional supply chains, cost structures, and the evolving regulatory landscape governing feed safety. The forecast to 2035 anticipates a gradual increase in market penetration for dielectric-dried feeds, particularly in premium feed segments and regions prioritizing biosecurity.

Market Overview

The world dielectric-dried feeds market is defined by the application of radio frequency (RF) or microwave energy to reduce moisture content in animal feed ingredients and complete rations. This method provides precise, volumetric heating, leading to efficient drying with less thermal degradation of proteins, vitamins, and enzymes than traditional drum or spray drying. The market encompasses both the production facilities utilizing this technology and the downstream distribution of the resultant high-value feed products to integrated livestock operations, commercial feed mills, and specialty nutrition companies.

As of the 2026 analysis period, the market remains a specialized niche within the global animal feed industry, which is measured in billions of tons annually. The penetration of dielectric drying is highest in segments where feed safety and nutrient preservation command a significant premium. These include starter feeds for young animals like piglets and calves, pet food ingredients, and specific aquafeed formulations. The geographical distribution of production is closely tied to regions with advanced livestock sectors and stringent feed safety regulations.

The market structure involves a mix of large, integrated agribusinesses that have adopted dielectric drying for in-house feed production and specialized independent processors that serve a broader merchant market. The scale of individual dielectric drying installations varies, but they typically represent a substantial capital investment, creating a certain barrier to entry and influencing the concentration of production capacity. The market's evolution is thus not only a function of demand but also of technological cost-effectiveness and operational scalability.

Demand Drivers and End-Use

Demand for dielectric-dried feeds is propelled by a confluence of structural, regulatory, and consumer-led trends shaping the global animal protein value chain. The primary driver is the relentless growth in global demand for meat, milk, and eggs, necessitating more efficient and intensive livestock production systems. In such systems, feed quality and safety transition from being a cost factor to a critical performance determinant, directly impacting animal growth rates, feed conversion ratios, and overall herd health.

Stringent biosecurity and feed safety regulations, particularly in developed economies, form a powerful regulatory driver. Mandates to control pathogenic contamination in feed, such as Salmonella and E. coli, have made the pasteurization effect of dielectric drying highly attractive. This "kill-step" provides a measurable reduction in microbial load, de-risking the feed supply chain for integrated producers and meeting compliance standards for international trade in livestock products.

Consumer awareness and preferences indirectly stimulate demand. The growing consumer interest in animal welfare, antibiotic-free production, and clean-label food products pressures producers to optimize animal health from the earliest stages. Dielectric-dried feeds, with their superior nutrient availability and safety profile, are increasingly positioned as a foundational tool for achieving these production goals, especially in vulnerable early-life animal nutrition.

The key end-use sectors can be enumerated as follows:

  • Swine Feed: Particularly for pre-starter and starter diets where digestibility and pathogen control are paramount for piglet health and growth uniformity.
  • Poultry Feed: Used in broiler and turkey starter rations, and in layer feeds to ensure consistent egg production and shell quality through improved nutrient uptake.
  • Ruminant Feed: Applied in milk replacers and calf starters, where preserving the quality of protein sources like whey and soy is critical.
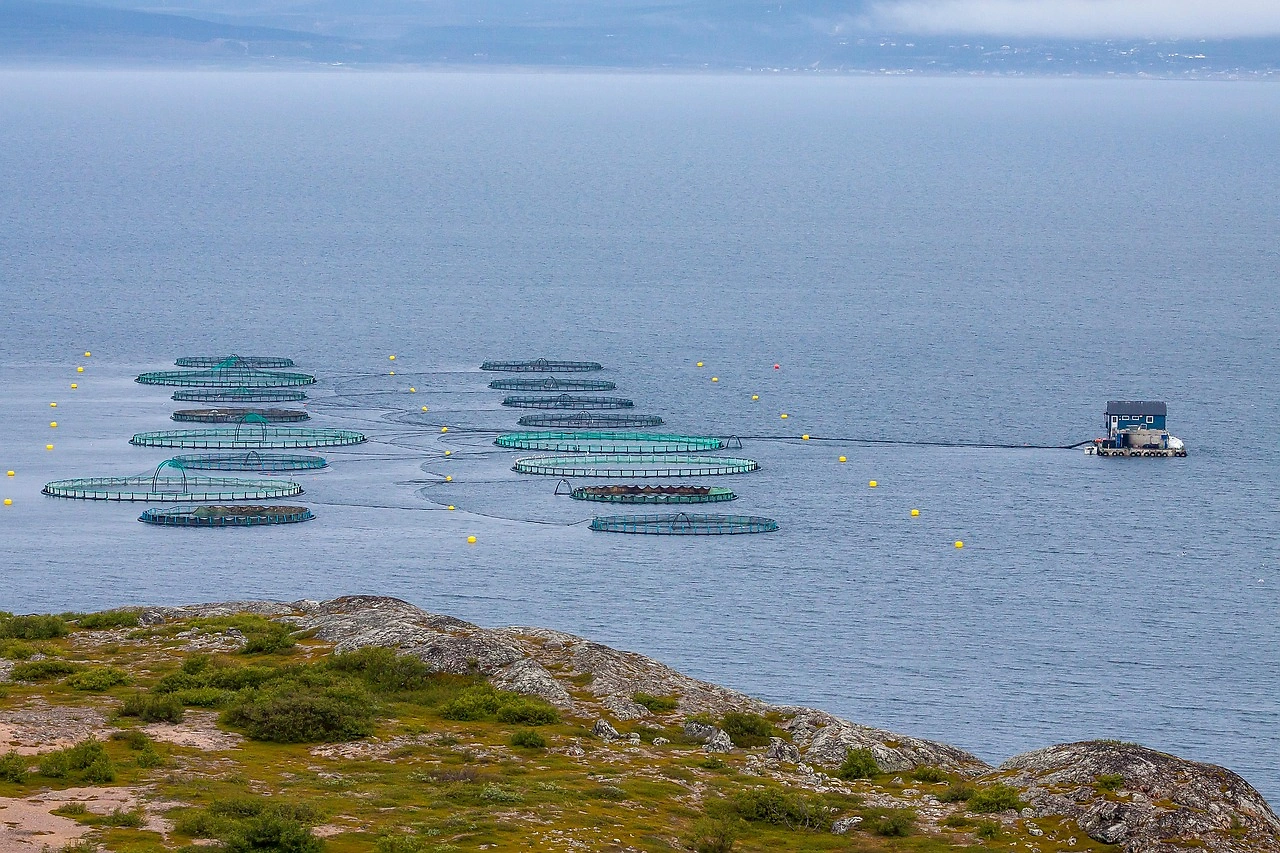
  • Aquafeed: For high-value species where feed stability in water and nutrient retention are essential.
  • Pet Food: As a high-quality ingredient in premium and veterinary diet formulations, leveraging the enhanced palatability and safety.

Supply and Production

The supply landscape for dielectric-dried feeds is intrinsically linked to the geographical distribution of advanced livestock production and the capital availability for feed mill modernization. Production is not uniformly distributed but clustered in regions where the economic calculus of investing in dielectric technology is favorable. This calculus weighs the higher operational and capital costs against the achieved premium for feed safety, improved animal performance, and compliance savings.

Major production hubs as of 2026 are predominantly located in North America and Western Europe. These regions benefit from large-scale, consolidated livestock operations, robust regulatory frameworks mandating feed safety, and the financial capacity to invest in advanced processing infrastructure. Facilities in these regions often serve both domestic markets and export high-value specialty feed ingredients globally. Production is typically located in proximity to key raw material processing sites, such as oilseed crushing plants or dairy processing facilities, to minimize logistics costs for wet intermediates.

The production process involves several key stages: receiving and preparing raw materials (often in a mash or slurry form), conveying them through the dielectric (RF) drying unit where moisture is rapidly evaporated under controlled conditions, and then cooling and packaging the finished product. The efficiency and output of a plant are determined by the capacity of the drying system, the moisture removal requirements, and the energy efficiency of the technology. Ongoing innovation focuses on improving energy utilization, scaling system capacity, and integrating dielectric drying more seamlessly into continuous feed manufacturing lines.

Supply chain vulnerabilities exist, primarily related to the volatility and availability of primary raw materials such as grains, oilseed meals, and dairy by-products. Fluctuations in the price and quality of these inputs directly impact the cost structure and margin stability of dielectric-dried feed producers. Furthermore, the specialized nature of the equipment means that maintenance and technical expertise are critical for sustained operation, adding another layer of complexity to the supply function.

Trade and Logistics

International trade in dielectric-dried feeds is a significant component of the market, though it represents a specialized flow within the larger global feed ingredient trade. Traded products are typically high-value, low-moisture ingredients or complete feeds with specific nutritional and safety certifications. The trade dynamics are influenced by regional deficits in production capability, specific nutritional requirements for local livestock sectors, and the pursuit of biosecure supply chains by importing countries.

Major export flows originate from the established production clusters in North America and the European Union. These regions export technology-intensive feed products, such as specific protein concentrates, milk replacer ingredients, and specialty pediatric feeds, to markets in Asia, Latin America, and other regions where domestic dielectric drying capacity is still developing. The value-to-weight ratio of these products makes them more amenable to long-distance transportation compared to bulk commodities.

Logistics for dielectric-dried feeds require careful management to protect product quality. While the low moisture content inhibits microbial growth during transit, the products can still be sensitive to humidity, contamination, and physical degradation. Therefore, shipping is often done in sealed containers or specialized bulk bags, with a strong emphasis on clean, dedicated handling equipment to prevent cross-contamination. This adds a premium to logistics costs but is essential to preserve the value proposition of the product.

Trade policies and sanitary regulations are pivotal. Importing countries may have strict phytosanitary and veterinary requirements for feed ingredients. The documented pathogen reduction achieved through dielectric drying can serve as a key compliance advantage, facilitating market access. However, non-tariff barriers, certification complexities, and evolving regulatory standards in different countries can create challenges and necessitate close regulatory affairs management by exporting entities.

Price Dynamics

The pricing of dielectric-dried feeds is fundamentally premium-based, reflecting the added value of the processing technology over conventionally dried alternatives. The price premium is justified by several quantifiable and perceived benefits: enhanced nutrient bioavailability, verified pathogen reduction, improved feed consistency, and potential reductions in veterinary costs or performance enhancers downstream. This premium is most sustainable in market segments where these benefits translate directly into economic value for the livestock producer, such as in early animal nutrition.

Price formation is a function of a multi-layered cost structure. The primary cost driver is the price of raw feed materials, which is subject to global commodity market fluctuations. On top of this, dielectric drying adds significant processing costs, dominated by capital depreciation for the specialized equipment and energy consumption. While dielectric drying can be more thermally efficient than some conventional methods, the cost of electricity remains a critical variable input. Operational costs, including maintenance, skilled labor, and quality control, further contribute to the final price.

Price elasticity varies significantly by end-use segment and region. In cost-sensitive, large-volume commodity feed markets, the premium for dielectric-dried products may limit penetration. Conversely, in premium segments like pet food, aquaculture, or specialty livestock starters, buyers demonstrate lower price sensitivity and higher valuation of the quality and safety assurances. Regional differences in energy costs, environmental regulations, and feed safety standards also create divergent price levels and competitive landscapes across global markets.

Competitive pressure from alternative feed processing technologies, such as expanded extrusion or newer thermal techniques with improved efficiency, acts as a moderating force on price premiums. Over the forecast period to 2035, the evolution of dielectric drying technology towards greater energy efficiency and lower capital cost per ton of capacity will be a key determinant in its ability to maintain or expand its value-based pricing model against these alternatives.

Competitive Landscape

The competitive environment in the dielectric-dried feeds market is characterized by a blend of large, diversified agribusiness giants and smaller, technology-focused specialty operators. The landscape is moderately concentrated, with significant barriers to entry related to technology know-how, capital investment, and established customer relationships in the quality-conscious feed segment. Competition occurs on multiple fronts: product quality and consistency, technical service and nutritional support, supply chain reliability, and increasingly, sustainability credentials.

Leading players often have vertically integrated operations or strong strategic alliances. These can include:

  • Major global animal nutrition companies that have invested in dielectric drying as part of their specialty product portfolio.
  • Large integrated livestock producers that operate captive dielectric drying facilities to secure their own supply of high-safety feed.
  • Independent specialty ingredient processors that focus exclusively on advanced feed processing technologies and serve a broad merchant market.

Strategic activities within the competitive landscape are focused on several key areas. Research and development is directed at optimizing drying processes for different raw materials, improving energy efficiency, and developing new feed formulations that maximize the benefits of the technology. Geographic expansion into high-growth emerging markets, often through partnerships or joint ventures, is a common strategy to capture new demand. Furthermore, companies compete by providing comprehensive nutritional technical services to help customers fully realize the performance benefits of the feeds, thereby solidifying customer loyalty.

The role of technology suppliers is also crucial. Companies that manufacture and sell dielectric drying systems to feed millers influence the market's expansion by advancing the technology's capabilities and economics. Their success in demonstrating a clear return on investment for feed millers directly affects the adoption rate and, consequently, the competitive dynamics among feed producers themselves.

Methodology and Data Notes

This report on the World Dielectric-Dried Feeds Market has been developed using a rigorous, multi-method research methodology designed to ensure analytical robustness and actionable insight. The core approach integrates quantitative data analysis, qualitative expert assessment, and thorough secondary source verification to construct a holistic view of the market from 2026 forward, with projections to 2035.

The quantitative analysis is built upon a foundation of industry data, including production statistics, trade flows, and capacity information. This data is sourced from official national and international statistical bodies, industry association reports, and customs trade databases. Where direct data on dielectric-dried feeds is limited due to its niche classification, our analysis employs a triangulation method, using proxy indicators from related feed categories, technology shipment data, and energy consumption patterns in the feed sector to estimate market size and growth trajectories.

Qualitative insights are garnered through a structured engagement process with industry participants across the value chain. This includes interviews and surveys with feed producers, dielectric technology engineers, livestock nutritionists, procurement executives at integrated farming operations, and trade logistics specialists. These primary inputs are essential for understanding the nuanced drivers of adoption, pricing strategies, operational challenges, and regional market specifics that pure quantitative data cannot reveal.

The forecasting model to 2035 is scenario-based, incorporating assumptions on macroeconomic conditions, livestock production trends, feed safety regulatory developments, and technological advancement rates. It is critical to note that while the report provides a detailed forecast of trends, market structure evolution, and competitive dynamics, it does not invent new absolute market size figures beyond the base year analysis. All forward-looking statements are derived from the extrapolation of verified data points and the assessment of causal relationships within the market system. All inferred growth rates, market shares, and rankings are clearly presented as analytical estimates based on the available data and stated methodological principles.

Outlook and Implications

The outlook for the world dielectric-dried feeds market from 2026 to 2035 is one of cautious but steady growth, driven by the long-term, non-cyclical trends of protein demand and feed safety prioritization. The market is expected to see an increase in adoption beyond its current core applications, gradually penetrating more standard feed categories as the total cost of ownership for the technology improves and as regulatory pressures on pathogen control become more widespread globally. This expansion will likely be nonlinear, marked by periods of accelerated investment followed by consolidation.

A key implication for industry participants is the necessity of strategic positioning along the value-creation axis. For feed producers, simply owning the technology may not be sufficient; commercial success will hinge on effectively quantifying and communicating the return on investment to livestock farmers, translating technical benefits into clear economic gains in terms of improved animal performance, reduced mortality, and lower medication costs. This requires a deep integration of nutritional expertise and data analytics into sales and service functions.

For technology providers and investors, the forecast period presents opportunities in driving down capital and operational costs, developing more modular and scalable systems suitable for mid-sized feed mills, and integrating smart sensors and IoT connectivity for process optimization and quality assurance. The market's growth will also stimulate adjacent opportunities in testing services, certification for pathogen reduction claims, and specialized logistics solutions tailored for high-integrity feed ingredients.

Geographically, the most dynamic growth is anticipated in Asia-Pacific and Latin America, where rising incomes, urbanization, and the modernization of livestock sectors are creating fertile ground for advanced feed solutions. However, success in these regions will require adapting business models to local cost structures, raw material availabilities, and distribution networks. The overarching implication for all stakeholders is that the dielectric-dried feeds market, while specialized, is becoming an increasingly strategic component of a resilient, efficient, and sustainable global animal protein system, demanding informed and proactive strategic planning.

This report provides an in-depth analysis of the Dielectric-Dried Feeds market in the World, including market size, structure, key trends, and forecast. The study highlights demand drivers, supply constraints, and competitive dynamics across the value chain.

The analysis is designed for manufacturers, distributors, investors, and advisors who require a consistent, data-driven view of market dynamics and a transparent analytical definition of the product scope.

Product Coverage

This report covers dielectric-dried feeds, a category of animal nutrition products where the drying process utilizes dielectric (e.g., radio frequency or microwave) energy. This advanced drying method is applied to various feed matrices to enhance nutrient retention, improve digestibility, and ensure microbial safety. The coverage spans products tailored for multiple animal sectors, including aquaculture, livestock, poultry, and pets.

Included

  • DIELECTRIC-DRIED MILK REPLACERS FOR YOUNG ANIMALS
  • DIELECTRIC-DRIED AQUAFEED FOR FISH AND SHRIMP
  • DIELECTRIC-DRIED COMPLETE FEEDS FOR LIVESTOCK AND POULTRY
  • DIELECTRIC-DRIED PET FOOD INGREDIENTS AND COMPLETE DIETS
  • DIELECTRIC-DRIED SPECIALTY FEEDS (E.G., FOR ZOOS, LABORATORIES)
  • FEED PRODUCTS WHERE DIELECTRIC DRYING IS A DEFINED PROCESSING STEP

Excluded

  • CONVENTIONALLY DRIED (E.G., DRUM-DRIED, SPRAY-DRIED) FEEDS
  • UNPROCESSED OR RAW FEED INGREDIENTS AND FORAGES
  • FEED ADDITIVES, PREMIXES, OR VITAMINS SOLD SEPARATELY
  • MEDICATED FEEDS OR VETERINARY PHARMACEUTICALS
  • FEED MANUFACTURING EQUIPMENT AND DRYING MACHINERY

Segmentation Framework

  • By product type / configuration: Dielectric-Dried Milk Replacer, Dielectric-Dried Fish Feed, Dielectric-Dried Pet Food, Dielectric-Dried Livestock Feed, Dielectric-Dried Aquafeed, Dielectric-Dried Specialty Feed
  • By application / end-use: Aquaculture Nutrition, Livestock Farming, Pet Food Manufacturing, Poultry Production, Dairy Calf Rearing, Specialty Animal Diets
  • By value chain position: Raw Material Sourcing, Dielectric Drying Processing, Feed Blending & Formulation, Packaging & Quality Control, Distribution to Farms & Hatcheries, Retail Pet Food Channels

Classification Coverage

Dielectric-dried feeds are primarily classified under headings for prepared animal feeds. The classification encompasses products regardless of specific animal type, provided they are manufactured and presented as complete or complementary feeds. It includes both bulk industrial inputs and packaged retail products within this defined processing category.

HS Codes (framework)

  • 230990 – Preparations of animal feed, n.e.c. (Covers other compound feeds, including dielectric-dried specialty and complete feeds)
  • 230910 – Dog or cat food, put up for retail sale (Includes dielectric-dried pet food in retail packaging)

Country Coverage

World

Data Coverage

  • Historical data: 2012–2025
  • Forecast data: 2026–2035

Units of Measure

  • Volume: tonnes
  • Value: USD
  • Prices: USD per tonne

Methodology

The analysis is built on a multi-source framework that combines official statistics, trade records, company disclosures, and expert validation. Data are standardized, reconciled, and cross-checked to ensure consistency across time series.

  • International trade data (exports, imports, and mirror statistics)
  • National production and consumption statistics
  • Company-level information from financial filings and public releases
  • Price series and unit value benchmarks
  • Analyst review, outlier checks, and time-series validation

All data are normalized to a common product definition and mapped to a consistent set of codes. This ensures that comparisons across time are aligned and actionable.

  1. 1. INTRODUCTION

    Making Data-Driven Decisions to Grow Your Business

    1. REPORT DESCRIPTION
    2. RESEARCH METHODOLOGY AND THE AI PLATFORM
    3. DATA-DRIVEN DECISIONS FOR YOUR BUSINESS
    4. GLOSSARY AND SPECIFIC TERMS
  2. 2. EXECUTIVE SUMMARY

    A Quick Overview of Market Performance

    1. KEY FINDINGS
    2. MARKET TRENDS
  3. 3. MARKET OVERVIEW

    Understanding the Current State of The Market and its Prospects

    1. MARKET SIZE: HISTORICAL DATA (2012–2025) AND FORECAST (2026–2035)
    2. CONSUMPTION BY COUNTRY: HISTORICAL DATA (2012–2025) AND FORECAST (2026–2035)
    3. MARKET FORECAST TO 2035
  4. 4. PRODUCT SCOPE & DEFINITIONS

    What Is Included and How the Market Is Defined

    1. DEFINITION OF DIELECTRIC-DRIED FEEDS
    2. INCLUSION OF HS CODES 230990 AND 230910
    3. MARKET BOUNDARIES AND EXCLUSIONS
    4. PRODUCT FORM AND SPECIFICATIONS
    5. KEY DIFFERENTIATORS FROM CONVENTIONAL DRYING
    6. ANALYTICAL FRAMEWORK FOR MARKET SIZE
  5. 5. SEGMENTATION

    How the Market Is Split into Comparable Segments

    1. SEGMENTATION BY FEED TYPE
    2. SEGMENTATION BY END-USE APPLICATION
    3. CROSS-ANALYSIS OF TYPE VS APPLICATION
    4. DEMOGRAPHIC AND OPERATIONAL SEGMENTATION
    5. GEOGRAPHIC MARKET SPLITS
    6. PRICE POINT AND QUALITY TIERS
  6. 6. SUPPLY & VALUE CHAIN

    Upstream Inputs, Manufacturing Landscape and Go-to-Market

    1. RAW MATERIAL SOURCING AND PROCUREMENT
    2. DIELECTRIC DRYING PROCESS TECHNOLOGY
    3. BLENDING AND NUTRITIONAL FORTIFICATION
    4. QUALITY ASSURANCE AND PACKAGING
    5. DISTRIBUTION LOGISTICS AND CHANNELS
    6. RETAIL AND DIRECT-TO-FARMER SALES
  7. 7. DEMAND BY SEGMENT

    End-Use Drivers and Adoption Requirements

    1. AQUACULTURE NUTRITION DEMAND DRIVERS
    2. LIVESTOCK AND POULTRY PRODUCTION NEEDS
    3. PET FOOD MANUFACTURER ADOPTION FACTORS
    4. SPECIALTY ANIMAL DIET REQUIREMENTS
    5. CALF REARING EFFICIENCY AND HEALTH
    6. COST-BENEFIT ANALYSIS BY END-USER
  8. 8. MOST PROMISING PRODUCTS FOR DIVERSIFICATION

    Finding New Products to Diversify Your Business

    1. TOP PRODUCTS TO DIVERSIFY YOUR BUSINESS
    2. BEST-SELLING PRODUCTS
    3. MOST CONSUMED PRODUCTS
    4. MOST TRADED PRODUCTS
    5. MOST PROFITABLE PRODUCTS FOR EXPORT
  9. 9. MOST PROMISING SUPPLYING COUNTRIES

    Choosing the Best Countries to Establish Your Sustainable Supply Chain

    1. TOP COUNTRIES TO SOURCE YOUR PRODUCT
    2. TOP PRODUCING COUNTRIES
    3. TOP EXPORTING COUNTRIES
    4. LOW-COST EXPORTING COUNTRIES
  10. 10. MOST PROMISING OVERSEAS MARKETS

    Choosing the Best Countries to Boost Your Export

    1. TOP OVERSEAS MARKETS FOR EXPORTING YOUR PRODUCT
    2. TOP CONSUMING MARKETS
    3. UNSATURATED MARKETS
    4. TOP IMPORTING MARKETS
    5. MOST PROFITABLE MARKETS
  11. 11. PRODUCTION

    The Latest Trends and Insights into The Industry

    1. PRODUCTION VOLUME AND VALUE: HISTORICAL DATA (2012–2025) AND FORECAST (2026–2035)
    2. PRODUCTION BY COUNTRY: HISTORICAL DATA (2012–2025) AND FORECAST (2026–2035)
  12. 12. IMPORTS

    The Largest Import Supplying Countries

    1. IMPORTS: HISTORICAL DATA (2012–2025) AND FORECAST (2026–2035)
    2. IMPORTS BY COUNTRY: HISTORICAL DATA (2012–2025) AND FORECAST (2026–2035)
    3. IMPORT PRICES BY COUNTRY: HISTORICAL DATA (2012–2025) AND FORECAST (2026–2035)
  13. 13. EXPORTS

    The Largest Destinations for Exports

    1. EXPORTS: HISTORICAL DATA (2012–2025) AND FORECAST (2026–2035)
    2. EXPORTS BY COUNTRY: HISTORICAL DATA (2012–2025) AND FORECAST (2026–2035)
    3. EXPORT PRICES BY COUNTRY: HISTORICAL DATA (2012–2025) AND FORECAST (2026–2035)
  14. 14. PROFILES OF MAJOR COMPANIES

    The Key Company Types and Market Structure

    1. RAW MATERIAL SUPPLIERS AND INGREDIENT PRODUCERS
    2. DEDICATED DIELECTRIC-DRIED FEED PROCESSORS
    3. INTEGRATED ANIMAL NUTRITION CORPORATIONS
    4. SPECIALTY FEED FORMULATORS AND BLENDERS
    5. AQUAFEED AND AQUACULTURE FOCUSED MANUFACTURERS
    6. PET FOOD BRAND OWNERS AND MARKETERS
    7. DISTRIBUTORS AND WHOLESALERS TO COMMERCIAL FARMS
    8. TECHNOLOGY PROVIDERS AND EQUIPMENT MANUFACTURERS
  15. 15. COUNTRY PROFILES

    The Largest Markets And Their Profiles

    View detailed country profiles50 countries
    1. 15.1
      United States
      • Market Size
      • Production
      • Imports
      • Exports
    2. 15.2
      China
      • Market Size
      • Production
      • Imports
      • Exports
    3. 15.3
      Japan
      • Market Size
      • Production
      • Imports
      • Exports
    4. 15.4
      Germany
      • Market Size
      • Production
      • Imports
      • Exports
    5. 15.5
      United Kingdom
      • Market Size
      • Production
      • Imports
      • Exports
    6. 15.6
      France
      • Market Size
      • Production
      • Imports
      • Exports
    7. 15.7
      Brazil
      • Market Size
      • Production
      • Imports
      • Exports
    8. 15.8
      Italy
      • Market Size
      • Production
      • Imports
      • Exports
    9. 15.9
      Russian Federation
      • Market Size
      • Production
      • Imports
      • Exports
    10. 15.10
      India
      • Market Size
      • Production
      • Imports
      • Exports
    11. 15.11
      Canada
      • Market Size
      • Production
      • Imports
      • Exports
    12. 15.12
      Australia
      • Market Size
      • Production
      • Imports
      • Exports
    13. 15.13
      Republic of Korea
      • Market Size
      • Production
      • Imports
      • Exports
    14. 15.14
      Spain
      • Market Size
      • Production
      • Imports
      • Exports
    15. 15.15
      Mexico
      • Market Size
      • Production
      • Imports
      • Exports
    16. 15.16
      Indonesia
      • Market Size
      • Production
      • Imports
      • Exports
    17. 15.17
      Netherlands
      • Market Size
      • Production
      • Imports
      • Exports
    18. 15.18
      Turkey
      • Market Size
      • Production
      • Imports
      • Exports
    19. 15.19
      Saudi Arabia
      • Market Size
      • Production
      • Imports
      • Exports
    20. 15.20
      Switzerland
      • Market Size
      • Production
      • Imports
      • Exports
    21. 15.21
      Sweden
      • Market Size
      • Production
      • Imports
      • Exports
    22. 15.22
      Nigeria
      • Market Size
      • Production
      • Imports
      • Exports
    23. 15.23
      Poland
      • Market Size
      • Production
      • Imports
      • Exports
    24. 15.24
      Belgium
      • Market Size
      • Production
      • Imports
      • Exports
    25. 15.25
      Argentina
      • Market Size
      • Production
      • Imports
      • Exports
    26. 15.26
      Norway
      • Market Size
      • Production
      • Imports
      • Exports
    27. 15.27
      Austria
      • Market Size
      • Production
      • Imports
      • Exports
    28. 15.28
      Thailand
      • Market Size
      • Production
      • Imports
      • Exports
    29. 15.29
      United Arab Emirates
      • Market Size
      • Production
      • Imports
      • Exports
    30. 15.30
      Colombia
      • Market Size
      • Production
      • Imports
      • Exports
    31. 15.31
      Denmark
      • Market Size
      • Production
      • Imports
      • Exports
    32. 15.32
      South Africa
      • Market Size
      • Production
      • Imports
      • Exports
    33. 15.33
      Malaysia
      • Market Size
      • Production
      • Imports
      • Exports
    34. 15.34
      Israel
      • Market Size
      • Production
      • Imports
      • Exports
    35. 15.35
      Singapore
      • Market Size
      • Production
      • Imports
      • Exports
    36. 15.36
      Egypt
      • Market Size
      • Production
      • Imports
      • Exports
    37. 15.37
      Philippines
      • Market Size
      • Production
      • Imports
      • Exports
    38. 15.38
      Finland
      • Market Size
      • Production
      • Imports
      • Exports
    39. 15.39
      Chile
      • Market Size
      • Production
      • Imports
      • Exports
    40. 15.40
      Ireland
      • Market Size
      • Production
      • Imports
      • Exports
    41. 15.41
      Pakistan
      • Market Size
      • Production
      • Imports
      • Exports
    42. 15.42
      Greece
      • Market Size
      • Production
      • Imports
      • Exports
    43. 15.43
      Portugal
      • Market Size
      • Production
      • Imports
      • Exports
    44. 15.44
      Kazakhstan
      • Market Size
      • Production
      • Imports
      • Exports
    45. 15.45
      Algeria
      • Market Size
      • Production
      • Imports
      • Exports
    46. 15.46
      Czech Republic
      • Market Size
      • Production
      • Imports
      • Exports
    47. 15.47
      Qatar
      • Market Size
      • Production
      • Imports
      • Exports
    48. 15.48
      Peru
      • Market Size
      • Production
      • Imports
      • Exports
    49. 15.49
      Romania
      • Market Size
      • Production
      • Imports
      • Exports
    50. 15.50
      Vietnam
      • Market Size
      • Production
      • Imports
      • Exports
  16. LIST OF TABLES

    1. Key Findings In 2025
    2. Market Volume, In Physical Terms: Historical Data (2012–2025) and Forecast (2026–2035)
    3. Market Value: Historical Data (2012–2025) and Forecast (2026–2035)
    4. Per Capita Consumption, by Country, 2023–2025
    5. Production, In Physical Terms, By Country: Historical Data (2012–2025) and Forecast (2026–2035)
    6. Imports, In Physical Terms, By Country: Historical Data (2012–2025) and Forecast (2026–2035)
    7. Imports, In Value Terms, By Country: Historical Data (2012–2025) and Forecast (2026–2035)
    8. Import Prices, By Country: Historical Data (2012–2025) and Forecast (2026–2035)
    9. Exports, In Physical Terms, By Country: Historical Data (2012–2025) and Forecast (2026–2035)
    10. Exports, In Value Terms, By Country: Historical Data (2012–2025) and Forecast (2026–2035)
    11. Export Prices, By Country: Historical Data (2012–2025) and Forecast (2026–2035)
  17. LIST OF FIGURES

    1. Market Volume, In Physical Terms: Historical Data (2012–2025) and Forecast (2026–2035)
    2. Market Value: Historical Data (2012–2025) and Forecast (2026–2035)
    3. Consumption, by Country, 2025
    4. Market Volume Forecast to 2035
    5. Market Value Forecast to 2035
    6. Market Size and Growth, By Product
    7. Average Per Capita Consumption, By Product
    8. Exports and Growth, By Product
    9. Export Prices and Growth, By Product
    10. Production Volume and Growth
    11. Exports and Growth
    12. Export Prices and Growth
    13. Market Size and Growth
    14. Per Capita Consumption
    15. Imports and Growth
    16. Import Prices
    17. Production, In Physical Terms: Historical Data (2012–2025) and Forecast (2026–2035)
    18. Production, In Value Terms: Historical Data (2012–2025) and Forecast (2026–2035)
    19. Production, by Country, 2025
    20. Production, In Physical Terms, by Country: Historical Data (2012–2025) and Forecast (2026–2035)
    21. Imports, In Physical Terms: Historical Data (2012–2025) and Forecast (2026–2035)
    22. Imports, In Value Terms: Historical Data (2012–2025) and Forecast (2026–2035)
    23. Imports, In Physical Terms, By Country, 2025
    24. Imports, In Physical Terms, By Country: Historical Data (2012–2025) and Forecast (2026–2035)
    25. Imports, In Value Terms, By Country: Historical Data (2012–2025) and Forecast (2026–2035)
    26. Import Prices, By Country: Historical Data (2012–2025) and Forecast (2026–2035)
    27. Exports, In Physical Terms: Historical Data (2012–2025) and Forecast (2026–2035)
    28. Exports, In Value Terms: Historical Data (2012–2025) and Forecast (2026–2035)
    29. Exports, In Physical Terms, By Country, 2025
    30. Exports, In Physical Terms, By Country: Historical Data (2012–2025) and Forecast (2026–2035)
    31. Exports, In Value Terms, By Country: Historical Data (2012–2025) and Forecast (2026–2035)
    32. Export Prices, By Country: Historical Data (2012–2025) and Forecast (2026–2035)
Oregon Legislature Cuts Funding for 100% Fish Seafood Waste Reduction Pilot
Mar 20, 2026

Oregon Legislature Cuts Funding for 100% Fish Seafood Waste Reduction Pilot

Oregon's legislature removed funding for a 100% Fish pilot project aimed at reducing seafood waste by repurposing byproducts, though supporters plan to reintroduce the proposal.

Agtegra Cooperative to Build New 100,000-Ton Feed Mill in Faulkton, SD
Mar 12, 2026

Agtegra Cooperative to Build New 100,000-Ton Feed Mill in Faulkton, SD

Agtegra Cooperative is building a new feed production facility in Faulkton, SD, with 100,000-ton annual capacity to support local livestock producers, scheduled to be operational in 2027.

Global Animal Feed Market's Steady Climb to 1,134 Million Tons and $1,433.4 Billion by 2035
Feb 27, 2026

Global Animal Feed Market's Steady Climb to 1,134 Million Tons and $1,433.4 Billion by 2035

Global animal and pet feed market analysis: 2024 consumption at 1,022M tons, forecast to reach 1,134M tons by 2035. Key insights on production, trade, leading countries, and price trends.

Seafood Expo Global 2026 Introduces New Aquaculture Innovation Zone
Feb 24, 2026

Seafood Expo Global 2026 Introduces New Aquaculture Innovation Zone

Seafood Expo Global launches an Aquaculture Innovation Zone, featuring six international companies showcasing feed, RAS design, IoT platforms, AI applications, and sea lice control systems.

Freshpet Q4 2025 Results: Revenue Hits $285.2M, EPS Beats Estimates
Feb 23, 2026

Freshpet Q4 2025 Results: Revenue Hits $285.2M, EPS Beats Estimates

Freshpet reports strong Q4 2025 earnings with revenue growth and significant EPS beat, achieving over $1 billion in annual sales for the first time while providing its financial outlook for 2026.

New Report: AI Accelerates Packaging Circularity and Design Optimization
Jan 24, 2026

New Report: AI Accelerates Packaging Circularity and Design Optimization

A 2026 industry report outlines how artificial intelligence is being used to design better packaging, sort waste, and trace materials to create a more circular economy for consumer goods.

G2 reviews
Teams rate IndexBox on G2

Verified reviewers highlight faster qualification, clearer collaboration, and stronger bid readiness.

G2

High Performer

Regional Grid

G2

High Performer Small-Business

Grid Report

G2

Leader Small-Business

Grid Report

G2

High Performer Mid-Market

Grid Report

G2

Leader

Grid Report

G2

Users Love Us

Milestone badge

Cristian Spataru

Cristian Spataru

Commercial Manager · XTRATECRO

5/5

Great for Market Insights and Analysis

“IndexBox is a solid source for trade and industrial market data — what I like best about it is how it aggregates official statistics.”

Review collected and hosted on G2.com.

Juan Pablo Cabrera

Juan Pablo Cabrera

Gerente de Innovación · Cartocor

5/5

Extremely gratifying

“Access very specific and broad information of any type of market.”

Review collected and hosted on G2.com.

Dilan Salam

Dilan Salam

GMP; ISO Compliance Supervisor · PiONEER Co. for Pharmaceutical Industries

5/5

Powerful data at a fair price

“I have got a lot of benefit from IndexBox, too many data available, and easy to use software at a very good price.”

Review collected and hosted on G2.com.

Counselor Hasan AlKhoori

Counselor Hasan AlKhoori

Founder and CEO · Independent

5/5

All the data required

“All the data required for building your full analytics infrastructure.”

Review collected and hosted on G2.com.

Ashenafi Behailu

Ashenafi Behailu

General Manager · Ashenafi Behailu General Contractor

5/5

Detailed, well-organized data

“The data organization and level of detail which it is presented in is very helpful.”

Review collected and hosted on G2.com.

Iman Aref

Iman Aref

Senior Export Manager · Padideh Shimi Gharn

5/5

Up to date and precise info

“Up to date and precise info, for fulfilling the validity and reliability of the given research.”

Review collected and hosted on G2.com.

Top 20 global market participants
Dielectric-Dried Feeds · Global scope
#1
C

Cargill

Headquarters
Wayzata, Minnesota, USA
Focus
Animal nutrition & feed ingredients
Scale
Global

Major player in feed processing and supply

#2
A

ADM

Headquarters
Chicago, Illinois, USA
Focus
Agricultural processing & nutrition
Scale
Global

Produces a wide range of feed ingredients

#3
F

ForFarmers

Headquarters
Lochem, Netherlands
Focus
Compound feed production
Scale
European

Leading European feed company

#4
D

De Heus Animal Nutrition

Headquarters
Ede, Netherlands
Focus
Animal feed & nutrition
Scale
Global

Significant in feed manufacturing

#5
N

Nutreco

Headquarters
Amersfoort, Netherlands
Focus
Animal nutrition & aquafeed
Scale
Global

Parent of Trouw Nutrition & Skretting

#6
A

Alltech

Headquarters
Nicholasville, Kentucky, USA
Focus
Animal nutrition & feed additives
Scale
Global

Focus on nutritional technology

#7
C

Charoen Pokphand Foods

Headquarters
Bangkok, Thailand
Focus
Agribusiness & animal feed
Scale
Global

Major Asian agribusiness conglomerate

#8
N

New Hope Group

Headquarters
Chengdu, Sichuan, China
Focus
Feed production & livestock
Scale
China

One of China's largest feed producers

#9
T

Tyson Foods

Headquarters
Springdale, Arkansas, USA
Focus
Meat production & feed milling
Scale
Global

Vertically integrated; produces own feed

#10
B

BASF

Headquarters
Ludwigshafen, Germany
Focus
Chemicals & feed vitamins
Scale
Global

Key supplier of feed vitamins & additives

#11
D

DSM

Headquarters
Heerlen, Netherlands
Focus
Nutrition & feed additives
Scale
Global

Major in vitamins, premixes, specialties

#12
E

Evonik Industries

Headquarters
Essen, Germany
Focus
Specialty chemicals & amino acids
Scale
Global

Leading producer of feed amino acids

#13
A

AB Agri

Headquarters
Peterborough, UK
Focus
Animal nutrition & feed
Scale
European

Part of Associated British Foods

#14
D

DLG Group

Headquarters
Copenhagen, Denmark
Focus
Feed, agriculture, & commodities
Scale
European

Scandinavian agricultural cooperative

#15
A

Agrifirm

Headquarters
Apeldoorn, Netherlands
Focus
Cooperative feed producer
Scale
European

Major cooperative in Benelux

#16
J

J.D. Heiskell & Co.

Headquarters
Tulare, California, USA
Focus
Feed & commodity merchandising
Scale
North America

Specialist in feed ingredient supply

#17
K

Kent Nutrition Group

Headquarters
Muscatine, Iowa, USA
Focus
Manufactured feed & supplements
Scale
North America

Part of Kent Corporation

#18
P

Perdue Farms

Headquarters
Salisbury, Maryland, USA
Focus
Poultry & agriculture
Scale
North America

Vertically integrated; produces feed

#19
B

BRF

Headquarters
São Paulo, Brazil
Focus
Food processing & animal feed
Scale
Global

Major Brazilian integrated player

#20
C

CJ CheilJedang

Headquarters
Seoul, South Korea
Focus
Food, feed, & bio
Scale
Global

Significant Asian feed & amino acid producer

Dashboard for Dielectric-Dried Feeds (World)
Demo data

Charts mirror the report figures on the platform. Values are synthetic for demo use.

Market Volume
Demo
Market Volume, in Physical Terms: Historical Data (2013-2025) and Forecast (2026-2036)
Market Value
Demo
Market Value: Historical Data (2013-2025) and Forecast (2026-2036)
Consumption by Country
Demo
Consumption, by Country, 2025
Top consuming countries Share, %
Market Volume Forecast
Demo
Market Volume Forecast to 2036
Market Value Forecast
Demo
Market Value Forecast to 2036
Market Size and Growth
Demo
Market Size and Growth, by Product
Segment Growth, %
Per Capita Consumption
Demo
Per Capita Consumption, by Product
Segment Kg per capita
Per Capita Consumption Trend
Demo
Per Capita Consumption, 2013-2025
Production Volume
Demo
Production, in Physical Terms, 2013-2025
Production Value
Demo
Production Value, 2013-2025
Production by Country
Demo
Production, by Country, 2025
Top producing countries Share, %
Export Price
Demo
Export Price, 2013-2025
Import Price
Demo
Import Price, 2013-2025
Export Price by Country
Demo
Export Price, by Country, 2025
Top export price USD per ton
Import Price by Country
Demo
Import Price, by Country, 2025
Top import price USD per ton
Price Spread
Demo
Export-Import Price Spread, 2013-2025
Average Price
Demo
Average Export Price, 2013-2025
Import Volume
Demo
Import Volume, 2013-2025
Import Value
Demo
Import Value, 2013-2025
Imports by Country
Demo
Imports, by Country, 2025
Top importing countries Share, %
Import Price by Country
Demo
Import Price, by Country, 2025
Top import price USD per ton
Export Volume
Demo
Export Volume, 2013-2025
Export Value
Demo
Export Value, 2013-2025
Exports by Country
Demo
Exports, by Country, 2025
Top exporting countries Share, %
Export Price by Country
Demo
Export Price, by Country, 2025
Top export price USD per ton
Export Growth by Product
Demo
Export Growth, by Product, 2025
Segment Growth, %
Export Price Growth by Product
Demo
Export Price Growth, by Product, 2025
Segment Growth, %
Dielectric-Dried Feeds - World - Supplying Countries
Leader in Production
India
Within 50 Countries
Leader in Exports
Ecuador
Within TOP 50 Producing Countries
Leader in Prices
Malawi
Within TOP 50 Exporting Countries
World - Top Producing Countries
Demo
Production Volume vs CAGR of Production Volume
World - Top Exporting Countries
Demo
Export Volume vs CAGR of Exports
World - Low-cost Exporting Countries
Demo
Export Price vs CAGR of Export Prices
Dielectric-Dried Feeds - World - Overseas Markets
Largest Importer
United States
Within TOP 50 Importing Countries
Fastest Import Growth
Vietnam
CAGR 2017-2025
Highest Import Price
Japan
USD per ton, 2025
Largest Market Value
Germany
2025
World - Top Importing Countries
Demo
Import Volume vs CAGR of Imports
World - Largest Consumption Markets
Demo
Consumption Volume vs CAGR of Consumption
World - Fastest Import Growth
Demo
Import Growth Leaders, 2025
World - Highest Import Prices
Demo
Import Prices Leaders, 2025
Dielectric-Dried Feeds - World - Products for Diversification
Top Diversification Option
Segment A
High synergy with core demand
Fastest Growth
Segment B
CAGR 2017-2025
Highest Margin
Segment C
Premium pricing tier
Lowest Volatility
Segment D
Stable demand trend
Products with the Highest Export Growth
Demo
Export Growth by Product, 2025
Products with Rising Prices
Demo
Price Growth by Product, 2025
Products with High Import Dependence
Demo
Import Dependence Index, 2025
Diversification Shortlist
Demo
Product Rationale
Macroeconomic indicators influencing the Dielectric-Dried Feeds market (World)
Live data

Real macro, logistics, and energy indicators are pulled from the IndexBox platform and rendered on demand.

Loading indicators...
No chart data available for macro indicators.
No chart data available for logistics indicators.
No chart data available for energy and commodity indicators.

Featured reports in Food Products

Market Intelligence

Free Data: Food Products - World

Instant access. No credit card needed.