Portugal - Taps, Cocks, Valves and Similar Appliances - Market Analysis, Forecast, Size, Trends and Insights
Get instant access to more than 2 million reports, dashboards, and datasets on the IndexBox Platform.
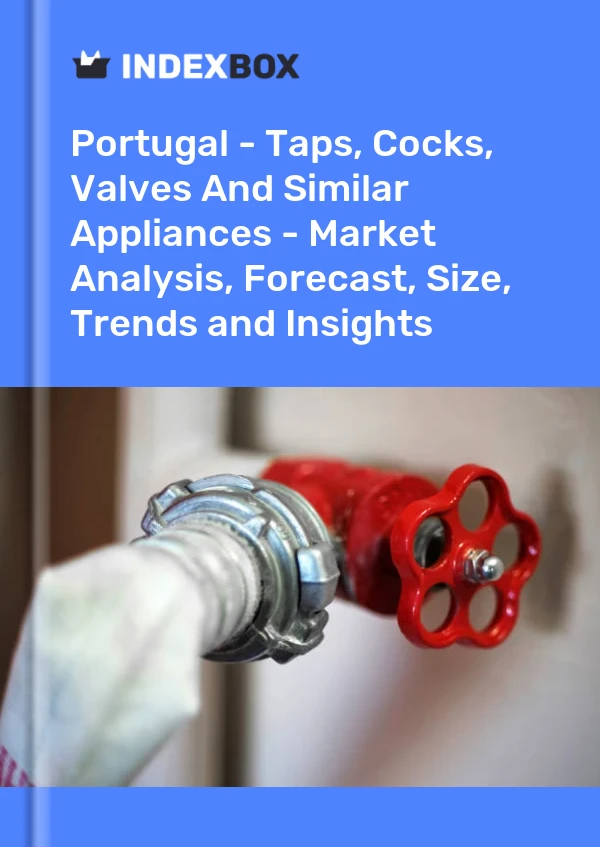
View PricingPortugal: Tap And Valve Market 2024
Tap And Valve Market Size in Portugal
In 2022, the Portuguese tap and valve market increased by X% to $X, rising for the third consecutive year after two years of decline. Over the period under review, the total consumption indicated a strong increase from 2012 to 2022: its value increased at an average annual rate of X% over the last decade. The trend pattern, however, indicated some noticeable fluctuations being recorded throughout the analyzed period. Based on 2022 figures, consumption increased by X% against 2019 indices. As a result, consumption attained the peak level and is likely to continue growth in the immediate term.
Tap And Valve Production in Portugal
In value terms, tap and valve production rose markedly to $X in 2022 estimated in export price. The total output value increased at an average annual rate of X% from 2012 to 2022; the trend pattern indicated some noticeable fluctuations being recorded throughout the analyzed period. The growth pace was the most rapid in 2016 with an increase of X% against the previous year. Over the period under review, production attained the peak level in 2022 and is likely to see gradual growth in the near future.
Tap And Valve Exports
Exports from Portugal
In 2022, the amount of taps, cocks, valves and similar appliances exported from Portugal dropped slightly to X tons, declining by X% on 2021. In general, exports, however, continue to indicate a relatively flat trend pattern. The pace of growth was the most pronounced in 2021 when exports increased by X% against the previous year. The exports peaked at X tons in 2018; however, from 2019 to 2022, the exports failed to regain momentum.
In value terms, tap and valve exports contracted modestly to $X in 2022. The total export value increased at an average annual rate of X% from 2012 to 2022; the trend pattern indicated some noticeable fluctuations being recorded throughout the analyzed period. The pace of growth appeared the most rapid in 2021 when exports increased by X%. As a result, the exports attained the peak of $X, leveling off in the following year.
Exports by Country
Germany (X tons) was the main destination for tap and valve exports from Portugal, with a X% share of total exports. Moreover, tap and valve exports to Germany exceeded the volume sent to the second major destination, Spain (X tons), fivefold. France (X tons) ranked third in terms of total exports with a X% share.
From 2012 to 2022, the average annual growth rate of volume to Germany totaled X%. Exports to the other major destinations recorded the following average annual rates of exports growth: Spain (X% per year) and France (X% per year).
In value terms, Germany ($X) remains the key foreign market for taps, cocks, valves and similar appliances exports from Portugal, comprising X% of total exports. The second position in the ranking was taken by Spain ($X), with a X% share of total exports. It was followed by the United States, with a X% share.
From 2012 to 2022, the average annual growth rate of value to Germany stood at X%. Exports to the other major destinations recorded the following average annual rates of exports growth: Spain (X% per year) and the United States (X% per year).
Export Prices by Country
In 2022, the average tap and valve export price amounted to $X per ton, rising by X% against the previous year. Over the last decade, it increased at an average annual rate of X%. The most prominent rate of growth was recorded in 2017 an increase of X% against the previous year. Over the period under review, the average export prices hit record highs in 2022 and is expected to retain growth in years to come.
Prices varied noticeably by country of destination: amid the top suppliers, the country with the highest price was the United States ($X per ton), while the average price for exports to Angola ($X per ton) was amongst the lowest.
From 2012 to 2022, the most notable rate of growth in terms of prices was recorded for supplies to Spain (X%), while the prices for the other major destinations experienced more modest paces of growth.
Tap And Valve Imports
Imports into Portugal
In 2022, approx. X tons of taps, cocks, valves and similar appliances were imported into Portugal; standing approx. at the previous year's figure. The total import volume increased at an average annual rate of X% from 2012 to 2022; however, the trend pattern indicated some noticeable fluctuations being recorded throughout the analyzed period. The most prominent rate of growth was recorded in 2021 when imports increased by X%. Imports peaked at X tons in 2018; however, from 2019 to 2022, imports stood at a somewhat lower figure.
In value terms, tap and valve imports expanded modestly to $X in 2022. Over the period under review, total imports indicated a perceptible expansion from 2012 to 2022: its value increased at an average annual rate of X% over the last decade. The trend pattern, however, indicated some noticeable fluctuations being recorded throughout the analyzed period. Based on 2022 figures, imports increased by X% against 2020 indices. The pace of growth appeared the most rapid in 2021 when imports increased by X%. Over the period under review, imports attained the maximum in 2022 and are expected to retain growth in the immediate term.
Imports by Country
Spain (X tons), Italy (X tons) and China (X tons) were the main suppliers of tap and valve imports to Portugal, together comprising X% of total imports.
From 2012 to 2022, the most notable rate of growth in terms of purchases, amongst the main suppliers, was attained by China (with a CAGR of X%), while imports for the other leaders experienced more modest paces of growth.
In value terms, Spain ($X), Italy ($X) and Germany ($X) constituted the largest tap and valve suppliers to Portugal, with a combined X% share of total imports. France, China, the Netherlands and the UK lagged somewhat behind, together accounting for a further X%.
China, with a CAGR of X%, recorded the highest rates of growth with regard to the value of imports, in terms of the main suppliers over the period under review, while purchases for the other leaders experienced more modest paces of growth.
Import Prices by Country
The average tap and valve import price stood at $X per ton in 2022, picking up by X% against the previous year. In general, the import price showed a relatively flat trend pattern. The pace of growth was the most pronounced in 2013 when the average import price increased by X%. Over the period under review, average import prices reached the maximum in 2022 and is expected to retain growth in years to come.
Prices varied noticeably by country of origin: amid the top importers, the country with the highest price was Germany ($X per ton), while the price for China ($X per ton) was amongst the lowest.
From 2012 to 2022, the most notable rate of growth in terms of prices was attained by the UK (X%), while the prices for the other major suppliers experienced more modest paces of growth.
Source: IndexBox Platform
Frequently Asked Questions (FAQ) :
This report provides an in-depth analysis of the tap and valve market in Portugal. Within it, you will discover the latest data on market trends and opportunities by country, consumption, production and price developments, as well as the global trade (imports and exports). The forecast exhibits the market prospects through 2030.
Product coverage:
- Prodcom 28121420 - Pneumatic filters, regulators and lubricators
- Prodcom 28121450 - Valves for the control of oleohydraulic power transmission for pipes, boiler shells, tanks, vats and the like
- Prodcom 28121480 - Valves for the control of pneumatic power transmission for pipes, boiler shells, tanks, vats and the like
- Prodcom 28141120 - Pressure-reducing valves of cast iron or steel, for pipes, b oiler shells, tanks, vats and the like (excluding those combined with lubricators or filters)
- Prodcom 28141140 - Pressure-reducing valves for pipes, boiler shells, tanks, vats and the like (excluding of cast iron or steel, those combined with filters or lubricators)
- Prodcom 28141160 - Check valves for pipes, boiler shells, tanks, vats and the like
- Prodcom 28141170 - Valves for pneumatic tyres and inner-tubes
- Prodcom 28141180 - Safety or relief valves for pipes, boiler shells, tanks, vats and the like
- Prodcom 28141233 - Mixing valves for sinks, wash basins, bidets, water cisterns etc. excluding valves for pressure-reducing or oleohydraulic/pneumatic power transmissions, check valves, s afety/relief valves
- Prodcom 28141235 - Taps, cocks and valves for sinks, wash basins, bidets, water cisterns etc. excluding valves for pressurereducing/ oleohydraulic transmissions, check, safety, relief and mixing valves
- Prodcom 28141253 - Central heating radiator thermostatic valves
- Prodcom 28141255 - Central heating radiator valves, other
- Prodcom 28141313 - Other process control valves, temperature regulators
- Prodcom 28141315 - Process control valves for pipes, boiler shells, tanks etc. excluding valves for pressure-reducing or oleohydraulic/pneumatic power transmissions, check, s afety/relief valves, temp. regulators
- Prodcom 28141333 - Other gate valves, of cast iron
- Prodcom 28141335 - Other gate valves, of steel
- Prodcom 28141337 - Other gate valves, other
- Prodcom 28141353 - Globe valves, of cast iron
- Prodcom 28141355 - Globe valves, of steel
- Prodcom 28141357 - Other globe valves
- Prodcom 28141373 - Ball and plug valves
- Prodcom 28141375 - Butterfly valves
- Prodcom 28141377 - Diaphragm valves
- Prodcom 28141380 - Other appliances
Country coverage:
- Portugal
Data coverage:
- Market volume and value
- Per Capita consumption
- Forecast of the market dynamics in the medium term
- Trade (exports and imports) in Portugal
- Export and import prices
- Market trends, drivers and restraints
- Key market players and their profiles
Reasons to buy this report:
- Take advantage of the latest data
- Find deeper insights into current market developments
- Discover vital success factors affecting the market
This report is designed for manufacturers, distributors, importers, and wholesalers, as well as for investors, consultants and advisors.
In this report, you can find information that helps you to make informed decisions on the following issues:
- How to diversify your business and benefit from new market opportunities
- How to load your idle production capacity
- How to boost your sales on overseas markets
- How to increase your profit margins
- How to make your supply chain more sustainable
- How to reduce your production and supply chain costs
- How to outsource production to other countries
- How to prepare your business for global expansion
While doing this research, we combine the accumulated expertise of our analysts and the capabilities of artificial intelligence. The AI-based platform, developed by our data scientists, constitutes the key working tool for business analysts, empowering them to discover deep insights and ideas from the marketing data.
-
1. INTRODUCTION
Making Data-Driven Decisions to Grow Your Business
- REPORT DESCRIPTION
- RESEARCH METHODOLOGY AND AI PLATFORM
- DATA-DRIVEN DECISIONS FOR YOUR BUSINESS
- GLOSSARY AND SPECIFIC TERMS
-
2. EXECUTIVE SUMMARY
A Quick Overview of Market Performance
- KEY FINDINGS
- MARKET TRENDS This Chapter is Available Only for the Professional Edition PRO
-
3. MARKET OVERVIEW
Understanding the Current State of The Market and Its Prospects
- MARKET SIZE
- MARKET STRUCTURE
- TRADE BALANCE
- PER CAPITA CONSUMPTION
- MARKET FORECAST TO 2030
-
4. MOST PROMISING PRODUCT
Finding New Products to Diversify Your Business
This Chapter is Available Only for the Professional Edition PRO- TOP PRODUCTS TO DIVERSIFY YOUR BUSINESS
- BEST-SELLING PRODUCTS
- MOST CONSUMED PRODUCT
- MOST TRADED PRODUCT
- MOST PROFITABLE PRODUCT FOR EXPORT
-
5. MOST PROMISING SUPPLYING COUNTRIES
Choosing the Best Countries to Establish Your Sustainable Supply Chain
This Chapter is Available Only for the Professional Edition PRO- TOP COUNTRIES TO SOURCE YOUR PRODUCT
- TOP PRODUCING COUNTRIES
- TOP EXPORTING COUNTRIES
- LOW-COST EXPORTING COUNTRIES
-
6. MOST PROMISING OVERSEAS MARKETS
Choosing the Best Countries to Boost Your Exports
This Chapter is Available Only for the Professional Edition PRO- TOP OVERSEAS MARKETS FOR EXPORTING YOUR PRODUCT
- TOP CONSUMING MARKETS
- UNSATURATED MARKETS
- TOP IMPORTING MARKETS
- MOST PROFITABLE MARKETS
7. PRODUCTION
The Latest Trends and Insights into The Industry
- PRODUCTION VOLUME AND VALUE
8. IMPORTS
The Largest Import Supplying Countries
- IMPORTS FROM 2012–2023
- IMPORTS BY COUNTRY
- IMPORT PRICES BY COUNTRY
9. EXPORTS
The Largest Destinations for Exports
- EXPORTS FROM 2012–2023
- EXPORTS BY COUNTRY
- EXPORT PRICES BY COUNTRY
-
10. PROFILES OF MAJOR PRODUCERS
The Largest Producers on The Market and Their Profiles
This Chapter is Available Only for the Professional Edition PRO -
LIST OF TABLES
- Key Findings In 2023
- Market Volume, In Physical Terms, 2012–2023
- Market Value, 2012–2023
- Per Capita Consumption In 2012-2023
- Imports, In Physical Terms, By Country, 2012–2023
- Imports, In Value Terms, By Country, 2012–2023
- Import Prices, By Country Of Origin, 2012–2023
- Exports, In Physical Terms, By Country, 2012–2023
- Exports, In Value Terms, By Country, 2012–2023
- Export Prices, By Country Of Destination, 2012–2023
-
LIST OF FIGURES
- Market Volume, In Physical Terms, 2012–2023
- Market Value, 2012–2023
- Market Structure – Domestic Supply vs. Imports, In Physical Terms, 2012-2023
- Market Structure – Domestic Supply vs. Imports, In Value Terms, 2012-2023
- Trade Balance, In Physical Terms, 2012-2023
- Trade Balance, In Value Terms, 2012-2023
- Per Capita Consumption, 2012-2023
- Market Volume Forecast to 2030
- Market Value Forecast to 2030
- Products: Market Size And Growth, By Type
- Products: Average Per Capita Consumption, By Type
- Products: Exports And Growth, By Type
- Products: Export Prices And Growth, By Type
- Production Volume And Growth
- Exports And Growth
- Export Prices And Growth
- Market Size And Growth
- Per Capita Consumption
- Imports And Growth
- Import Prices
- Production, In Physical Terms, 2012–2023
- Production, In Value Terms, 2012–2023
- Imports, In Physical Terms, 2012–2023
- Imports, In Value Terms, 2012–2023
- Imports, In Physical Terms, By Country, 2023
- Imports, In Physical Terms, By Country, 2012–2023
- Imports, In Value Terms, By Country, 2012–2023
- Import Prices, By Country Of Origin, 2012–2023
- Exports, In Physical Terms, 2012–2023
- Exports, In Value Terms, 2012–2023
- Exports, In Physical Terms, By Country, 2023
- Exports, In Physical Terms, By Country, 2012–2023
- Exports, In Value Terms, By Country, 2012–2023
- Export Prices, By Country Of Destination, 2012–2023
Recommended reports
This report provides an in-depth analysis of the tap and valve market in Asia.
This report provides an in-depth analysis of the tap and valve market in the U.S..
This report provides an in-depth analysis of the tap and valve market in China.
This report provides an in-depth analysis of the tap and valve market in the EU.
This report provides an in-depth analysis of the global tap and valve market.


