Filling Containers Machinery Market Size in Norway
In 2025, the Norwegian filling containers machinery market increased by X% to $X, rising for the third consecutive year after two years of decline. In general, consumption enjoyed a perceptible increase. Over the period under review, the market attained the peak level in 2025 and is expected to retain growth in the near future.
Filling Containers Machinery Exports
Exports from Norway
In 2025, shipments abroad of machinery for filling, closing, sealing, capsuling or labelling containers increased by X% to X units for the first time since 2021, thus ending a two-year declining trend. Overall, exports saw a strong increase. The pace of growth appeared the most rapid in 2021 with an increase of X% against the previous year. As a result, the exports attained the peak of X units. From 2022 to 2025, the growth of the exports remained at a lower figure.
In value terms, filling containers machinery exports skyrocketed to $X in 2025. Over the period under review, exports recorded slight growth. The growth pace was the most rapid in 2017 with an increase of X%. Over the period under review, the exports attained the peak figure at $X in 2014; however, from 2015 to 2025, the exports remained at a lower figure.
Exports by Country
Sweden (X units), Germany (X units) and the United States (X units) were the main destinations of filling containers machinery exports from Norway, with a combined X% share of total exports. Ireland, the UK, Finland, France and the Netherlands lagged somewhat behind, together accounting for a further X%.
From 2012 to 2025, the biggest increases were recorded for Ireland (with a CAGR of X%), while shipments for the other leaders experienced more modest paces of growth.
In value terms, Germany ($X) emerged as the key foreign market for machinery for filling, closing, sealing, capsuling or labelling containers exports from Norway, comprising X% of total exports. The second position in the ranking was held by Sweden ($X), with an X% share of total exports. It was followed by the United States, with an X% share.
From 2012 to 2025, the average annual rate of growth in terms of value to Germany totaled X%. Exports to the other major destinations recorded the following average annual rates of exports growth: Sweden (X% per year) and the United States (X% per year).
Export Prices by Country
In 2025, the average filling containers machinery export price amounted to $X thousand per unit, with an increase of X% against the previous year. Over the period under review, the export price, however, continues to indicate a abrupt decrease. The pace of growth appeared the most rapid in 2023 when the average export price increased by X%. Over the period under review, the average export prices hit record highs at $X thousand per unit in 2012; however, from 2013 to 2025, the export prices remained at a lower figure.
There were significant differences in the average prices for the major foreign markets. In 2025, amid the top suppliers, the country with the highest price was Germany ($X thousand per unit), while the average price for exports to Sweden ($X per unit) was amongst the lowest.
From 2012 to 2025, the most notable rate of growth in terms of prices was recorded for supplies to Germany (X%), while the prices for the other major destinations experienced a decline.
Filling Containers Machinery Imports
Imports into Norway
Filling containers machinery imports into Norway surged to X units in 2025, with an increase of X% compared with 2023 figures. In general, imports saw a prominent increase. The pace of growth appeared the most rapid in 2014 with an increase of X% against the previous year. Imports peaked in 2025 and are expected to retain growth in the near future.
In value terms, filling containers machinery imports amounted to $X in 2025. Over the period under review, imports, however, recorded a perceptible downturn. The most prominent rate of growth was recorded in 2016 when imports increased by X% against the previous year. Imports peaked at $X in 2012; however, from 2013 to 2025, imports failed to regain momentum.
Imports by Country
China (X units), Israel (X units) and the Netherlands (X units) were the main suppliers of filling containers machinery imports to Norway, with a combined X% share of total imports.
From 2012 to 2025, the most notable rate of growth in terms of purchases, amongst the main suppliers, was attained by Israel (with a CAGR of X%), while imports for the other leaders experienced more modest paces of growth.
In value terms, Germany ($X) constituted the largest supplier of machinery for filling, closing, sealing, capsuling or labelling containers to Norway, comprising X% of total imports. The second position in the ranking was taken by Sweden ($X), with an X% share of total imports. It was followed by Italy, with a X% share.
From 2012 to 2025, the average annual rate of growth in terms of value from Germany was relatively modest. The remaining supplying countries recorded the following average annual rates of imports growth: Sweden (X% per year) and Italy (X% per year).
Import Prices by Country
In 2025, the average filling containers machinery import price amounted to $X per unit, falling by X% against the previous year. Overall, the import price showed a abrupt downturn. The most prominent rate of growth was recorded in 2022 an increase of X%. Over the period under review, average import prices attained the maximum at $X thousand per unit in 2012; however, from 2013 to 2025, import prices remained at a lower figure.
There were significant differences in the average prices amongst the major supplying countries. In 2025, amid the top importers, the country with the highest price was Germany ($X thousand per unit), while the price for Israel ($X per unit) was amongst the lowest.
From 2012 to 2025, the most notable rate of growth in terms of prices was attained by Sweden (X%), while the prices for the other major suppliers experienced a decline.
Frequently Asked Questions (FAQ) :
The countries with the highest volumes of consumption in 2024 were the United States, the Philippines and Japan, with a combined 61% share of global consumption. Malaysia, Canada, Thailand, Kazakhstan, Russia, China and Brazil lagged somewhat behind, together comprising a further 24%.
The countries with the highest volumes of production in 2024 were China, Germany and Italy, with a combined 68% share of global production.
In value terms, Germany constituted the largest supplier of machinery for filling, closing, sealing, capsuling or labelling containers to Norway, comprising 59% of total imports. The second position in the ranking was taken by Sweden, with an 11% share of total imports. It was followed by Italy, with a 6.4% share.
In value terms, Germany emerged as the key foreign market for machinery for filling, closing, sealing, capsuling or labelling containers exports from Norway, comprising 65% of total exports. The second position in the ranking was held by Sweden, with an 8.7% share of total exports. It was followed by the United States, with an 8.5% share.
The average filling containers machinery export price stood at $1.8 thousand per unit in 2024, surging by 38% against the previous year. Overall, the export price, however, recorded a abrupt descent. The growth pace was the most rapid in 2023 an increase of 216% against the previous year. Over the period under review, the average export prices reached the maximum at $11 thousand per unit in 2012; however, from 2013 to 2024, the export prices failed to regain momentum.
The average filling containers machinery import price stood at $515 per unit in 2024, shrinking by -31.7% against the previous year. In general, the import price continues to indicate a abrupt downturn. The pace of growth appeared the most rapid in 2022 when the average import price increased by 34%. The import price peaked at $2.4 thousand per unit in 2012; however, from 2013 to 2024, import prices remained at a lower figure.
This report provides a comprehensive view of the filling containers machinery industry in Norway, tracking demand, supply, and trade flows across the national value chain. It explains how demand across key channels and end-use segments shapes consumption patterns, while also mapping the role of input availability, production efficiency, and regulatory standards on supply.
Beyond headline metrics, the study benchmarks prices, margins, and trade routes so you can see where value is created and how it moves between domestic suppliers and international partners. The analysis is designed to support strategic planning, market entry, portfolio prioritization, and risk management in the filling containers machinery landscape in Norway.
Domestic demand is shaped by both household and industrial usage, with trade flows linking local supply to imports and exports.
Pricing dynamics reflect unit values, freight costs, exchange rates, and regulatory shifts that affect sourcing decisions.
Supply depends on input availability and production efficiency, creating a distinct national cost curve.
Market concentration varies by segment, creating different competitive landscapes and entry barriers.
The 2035 outlook highlights where capacity investment and demand growth are most aligned within the country.
Report scope
The report combines market sizing with trade intelligence and price analytics for Norway. It covers both historical performance and the forward outlook to 2035, allowing you to compare cycles, structural shifts, and policy impacts.
Market size and growth in value and volume terms
Consumption structure by end-use segments
Production capacity, output, and cost dynamics
Trade flows, exporters, importers, and balances
Price benchmarks, unit values, and margin signals
Competitive context and market entry conditions
Product coverage
Prodcom 28292150 - Machinery for filling, closing, sealing, capsuling or labelling bottles, cans, boxes, bags or other containers, machinery for aerating beverages
Country coverage
Norway
Country profile and benchmarks
This report provides a consistent view of market size, trade balance, prices, and per-capita indicators for Norway. The profile highlights demand structure and trade position, enabling benchmarking against regional and global peers.
Methodology
The analysis is built on a multi-source framework that combines official statistics, trade records, company disclosures, and expert validation. Data are standardized, reconciled, and cross-checked to ensure consistency across time series.
International trade data (exports, imports, and mirror statistics)
National production and consumption statistics
Company-level information from financial filings and public releases
Price series and unit value benchmarks
Analyst review, outlier checks, and time-series validation
All data are normalized to a common product definition and mapped to a consistent set of codes. This ensures that comparisons across time are aligned and actionable.
Forecasts to 2035
The forecast horizon extends to 2035 and is based on a structured model that links filling containers machinery demand and supply to macroeconomic indicators, trade patterns, and sector-specific drivers. The model captures both cyclical and structural factors and reflects known policy and technology shifts in Norway.
Historical baseline: 2012-2025
Forecast horizon: 2026-2035
Scenario-based sensitivity to income growth, substitution, and regulation
Capacity and investment outlook for major producing companies
Each projection is built from national historical patterns and the broader regional context, allowing the report to show where growth is concentrated and where risks are elevated.
Price analysis and trade dynamics
Prices are analyzed in detail, including export and import unit values, regional spreads, and changes in trade costs. The report highlights how seasonality, freight rates, exchange rates, and supply disruptions influence pricing and margins.
Price benchmarks by country and sub-region
Export and import unit value trends
Seasonality and calendar effects in trade flows
Price outlook to 2035 under baseline assumptions
Profiles of market participants
Key producers, exporters, and distributors are profiled with a focus on their operational scale, geographic footprint, product mix, and market positioning. This helps identify competitive pressure points, partnership opportunities, and routes to differentiation.
Business focus and production capabilities
Geographic reach and distribution networks
Cost structure and pricing strategy indicators
Compliance, certification, and sustainability context
How to use this report
Quantify domestic demand and identify the most attractive segments
Evaluate export opportunities and prioritize target destinations
Track price dynamics and protect margins
Benchmark performance against leading competitors
Build evidence-based forecasts for investment decisions
This report is designed for manufacturers, distributors, importers, wholesalers, investors, and advisors who need a clear, data-driven picture of filling containers machinery dynamics in Norway.
FAQ
What is included in the filling containers machinery market in Norway?
The market size aggregates consumption and trade data, presented in both value and volume terms.
How are the forecasts to 2035 built?
The projections combine historical trends with macroeconomic indicators, trade dynamics, and sector-specific drivers.
Does the report cover prices and margins?
Yes, it includes export and import unit values, regional spreads, and a pricing outlook to 2035.
Which benchmarks are included?
The report benchmarks market size, trade balance, prices, and per-capita indicators for Norway.
Can this report support market entry decisions?
Yes, it highlights demand hotspots, trade routes, pricing trends, and competitive context.
1. INTRODUCTION
Making Data-Driven Decisions to Grow Your Business
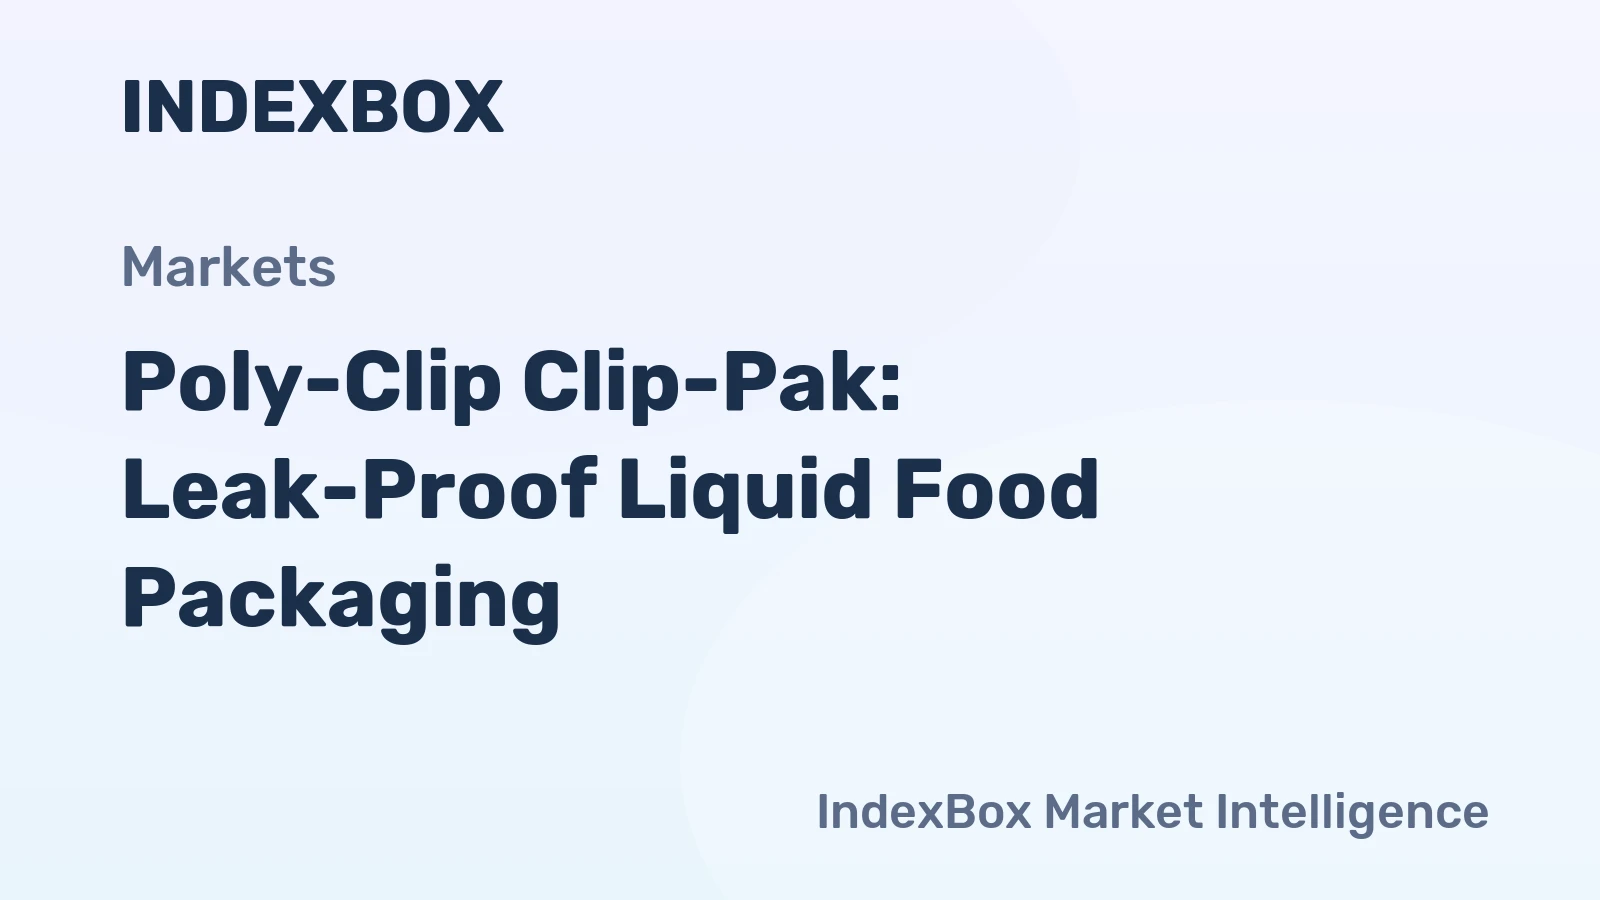
Poly-Clip's new Clip-Pak system packages liquid and paste-like foods in sealed, clipped flexible tubes, offering leak-proof portion control and extended shelf life through thermal processes.
Tennessee Waste to Jobs Act Sidelined in Committee, Sponsor Vows Return
An overview of the Tennessee Waste to Jobs Act's setback in committee, detailing the bill's provisions, opposition from industry groups, and the sponsor's commitment to revive the legislation next year.
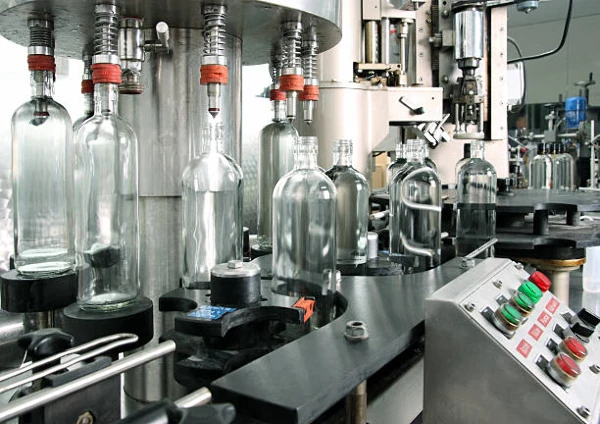
Autopack Launches Semi-Automatic Bucket Line for Enhanced Efficiency
Autopack's new semi-automatic bucket line improves efficiency for various sectors by eliminating manual bucket handling and offering modular, cost-effective automation with features like a Lid Pressure Roller and integrated weigh cell.
Best Import Markets for Filling Containers Machinery
Explore the top import markets for filling containers machinery worldwide, including the United States, China, and the United Kingdom. Get key statistics and insights from IndexBox market intelligence platform.