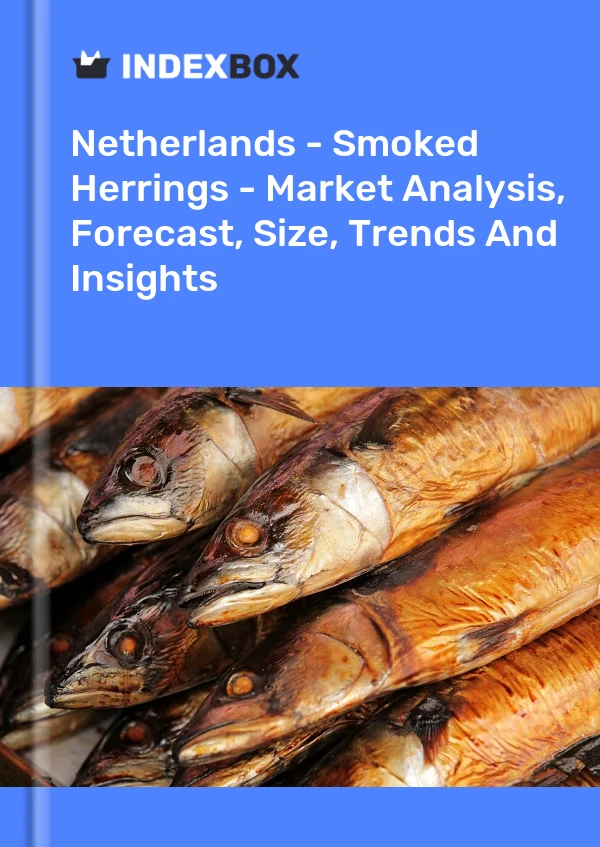
Netherlands - Smoked Herrings - Market Analysis, Forecast, Size, Trends And Insights
Get instant access to more than 2 million reports, dashboards, and datasets on the IndexBox Platform.
View PricingSmoked Herring Price in the Netherlands - 2023
Contents:
- Smoked Herring Price in the Netherlands (FOB) - 2023
- Smoked Herring Price in the Netherlands (CIF) - 2022
- Smoked Herring Exports in the Netherlands
- Smoked Herring Imports in the Netherlands
Smoked Herring Price in the Netherlands (FOB) - 2023
The average smoked herring export price stood at $4,708 per ton in July 2023, falling by -33.8% against the previous month. Over the period under review, the export price showed a mild contraction. The pace of growth appeared the most rapid in June 2023 an increase of 62% m-o-m. As a result, the export price reached the peak level of $7,110 per ton, and then dropped significantly in the following month.
Prices varied noticeably by the country of destination: the country with the highest price was the UK ($6,965 per ton), while the average price for exports to Germany ($3,957 per ton) was amongst the lowest.
From July 2022 to July 2023, the most notable rate of growth in terms of prices was recorded for supplies to Belgium (+3.7%), while the prices for the other major destinations experienced more modest paces of growth.
Smoked Herring Price in the Netherlands (CIF) - 2022
In 2022, the average smoked herring import price amounted to $4,666 per ton, dropping by -20.5% against the previous year. Over the last decade, it increased at an average annual rate of +1.6%. The pace of growth was the most pronounced in 2018 when the average import price increased by 32%. As a result, import price attained the peak level of $6,320 per ton. From 2019 to 2022, the average import prices remained at a lower figure.
Average prices varied noticeably amongst the major supplying countries. In 2022, amid the top importers, the countries with the highest prices were Canada ($5,228 per ton) and the UK ($4,500 per ton), while the price for Belgium ($4,427 per ton) and France ($4,485 per ton) were amongst the lowest.
From 2012 to 2022, the most notable rate of growth in terms of prices was attained by Belgium (+10.3%), while the prices for the other major suppliers experienced more modest paces of growth.
Smoked Herring Exports in the Netherlands
In 2022, shipments abroad of smoked herrings decreased by -31.5% to 401 tons for the first time since 2018, thus ending a three-year rising trend. Overall, exports recorded a noticeable contraction. The pace of growth was the most pronounced in 2020 with an increase of 23%.
In value terms, smoked herring exports shrank significantly to $1.6M in 2022. In general, exports saw a mild shrinkage. The growth pace was the most rapid in 2020 when exports increased by 35% against the previous year.
| Export of Smoked Herring in the Netherlands (Thousand USD) | |||||
|---|---|---|---|---|---|
| COUNTRY | 2019 | 2020 | 2021 | 2022 | CAGR, 2019-2022 |
| Germany | 550 | 650 | 616 | 492 | -3.6% |
| Greece | 628 | 962 | 868 | 428 | -12.0% |
| Spain | 165 | 134 | 266 | 297 | 21.6% |
| United Kingdom | 29.7 | 19.8 | 291 | 136 | 66.1% |
| Belgium | 125 | 171 | 135 | 110 | -4.2% |
| France | 102 | 54.8 | 15.4 | 57.4 | -17.4% |
| Italy | 9.2 | 36.6 | 41.9 | 51.0 | 77.0% |
| Canada | 58.4 | 120 | 77.2 | N/A | 15.0% |
| Others | 54.5 | 180 | 359 | 64.1 | 5.6% |
| Total | 1,722 | 2,327 | 2,670 | 1,634 | -1.7% |
Top Export Markets for Smoked Herring from the Netherlands in 2022:
- Germany (131.7 tons)
- Greece (123.7 tons)
- Spain (71.6 tons)
- Belgium (25.7 tons)
- United Kingdom (14.1 tons)
- France (12.2 tons)
- Italy (11.6 tons)
Smoked Herring Imports in the Netherlands
In 2022, purchases abroad of smoked herrings decreased by -79.6% to 36 tons, falling for the second consecutive year after two years of growth. In general, imports continue to indicate a abrupt descent. The most prominent rate of growth was recorded in 2020 when imports increased by 289%. As a result, imports attained the peak of 215 tons. From 2021 to 2022, the growth of imports failed to regain momentum.
In value terms, smoked herring imports fell notably to $170K in 2022. Over the period under review, imports continue to indicate a deep downturn. The pace of growth appeared the most rapid in 2020 when imports increased by 334% against the previous year. As a result, imports attained the peak of $1.1M. From 2021 to 2022, the growth of imports remained at a lower figure.
| Import of Smoked Herring in the Netherlands (Thousand USD) | |||||
|---|---|---|---|---|---|
| COUNTRY | 2019 | 2020 | 2021 | 2022 | CAGR, 2019-2022 |
| France | N/A | N/A | N/A | 96.0 | 0% |
| Canada | 31.7 | 860 | 1,031 | 52.8 | 18.5% |
| Belgium | 8.5 | N/A | N/A | 14.7 | 20.0% |
| United Kingdom | 196 | 145 | N/A | N/A | -26.0% |
| Others | 12.2 | 71.7 | 16.6 | 6.7 | -18.1% |
| Total | 248 | 1,077 | 1,047 | 170 | -11.8% |
Top Suppliers of Smoked Herring to the Netherlands in 2022:
- United Kingdom (undefined tons)
- France (21.4 tons)
- Canada (10.1 tons)
- Belgium (3.3 tons)
This report provides an in-depth analysis of the smoked herring market in the Netherlands. Within it, you will discover the latest data on market trends and opportunities by country, consumption, production and price developments, as well as the global trade (imports and exports). The forecast exhibits the market prospects through 2030.
Product coverage:
- Prodcom 10202455 - Smoked herrings (including fillets, excluding heads, tails and maws)
Country coverage:
- Netherlands
Data coverage:
- Market volume and value
- Per Capita consumption
- Forecast of the market dynamics in the medium term
- Trade (exports and imports) in the Netherlands
- Export and import prices
- Market trends, drivers and restraints
- Key market players and their profiles
Reasons to buy this report:
- Take advantage of the latest data
- Find deeper insights into current market developments
- Discover vital success factors affecting the market
This report is designed for manufacturers, distributors, importers, and wholesalers, as well as for investors, consultants and advisors.
In this report, you can find information that helps you to make informed decisions on the following issues:
- How to diversify your business and benefit from new market opportunities
- How to load your idle production capacity
- How to boost your sales on overseas markets
- How to increase your profit margins
- How to make your supply chain more sustainable
- How to reduce your production and supply chain costs
- How to outsource production to other countries
- How to prepare your business for global expansion
While doing this research, we combine the accumulated expertise of our analysts and the capabilities of artificial intelligence. The AI-based platform, developed by our data scientists, constitutes the key working tool for business analysts, empowering them to discover deep insights and ideas from the marketing data.
-
1. INTRODUCTION
Making Data-Driven Decisions to Grow Your Business
- REPORT DESCRIPTION
- RESEARCH METHODOLOGY AND AI PLATFORM
- DATA-DRIVEN DECISIONS FOR YOUR BUSINESS
- GLOSSARY AND SPECIFIC TERMS
-
2. EXECUTIVE SUMMARY
A Quick Overview of Market Performance
- KEY FINDINGS
- MARKET TRENDS This Chapter is Available Only for the Professional Edition PRO
-
3. MARKET OVERVIEW
Understanding the Current State of The Market and Its Prospects
- MARKET SIZE
- MARKET STRUCTURE
- TRADE BALANCE
- PER CAPITA CONSUMPTION
- MARKET FORECAST TO 2030
-
4. MOST PROMISING PRODUCT
Finding New Products to Diversify Your Business
This Chapter is Available Only for the Professional Edition PRO- TOP PRODUCTS TO DIVERSIFY YOUR BUSINESS
- BEST-SELLING PRODUCTS
- MOST CONSUMED PRODUCT
- MOST TRADED PRODUCT
- MOST PROFITABLE PRODUCT FOR EXPORT
-
5. MOST PROMISING SUPPLYING COUNTRIES
Choosing the Best Countries to Establish Your Sustainable Supply Chain
This Chapter is Available Only for the Professional Edition PRO- TOP COUNTRIES TO SOURCE YOUR PRODUCT
- TOP PRODUCING COUNTRIES
- TOP EXPORTING COUNTRIES
- LOW-COST EXPORTING COUNTRIES
-
6. MOST PROMISING OVERSEAS MARKETS
Choosing the Best Countries to Boost Your Exports
This Chapter is Available Only for the Professional Edition PRO- TOP OVERSEAS MARKETS FOR EXPORTING YOUR PRODUCT
- TOP CONSUMING MARKETS
- UNSATURATED MARKETS
- TOP IMPORTING MARKETS
- MOST PROFITABLE MARKETS
7. PRODUCTION
The Latest Trends and Insights into The Industry
- PRODUCTION VOLUME AND VALUE
8. IMPORTS
The Largest Import Supplying Countries
- IMPORTS FROM 2012–2023
- IMPORTS BY COUNTRY
- IMPORT PRICES BY COUNTRY
9. EXPORTS
The Largest Destinations for Exports
- EXPORTS FROM 2012–2023
- EXPORTS BY COUNTRY
- EXPORT PRICES BY COUNTRY
-
10. PROFILES OF MAJOR PRODUCERS
The Largest Producers on The Market and Their Profiles
This Chapter is Available Only for the Professional Edition PRO -
LIST OF TABLES
- Key Findings In 2023
- Market Volume, In Physical Terms, 2012–2023
- Market Value, 2012–2023
- Per Capita Consumption In 2012-2023
- Imports, In Physical Terms, By Country, 2012–2023
- Imports, In Value Terms, By Country, 2012–2023
- Import Prices, By Country Of Origin, 2012–2023
- Exports, In Physical Terms, By Country, 2012–2023
- Exports, In Value Terms, By Country, 2012–2023
- Export Prices, By Country Of Destination, 2012–2023
-
LIST OF FIGURES
- Market Volume, In Physical Terms, 2012–2023
- Market Value, 2012–2023
- Market Structure – Domestic Supply vs. Imports, In Physical Terms, 2012-2023
- Market Structure – Domestic Supply vs. Imports, In Value Terms, 2012-2023
- Trade Balance, In Physical Terms, 2012-2023
- Trade Balance, In Value Terms, 2012-2023
- Per Capita Consumption, 2012-2023
- Market Volume Forecast to 2030
- Market Value Forecast to 2030
- Products: Market Size And Growth, By Type
- Products: Average Per Capita Consumption, By Type
- Products: Exports And Growth, By Type
- Products: Export Prices And Growth, By Type
- Production Volume And Growth
- Exports And Growth
- Export Prices And Growth
- Market Size And Growth
- Per Capita Consumption
- Imports And Growth
- Import Prices
- Production, In Physical Terms, 2012–2023
- Production, In Value Terms, 2012–2023
- Imports, In Physical Terms, 2012–2023
- Imports, In Value Terms, 2012–2023
- Imports, In Physical Terms, By Country, 2023
- Imports, In Physical Terms, By Country, 2012–2023
- Imports, In Value Terms, By Country, 2012–2023
- Import Prices, By Country Of Origin, 2012–2023
- Exports, In Physical Terms, 2012–2023
- Exports, In Value Terms, 2012–2023
- Exports, In Physical Terms, By Country, 2023
- Exports, In Physical Terms, By Country, 2012–2023
- Exports, In Value Terms, By Country, 2012–2023
- Export Prices, By Country Of Destination, 2012–2023
This report provides an in-depth analysis of the smoked herring market in the Netherlands.
This report provides an in-depth analysis of the market for dried or smoked fish in the Netherlands.
This report provides an in-depth analysis of the market for cod, salted or in brine in the Netherlands.
This report provides an in-depth analysis of the market for herring, salted or in brine in the Netherlands.
This report provides an in-depth analysis of the market for dried cod, whether or not salted in the Netherlands.
This report provides an in-depth analysis of the market for dried or salted fish in the Netherlands.
This report provides an in-depth analysis of the smoked salmon market in the Netherlands.
This report provides an in-depth analysis of the market for smoked fish other than salmon and herring in the Netherlands.
This report provides an in-depth analysis of the market for fish meals and pellet in the Netherlands.
This report provides an in-depth analysis of the fish parts market in the Netherlands.
In September 2023, there was a significant decline in overall exports, but the export of Smoked Herring saw a remarkable increase with a value of $197K.
In May 2023, the price of Fish Parts was $4,473 per ton (CIF, Netherlands), showing a decrease of 21.7% compared to the previous month.
In September 2023, there was a significant decline in overall exports, but the export of Smoked Herring saw a remarkable increase with a value of $197K.
In May 2023, the price of Fish Parts was $4,473 per ton (CIF, Netherlands), showing a decrease of 21.7% compared to the previous month.


