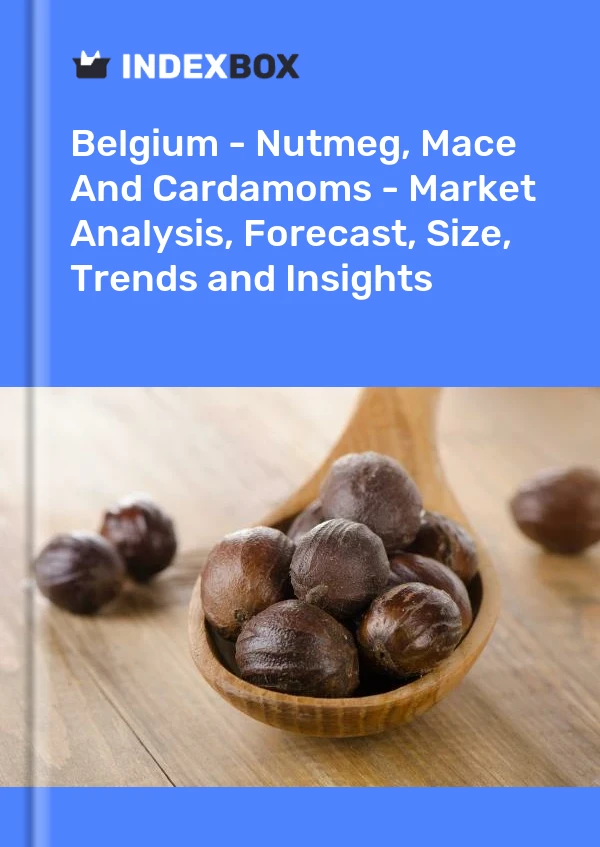
Belgium - Nutmeg, Mace And Cardamoms - Market Analysis, Forecast, Size, Trends and Insights
Get instant access to more than 2 million reports, dashboards, and datasets on the IndexBox Platform.
View PricingPrice for Nutmeg, Mace and Cardamom in Belgium - 2023
Contents:
- Price for Nutmeg, Mace and Cardamom in Belgium (CIF) - 2023
- Price for Nutmeg, Mace and Cardamom in Belgium (FOB) - 2023
- Imports of Nutmeg, Mace and Cardamom in Belgium
- Exports of Nutmeg, Mace and Cardamom in Belgium
Price for Nutmeg, Mace and Cardamom in Belgium (CIF) - 2023
The average nutmeg, mace and cardamom import price stood at $13,795 per ton in July 2023, declining by -4.9% against the previous month. Over the period from July 2022 to July 2023, it increased at an average monthly rate of +1.8%. The growth pace was the most rapid in June 2023 when the average import price increased by 103% month-to-month. As a result, import price attained the peak level of $14,512 per ton, and then shrank modestly in the following month.
Prices varied noticeably by the country of origin: the country with the highest price was France ($72,924 per ton), while the price for the Netherlands ($13,062 per ton) was amongst the lowest.
From July 2022 to July 2023, the most notable rate of growth in terms of prices was attained by France (+6.8%), while the prices for the other major suppliers experienced more modest paces of growth.
Price for Nutmeg, Mace and Cardamom in Belgium (FOB) - 2023
In July 2023, the average nutmeg, mace and cardamom export price amounted to $15,873 per ton, rising by 33% against the previous month. Overall, the export price showed a relatively flat trend pattern. The pace of growth was the most pronounced in April 2023 when the average export price increased by 67% m-o-m. Over the period under review, the average export prices reached the maximum at $18,031 per ton in November 2022; however, from December 2022 to July 2023, the export prices remained at a lower figure.
Prices varied noticeably by the country of destination: the country with the highest price was the Netherlands ($18,370 per ton), while the average price for exports to Poland ($10,930 per ton) was amongst the lowest.
From July 2022 to July 2023, the most notable rate of growth in terms of prices was recorded for supplies to Democratic Republic of the Congo (+3.3%), while the prices for the other major destinations experienced more modest paces of growth.
Imports of Nutmeg, Mace and Cardamom in Belgium
After three years of growth, overseas purchases of nutmeg, mace and cardamoms decreased by -24.9% to 692 tons in 2022. In general, total imports indicated a prominent increase from 2019 to 2022: its volume increased at an average annual rate of +6.8% over the last three years. The trend pattern, however, indicated some noticeable fluctuations being recorded throughout the analyzed period. The growth pace was the most rapid in 2020 when imports increased by 34%.
In value terms, nutmeg, mace and cardamom imports shrank dramatically to $8.5M in 2022. Over the period under review, total imports indicated a strong increase from 2019 to 2022: its value increased at an average annual rate of +13.7% over the last three years. The trend pattern, however, indicated some noticeable fluctuations being recorded throughout the analyzed period. Based on 2022 figures, imports increased by +47.0% against 2019 indices. The growth pace was the most rapid in 2020 when imports increased by 41% against the previous year.
| Import of Nutmeg, Mace and Cardamom in Belgium (Million USD) | |||||
|---|---|---|---|---|---|
| COUNTRY | 2019 | 2020 | 2021 | 2022 | CAGR, 2019-2022 |
| Netherlands | 3.1 | 4.3 | 6.7 | 5.5 | 21.1% |
| Germany | 0.2 | 0.5 | 1.1 | 1.0 | 71.0% |
| Indonesia | 2.1 | 2.4 | 1.5 | 0.9 | -24.6% |
| Italy | N/A | N/A | 0.1 | 0.3 | 200.0% |
| France | 0.2 | 0.3 | 0.3 | 0.2 | 0.0% |
| Grenada | N/A | 0.2 | 0.2 | N/A | 0.0% |
| Others | 0.2 | 0.4 | 0.5 | 0.6 | 44.2% |
| Total | 5.8 | 8.1 | 10.2 | 8.5 | 13.6% |
Top Suppliers of Nutmeg, Mace and Cardamom to Belgium in 2022:
- Netherlands (483.7 tons)
- Indonesia (73.7 tons)
- Germany (66.1 tons)
- Italy (22.4 tons)
- France (17.7 tons)
- Grenada (4.8 tons)
Exports of Nutmeg, Mace and Cardamom in Belgium
In 2022, shipments abroad of nutmeg, mace and cardamoms decreased by -25.4% to 353 tons for the first time since 2018, thus ending a three-year rising trend. Over the period under review, total exports indicated a resilient expansion from 2019 to 2022: its volume increased at an average annual rate of +15.0% over the last three-year period. The trend pattern, however, indicated some noticeable fluctuations being recorded throughout the analyzed period. The growth pace was the most rapid in 2020 when exports increased by 68%.
In value terms, nutmeg, mace and cardamom exports reduced to $5M in 2022. Overall, total exports indicated a significant expansion from 2019 to 2022: its value increased at an average annual rate of +20.4% over the last three years. The trend pattern, however, indicated some noticeable fluctuations being recorded throughout the analyzed period. Based on 2022 figures, exports increased by +74.7% against 2019 indices. The pace of growth appeared the most rapid in 2020 when exports increased by 56% against the previous year.
| Export of Nutmeg, Mace and Cardamom in Belgium (Thousand USD) | |||||
|---|---|---|---|---|---|
| COUNTRY | 2019 | 2020 | 2021 | 2022 | CAGR, 2019-2022 |
| Netherlands | 746 | 1,653 | 1,898 | 1,703 | 31.7% |
| Germany | 167 | 352 | 689 | 1,114 | 88.2% |
| France | 872 | 1,078 | 1,301 | 1,101 | 8.1% |
| Democratic Republic of the Congo | 170 | 224 | 232 | 355 | 27.8% |
| United Kingdom | 533 | 816 | 1,136 | 246 | -22.7% |
| Portugal | 93.9 | N/A | N/A | 131 | 11.7% |
| Poland | N/A | N/A | 7.8 | 79.0 | 912.8% |
| Others | 269 | 312 | 538 | 250 | -2.4% |
| Total | 2,850 | 4,435 | 5,800 | 4,979 | 20.4% |
Top Export Markets for Nutmeg, Mace and Cardamom from Belgium in 2022:
- Netherlands (121.9 tons)
- France (80.2 tons)
- Germany (66.2 tons)
- Democratic Republic of the Congo (31.9 tons)
- United Kingdom (20.5 tons)
- Portugal (10.0 tons)
- Poland (7.3 tons)
This report provides an in-depth analysis of the market for nutmeg, mace and cardamom in Belgium. Within it, you will discover the latest data on market trends and opportunities by country, consumption, production and price developments, as well as the global trade (imports and exports). The forecast exhibits the market prospects through 2030.
Product coverage:
- FCL 702 - Nutmeg, mace, cardamoms
Country coverage:
- Belgium
Data coverage:
- Market volume and value
- Per Capita consumption
- Forecast of the market dynamics in the medium term
- Trade (exports and imports) in Belgium
- Export and import prices
- Market trends, drivers and restraints
- Key market players and their profiles
Reasons to buy this report:
- Take advantage of the latest data
- Find deeper insights into current market developments
- Discover vital success factors affecting the market
This report is designed for manufacturers, distributors, importers, and wholesalers, as well as for investors, consultants and advisors.
In this report, you can find information that helps you to make informed decisions on the following issues:
- How to diversify your business and benefit from new market opportunities
- How to load your idle production capacity
- How to boost your sales on overseas markets
- How to increase your profit margins
- How to make your supply chain more sustainable
- How to reduce your production and supply chain costs
- How to outsource production to other countries
- How to prepare your business for global expansion
While doing this research, we combine the accumulated expertise of our analysts and the capabilities of artificial intelligence. The AI-based platform, developed by our data scientists, constitutes the key working tool for business analysts, empowering them to discover deep insights and ideas from the marketing data.
-
1. INTRODUCTION
Making Data-Driven Decisions to Grow Your Business
- REPORT DESCRIPTION
- RESEARCH METHODOLOGY AND AI PLATFORM
- DATA-DRIVEN DECISIONS FOR YOUR BUSINESS
- GLOSSARY AND SPECIFIC TERMS
-
2. EXECUTIVE SUMMARY
A Quick Overview of Market Performance
- KEY FINDINGS
- MARKET TRENDS This Chapter is Available Only for the Professional Edition PRO
-
3. MARKET OVERVIEW
Understanding the Current State of The Market and Its Prospects
- MARKET SIZE
- MARKET STRUCTURE
- TRADE BALANCE
- PER CAPITA CONSUMPTION
- MARKET FORECAST TO 2030
-
4. MOST PROMISING PRODUCT
Finding New Products to Diversify Your Business
This Chapter is Available Only for the Professional Edition PRO- TOP PRODUCTS TO DIVERSIFY YOUR BUSINESS
- BEST-SELLING PRODUCTS
- MOST CONSUMED PRODUCT
- MOST TRADED PRODUCT
- MOST PROFITABLE PRODUCT FOR EXPORT
-
5. MOST PROMISING SUPPLYING COUNTRIES
Choosing the Best Countries to Establish Your Sustainable Supply Chain
This Chapter is Available Only for the Professional Edition PRO- TOP COUNTRIES TO SOURCE YOUR PRODUCT
- TOP PRODUCING COUNTRIES
- COUNTRIES WITH TOP YIELDS
- TOP EXPORTING COUNTRIES
- LOW-COST EXPORTING COUNTRIES
-
6. MOST PROMISING OVERSEAS MARKETS
Choosing the Best Countries to Boost Your Exports
This Chapter is Available Only for the Professional Edition PRO- TOP OVERSEAS MARKETS FOR EXPORTING YOUR PRODUCT
- TOP CONSUMING MARKETS
- UNSATURATED MARKETS
- TOP IMPORTING MARKETS
- MOST PROFITABLE MARKETS
7. PRODUCTION
The Latest Trends and Insights into The Industry
- PRODUCTION, HARVESTED AREA AND YIELD
8. IMPORTS
The Largest Import Supplying Countries
- IMPORTS FROM 2012–2023
- IMPORTS BY COUNTRY
- IMPORT PRICES BY COUNTRY
9. EXPORTS
The Largest Destinations for Exports
- EXPORTS FROM 2012–2023
- EXPORTS BY COUNTRY
- EXPORT PRICES BY COUNTRY
-
10. PROFILES OF MAJOR PRODUCERS
The Largest Producers on The Market and Their Profiles
This Chapter is Available Only for the Professional Edition PRO -
LIST OF TABLES
- Key Findings In 2023
- Market Volume, In Physical Terms, 2012–2023
- Market Value, 2012–2023
- Per Capita Consumption In 2012-2023
- Imports, In Physical Terms, By Country, 2012–2023
- Imports, In Value Terms, By Country, 2012–2023
- Import Prices, By Country Of Origin, 2012–2023
- Exports, In Physical Terms, By Country, 2012–2023
- Exports, In Value Terms, By Country, 2012–2023
- Export Prices, By Country Of Destination, 2012–2023
-
LIST OF FIGURES
- Market Volume, In Physical Terms, 2012–2023
- Market Value, 2012–2023
- Market Structure – Domestic Supply vs. Imports, In Physical Terms, 2012-2023
- Market Structure – Domestic Supply vs. Imports, In Value Terms, 2012-2023
- Trade Balance, In Physical Terms, 2012-2023
- Trade Balance, In Value Terms, 2012-2023
- Per Capita Consumption, 2012-2023
- Market Volume Forecast to 2030
- Market Value Forecast to 2030
- Products: Market Size And Growth, By Type
- Products: Average Per Capita Consumption, By Type
- Products: Exports And Growth, By Type
- Products: Export Prices And Growth, By Type
- Production Volume And Growth
- Yield And Growth
- Exports And Growth
- Export Prices And Growth
- Market Size And Growth
- Per Capita Consumption
- Imports And Growth
- Import Prices
- Production, In Physical Terms, 2012–2023
- Production, In Value Terms, 2012–2023
- Area Harvested, 2012–2023
- Yield, 2012–2023
- Imports, In Physical Terms, 2012–2023
- Imports, In Value Terms, 2012–2023
- Imports, In Physical Terms, By Country, 2023
- Imports, In Physical Terms, By Country, 2012–2023
- Imports, In Value Terms, By Country, 2012–2023
- Import Prices, By Country Of Origin, 2012–2023
- Exports, In Physical Terms, 2012–2023
- Exports, In Value Terms, 2012–2023
- Exports, In Physical Terms, By Country, 2023
- Exports, In Physical Terms, By Country, 2012–2023
- Exports, In Value Terms, By Country, 2012–2023
- Export Prices, By Country Of Destination, 2012–2023
This report provides an in-depth analysis of the market for nutmeg, mace and cardamom in Belgium.
This report provides an in-depth analysis of the global market for nutmeg, mace and cardamom.
This report provides an in-depth analysis of the market for nutmeg, mace and cardamom in Belgium.
This report provides an in-depth analysis of the global market for nutmeg, mace and cardamom.
In 2016, the nutmeg, mace and cardamom market peaked at X tons. Over the period from 2007 to 2016, consumption expanded with an annual average rate of growth of +X%. Following a slight decline in consumption from 2009-2010, the nutmeg, mace and
In 2015, the countries with the highest levels of production in 2015 were Guatemala (X thousand tons), Indonesia (X thousand tons), India (X thousand tons), together accounting for X% of total output.
Guatemala continued its dominance in the global trade of nutmeg, mace and cardamom. In 2014, Guatemala exported X thousand tons of nutmeg, mace and cardamoms totaling X USD, X% over the previous year. Its primary trading partner was Saudi Arabia,


