Norway - Remelting Scrap Ingots Of Iron Or Steel - Market Analysis, Forecast, Size, Trends And Insights
Get instant access to more than 2 million reports, dashboards, and datasets on the IndexBox Platform.
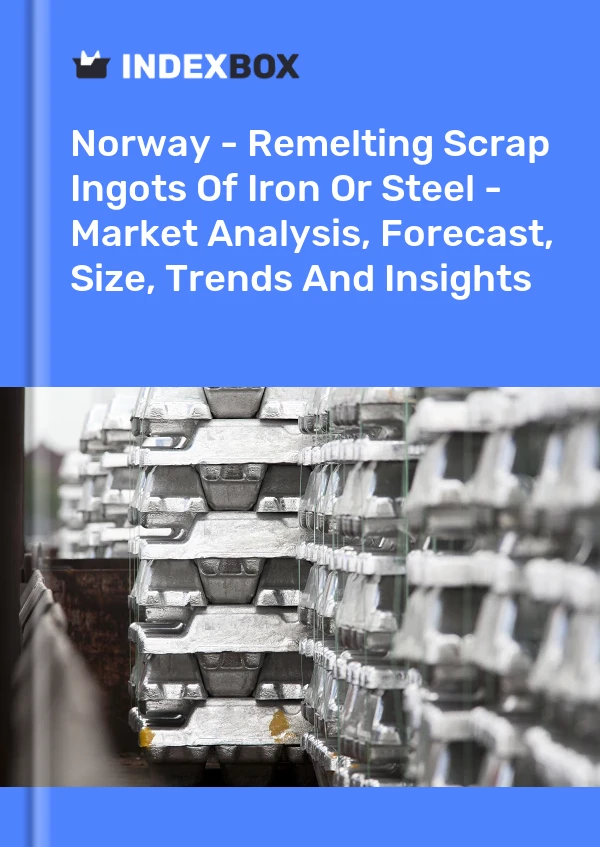
View PricingPrice for Metal Remelting Scrap Ingots in Norway - 2023
Contents:
- Price for Metal Remelting Scrap Ingots in Norway (CIF) - 2022
- Price for Metal Remelting Scrap Ingots in Norway (FOB) - 2022
- Imports of Metal Remelting Scrap Ingots in Norway
- Exports of Metal Remelting Scrap Ingots in Norway
Price for Metal Remelting Scrap Ingots in Norway (CIF) - 2022
In 2022, the average metal remelting scrap ingots import price amounted to $5,548 per ton, rising by 20% against the previous year. Over the period under review, the import price recorded a relatively flat trend pattern. The pace of growth appeared the most rapid in 2013 an increase of 94% against the previous year. As a result, import price attained the peak level of $9,945 per ton. From 2014 to 2022, the average import prices remained at a somewhat lower figure.
There were significant differences in the average prices amongst the major supplying countries. In 2022, amid the top importers, the country with the highest price was the UK ($7,485 per ton), while the price for Denmark ($596 per ton) was amongst the lowest.
From 2012 to 2022, the most notable rate of growth in terms of prices was attained by Sweden (+6.7%), while the prices for the other major suppliers experienced more modest paces of growth.
Price for Metal Remelting Scrap Ingots in Norway (FOB) - 2022
The average metal remelting scrap ingots export price stood at $145 per ton in 2022, dropping by -37.9% against the previous year. In general, the export price recorded a abrupt shrinkage. The pace of growth appeared the most rapid in 2015 an increase of 112%. The export price peaked at $1,024 per ton in 2012; however, from 2013 to 2022, the export prices failed to regain momentum.
There were significant differences in the average prices for the major export markets. In 2022, amid the top suppliers, the country with the highest price was Pakistan ($170 per ton), while the average price for exports to Lithuania stood at $26 per ton.
From 2012 to 2022, the most notable rate of growth in terms of prices was recorded for supplies to Pakistan (-8.7%), while the prices for the other major destinations experienced a decline.
Imports of Metal Remelting Scrap Ingots in Norway
In 2022, overseas purchases of remelting scrap ingots of iron or steel decreased by -58.8% to 53 tons, falling for the second year in a row after two years of growth. Overall, imports recorded a dramatic curtailment. The pace of growth was the most pronounced in 2020 when imports increased by 122% against the previous year. As a result, imports attained the peak of 430 tons. From 2021 to 2022, the growth of imports failed to regain momentum.
In value terms, metal remelting scrap ingots imports declined markedly to $296K in 2022. Over the period under review, imports faced a dramatic decrease. The pace of growth was the most pronounced in 2020 with an increase of 154% against the previous year. As a result, imports attained the peak of $2.4M. From 2021 to 2022, the growth of imports failed to regain momentum.
| Import of Metal Remelting Scrap Ingots in Norway (Thousand USD) | |||||
|---|---|---|---|---|---|
| COUNTRY | 2019 | 2020 | 2021 | 2022 | CAGR, 2019-2022 |
| United Kingdom | 429 | 1,059 | 72.2 | 153 | -29.1% |
| Sweden | 1.3 | 208 | 181 | 72.1 | 281.4% |
| Finland | 484 | 1,096 | 154 | 67.5 | -48.1% |
| Denmark | 1.6 | 7.5 | 10.3 | 4.1 | 36.8% |
| Spain | 23.3 | N/A | N/A | N/A | 0% |
| Others | N/A | 18.0 | 179 | N/A | 894.4% |
| Total | 939 | 2,389 | 597 | 296 | -31.9% |
Top Suppliers of Metal Remelting Scrap Ingots to Norway in 2022:
- United Kingdom (20.4 tons)
- Finland (13.5 tons)
- Sweden (12.7 tons)
- Denmark (6.8 tons)
Exports of Metal Remelting Scrap Ingots in Norway
In 2022, the amount of remelting scrap ingots of iron or steel exported from Norway surged to 93 tons, rising by 55% on the previous year. Over the period under review, exports, however, faced a precipitous shrinkage.
In value terms, metal remelting scrap ingots exports dropped modestly to $13K in 2022. Overall, exports, however, recorded a precipitous decline. The most prominent rate of growth was recorded in 2021 with an increase of 8.4%.
| Export of Metal Remelting Scrap Ingots in Norway (Thousand USD) | |||||
|---|---|---|---|---|---|
| COUNTRY | 2019 | 2020 | 2021 | 2022 | CAGR, 2019-2022 |
| Pakistan | 229 | 12.5 | 13.4 | 12.9 | -61.7% |
| Lithuania | 15.1 | 0.1 | 0.5 | 0.4 | -70.2% |
| Estonia | N/A | 0.2 | N/A | N/A | 0% |
| Others | 5.4 | 0.1 | N/A | 0.1 | -73.5% |
| Total | 250 | 12.9 | 14.0 | 13.5 | -62.2% |
Top Export Markets for Metal Remelting Scrap Ingots from Norway in 2022:
- Pakistan (76.0 tons)
- Lithuania (16.9 tons)
This report provides an in-depth analysis of the market for metal remelting scrap ingots in Norway. Within it, you will discover the latest data on market trends and opportunities by country, consumption, production and price developments, as well as the global trade (imports and exports). The forecast exhibits the market prospects through 2030.
Product coverage:
- Prodcom 24101420 - Remelting scrap ingots of iron or steel (excluding products whose chemical composition conforms to the definitions of pig iron, spiegeleisen, or ferro-alloys)
Country coverage:
- Norway
Data coverage:
- Market volume and value
- Per Capita consumption
- Forecast of the market dynamics in the medium term
- Trade (exports and imports) in Norway
- Export and import prices
- Market trends, drivers and restraints
- Key market players and their profiles
Reasons to buy this report:
- Take advantage of the latest data
- Find deeper insights into current market developments
- Discover vital success factors affecting the market
This report is designed for manufacturers, distributors, importers, and wholesalers, as well as for investors, consultants and advisors.
In this report, you can find information that helps you to make informed decisions on the following issues:
- How to diversify your business and benefit from new market opportunities
- How to load your idle production capacity
- How to boost your sales on overseas markets
- How to increase your profit margins
- How to make your supply chain more sustainable
- How to reduce your production and supply chain costs
- How to outsource production to other countries
- How to prepare your business for global expansion
While doing this research, we combine the accumulated expertise of our analysts and the capabilities of artificial intelligence. The AI-based platform, developed by our data scientists, constitutes the key working tool for business analysts, empowering them to discover deep insights and ideas from the marketing data.
-
1. INTRODUCTION
Making Data-Driven Decisions to Grow Your Business
- REPORT DESCRIPTION
- RESEARCH METHODOLOGY AND AI PLATFORM
- DATA-DRIVEN DECISIONS FOR YOUR BUSINESS
- GLOSSARY AND SPECIFIC TERMS
-
2. EXECUTIVE SUMMARY
A Quick Overview of Market Performance
- KEY FINDINGS
- MARKET TRENDS This Chapter is Available Only for the Professional Edition PRO
-
3. MARKET OVERVIEW
Understanding the Current State of The Market and Its Prospects
- MARKET SIZE
- MARKET STRUCTURE
- TRADE BALANCE
- PER CAPITA CONSUMPTION
- MARKET FORECAST TO 2030
-
4. MOST PROMISING PRODUCT
Finding New Products to Diversify Your Business
This Chapter is Available Only for the Professional Edition PRO- TOP PRODUCTS TO DIVERSIFY YOUR BUSINESS
- BEST-SELLING PRODUCTS
- MOST CONSUMED PRODUCT
- MOST TRADED PRODUCT
- MOST PROFITABLE PRODUCT FOR EXPORT
-
5. MOST PROMISING SUPPLYING COUNTRIES
Choosing the Best Countries to Establish Your Sustainable Supply Chain
This Chapter is Available Only for the Professional Edition PRO- TOP COUNTRIES TO SOURCE YOUR PRODUCT
- TOP PRODUCING COUNTRIES
- TOP EXPORTING COUNTRIES
- LOW-COST EXPORTING COUNTRIES
-
6. MOST PROMISING OVERSEAS MARKETS
Choosing the Best Countries to Boost Your Exports
This Chapter is Available Only for the Professional Edition PRO- TOP OVERSEAS MARKETS FOR EXPORTING YOUR PRODUCT
- TOP CONSUMING MARKETS
- UNSATURATED MARKETS
- TOP IMPORTING MARKETS
- MOST PROFITABLE MARKETS
7. PRODUCTION
The Latest Trends and Insights into The Industry
- PRODUCTION VOLUME AND VALUE
8. IMPORTS
The Largest Import Supplying Countries
- IMPORTS FROM 2012–2023
- IMPORTS BY COUNTRY
- IMPORT PRICES BY COUNTRY
9. EXPORTS
The Largest Destinations for Exports
- EXPORTS FROM 2012–2023
- EXPORTS BY COUNTRY
- EXPORT PRICES BY COUNTRY
-
10. PROFILES OF MAJOR PRODUCERS
The Largest Producers on The Market and Their Profiles
This Chapter is Available Only for the Professional Edition PRO -
LIST OF TABLES
- Key Findings In 2023
- Market Volume, In Physical Terms, 2012–2023
- Market Value, 2012–2023
- Per Capita Consumption In 2012-2023
- Imports, In Physical Terms, By Country, 2012–2023
- Imports, In Value Terms, By Country, 2012–2023
- Import Prices, By Country Of Origin, 2012–2023
- Exports, In Physical Terms, By Country, 2012–2023
- Exports, In Value Terms, By Country, 2012–2023
- Export Prices, By Country Of Destination, 2012–2023
-
LIST OF FIGURES
- Market Volume, In Physical Terms, 2012–2023
- Market Value, 2012–2023
- Market Structure – Domestic Supply vs. Imports, In Physical Terms, 2012-2023
- Market Structure – Domestic Supply vs. Imports, In Value Terms, 2012-2023
- Trade Balance, In Physical Terms, 2012-2023
- Trade Balance, In Value Terms, 2012-2023
- Per Capita Consumption, 2012-2023
- Market Volume Forecast to 2030
- Market Value Forecast to 2030
- Products: Market Size And Growth, By Type
- Products: Average Per Capita Consumption, By Type
- Products: Exports And Growth, By Type
- Products: Export Prices And Growth, By Type
- Production Volume And Growth
- Exports And Growth
- Export Prices And Growth
- Market Size And Growth
- Per Capita Consumption
- Imports And Growth
- Import Prices
- Production, In Physical Terms, 2012–2023
- Production, In Value Terms, 2012–2023
- Imports, In Physical Terms, 2012–2023
- Imports, In Value Terms, 2012–2023
- Imports, In Physical Terms, By Country, 2023
- Imports, In Physical Terms, By Country, 2012–2023
- Imports, In Value Terms, By Country, 2012–2023
- Import Prices, By Country Of Origin, 2012–2023
- Exports, In Physical Terms, 2012–2023
- Exports, In Value Terms, 2012–2023
- Exports, In Physical Terms, By Country, 2023
- Exports, In Physical Terms, By Country, 2012–2023
- Exports, In Value Terms, By Country, 2012–2023
- Export Prices, By Country Of Destination, 2012–2023
This report provides an in-depth analysis of the market for metal remelting scrap ingots in Norway.
This report provides an in-depth analysis of the global market for metal remelting scrap ingots.
This report provides an in-depth analysis of the market for metal remelting scrap ingots in Norway.
This report provides an in-depth analysis of the global market for metal remelting scrap ingots.
Nothing found. Please try again.


