Spain - Milking Machines - Market Analysis, Forecast, Size, Trends and Insights
Get instant access to more than 2 million reports, dashboards, and datasets on the IndexBox Platform.
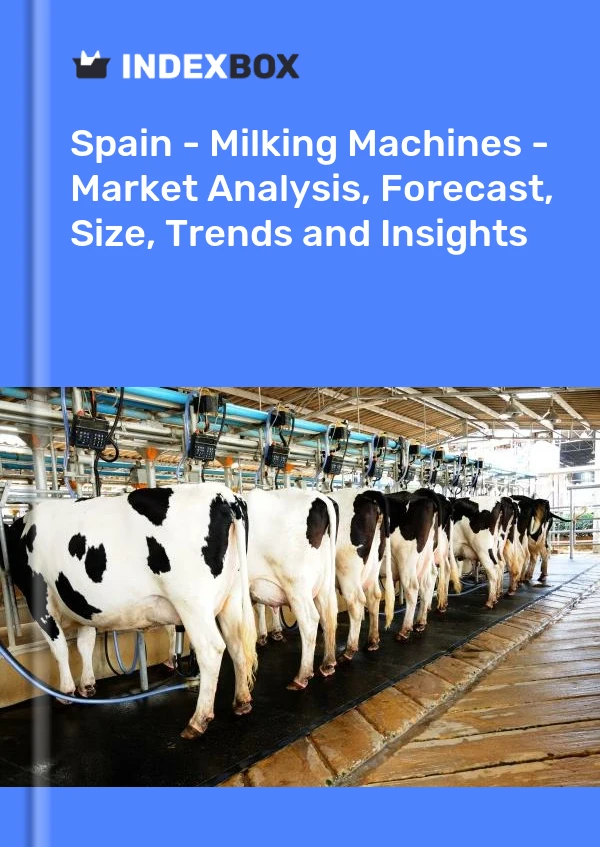
View PricingMilking Machine Price in Spain - 2023
Contents:
- Milking Machine Price in Spain (CIF) - 2023
- Milking Machine Price in Spain (FOB) - 2022
- Milking Machine Imports in Spain
- Milking Machine Exports in Spain
Milking Machine Price in Spain (CIF) - 2023
In August 2023, the average milking machine import price amounted to $2,401 per unit, declining by -36.3% against the previous month. Over the period under review, the import price, however, enjoyed a strong increase. The most prominent rate of growth was recorded in September 2022 an increase of 72% against the previous month. The import price peaked at $6,808 per unit in April 2023; afterwards, it flattened through to August 2023.
Prices varied noticeably by the country of origin: the country with the highest price was Israel ($9,232 per unit), while the price for New Zealand ($437 per unit) was amongst the lowest.
From August 2022 to August 2023, the most notable rate of growth in terms of prices was attained by the Netherlands (+3.6%), while the prices for the other major suppliers experienced more modest paces of growth.
Milking Machine Price in Spain (FOB) - 2022
In 2022, the average milking machine export price amounted to $7,606 per unit, surging by 374% against the previous year. Over the period under review, the export price posted prominent growth. As a result, the export price attained the peak level and is likely to continue growth in the immediate term.
Prices varied noticeably by country of destination: amid the top suppliers, the country with the highest price was Canada ($17,620 per unit), while the average price for exports to Cuba ($244 per unit) was amongst the lowest.
From 2012 to 2022, the most notable rate of growth in terms of prices was recorded for supplies to the UK (+31.3%), while the prices for the other major destinations experienced more modest paces of growth.
Milking Machine Imports in Spain
In 2022, the amount of milking machines imported into Spain contracted to 1.9K units, reducing by -8.6% against the year before. In general, imports continue to indicate a relatively flat trend pattern. The pace of growth was the most pronounced in 2021 when imports increased by 42% against the previous year. As a result, imports reached the peak of 2.1K units, and then declined in the following year.
In value terms, milking machine imports declined to $5.1M in 2022. Over the period under review, imports recorded a abrupt slump. The most prominent rate of growth was recorded in 2021 when imports increased by 14% against the previous year. Imports peaked at $7.2M in 2019; however, from 2020 to 2022, imports stood at a somewhat lower figure.
| Import of Milking Machine in Spain (Thousand USD) | |||||
|---|---|---|---|---|---|
| COUNTRY | 2019 | 2020 | 2021 | 2022 | CAGR, 2019-2022 |
| Sweden | 2,287 | 2,034 | 2,262 | 2,152 | -2.0% |
| Netherlands | 2,207 | 1,767 | 2,395 | 2,116 | -1.4% |
| Australia | 93.6 | 92.7 | 170 | 431 | 66.4% |
| Germany | 1,111 | 599 | 375 | 230 | -40.8% |
| Turkey | 64.4 | 50.0 | 48.1 | 57.8 | -3.5% |
| New Zealand | N/A | 14.9 | 160 | 3.1 | -54.4% |
| China | 586 | 34.2 | 16.7 | 2.2 | -84.5% |
| Others | 863 | 322 | 185 | 113 | -49.2% |
| Total | 7,212 | 4,914 | 5,612 | 5,105 | -10.9% |
Top Suppliers of Milking Machine to Spain in 2022:
- Australia (881.0 units)
- Sweden (503.0 units)
- Netherlands (350.0 units)
- Turkey (78.0 units)
- Germany (71.0 units)
- New Zealand (8.0 units)
- China (1.0 units)
Milking Machine Exports in Spain
In 2022, the amount of milking machines exported from Spain declined markedly to 7 units, with a decrease of -90.8% compared with 2021 figures. Overall, exports recorded a precipitous decrease. The smallest decline of -2.2% was in 2020. Over the period under review, the exports attained the peak figure at 401 units in 2019; however, from 2020 to 2022, the exports failed to regain momentum.
In value terms, milking machine exports contracted significantly to $57K in 2022. In general, exports recorded a sharp reduction. The smallest decline of -40.9% was in 2020. The exports peaked at $768K in 2019; however, from 2020 to 2022, the exports remained at a lower figure.
| Export of Milking Machine in Spain (Thousand USD) | |||||
|---|---|---|---|---|---|
| COUNTRY | 2019 | 2020 | 2021 | 2022 | CAGR, 2019-2022 |
| Canada | 7.2 | 3.5 | N/A | 26.5 | 54.4% |
| Israel | 40.7 | 9.5 | N/A | 13.4 | -30.9% |
| United Kingdom | N/A | N/A | N/A | 12.4 | 0% |
| Dominican Republic | N/A | N/A | N/A | 4.1 | 0% |
| Cuba | N/A | N/A | N/A | 0.5 | 0% |
| United States | 215 | N/A | 75.6 | N/A | -40.7% |
| Chile | 72.8 | 4.0 | N/A | N/A | -94.5% |
| Senegal | 4.6 | N/A | N/A | N/A | 0% |
| Morocco | 83.3 | 188 | 28.1 | N/A | -41.9% |
| North Macedonia | 22.4 | N/A | N/A | N/A | 0% |
| Colombia | 295 | N/A | N/A | N/A | 0% |
| Brazil | N/A | 219 | N/A | N/A | 0% |
| Others | 27.4 | 30.1 | 18.7 | N/A | -17.4% |
| Total | 768 | 454 | 122 | 57.0 | -58.0% |
Top Export Markets for Milking Machine from Spain in 2022:
- Canada (2.0 units)
- Israel (2.0 units)
- Cuba (2.0 units)
- United Kingdom (1.0 units)
- Dominican Republic (1.0 units)
This report provides an in-depth analysis of the milking machine market in Spain. Within it, you will discover the latest data on market trends and opportunities by country, consumption, production and price developments, as well as the global trade (imports and exports). The forecast exhibits the market prospects through 2030.
Product coverage:
- Prodcom 28308200 - Milking machines
Country coverage:
- Spain
Data coverage:
- Market volume and value
- Per Capita consumption
- Forecast of the market dynamics in the medium term
- Trade (exports and imports) in Spain
- Export and import prices
- Market trends, drivers and restraints
- Key market players and their profiles
Reasons to buy this report:
- Take advantage of the latest data
- Find deeper insights into current market developments
- Discover vital success factors affecting the market
This report is designed for manufacturers, distributors, importers, and wholesalers, as well as for investors, consultants and advisors.
In this report, you can find information that helps you to make informed decisions on the following issues:
- How to diversify your business and benefit from new market opportunities
- How to load your idle production capacity
- How to boost your sales on overseas markets
- How to increase your profit margins
- How to make your supply chain more sustainable
- How to reduce your production and supply chain costs
- How to outsource production to other countries
- How to prepare your business for global expansion
While doing this research, we combine the accumulated expertise of our analysts and the capabilities of artificial intelligence. The AI-based platform, developed by our data scientists, constitutes the key working tool for business analysts, empowering them to discover deep insights and ideas from the marketing data.
-
1. INTRODUCTION
Making Data-Driven Decisions to Grow Your Business
- REPORT DESCRIPTION
- RESEARCH METHODOLOGY AND AI PLATFORM
- DATA-DRIVEN DECISIONS FOR YOUR BUSINESS
- GLOSSARY AND SPECIFIC TERMS
-
2. EXECUTIVE SUMMARY
A Quick Overview of Market Performance
- KEY FINDINGS
- MARKET TRENDS This Chapter is Available Only for the Professional Edition PRO
-
3. MARKET OVERVIEW
Understanding the Current State of The Market and Its Prospects
- MARKET SIZE
- MARKET STRUCTURE
- TRADE BALANCE
- PER CAPITA CONSUMPTION
- MARKET FORECAST TO 2030
-
4. MOST PROMISING PRODUCT
Finding New Products to Diversify Your Business
This Chapter is Available Only for the Professional Edition PRO- TOP PRODUCTS TO DIVERSIFY YOUR BUSINESS
- BEST-SELLING PRODUCTS
- MOST CONSUMED PRODUCT
- MOST TRADED PRODUCT
- MOST PROFITABLE PRODUCT FOR EXPORT
-
5. MOST PROMISING SUPPLYING COUNTRIES
Choosing the Best Countries to Establish Your Sustainable Supply Chain
This Chapter is Available Only for the Professional Edition PRO- TOP COUNTRIES TO SOURCE YOUR PRODUCT
- TOP PRODUCING COUNTRIES
- TOP EXPORTING COUNTRIES
- LOW-COST EXPORTING COUNTRIES
-
6. MOST PROMISING OVERSEAS MARKETS
Choosing the Best Countries to Boost Your Exports
This Chapter is Available Only for the Professional Edition PRO- TOP OVERSEAS MARKETS FOR EXPORTING YOUR PRODUCT
- TOP CONSUMING MARKETS
- UNSATURATED MARKETS
- TOP IMPORTING MARKETS
- MOST PROFITABLE MARKETS
7. PRODUCTION
The Latest Trends and Insights into The Industry
- PRODUCTION VOLUME AND VALUE
8. IMPORTS
The Largest Import Supplying Countries
- IMPORTS FROM 2012–2023
- IMPORTS BY COUNTRY
- IMPORT PRICES BY COUNTRY
9. EXPORTS
The Largest Destinations for Exports
- EXPORTS FROM 2012–2023
- EXPORTS BY COUNTRY
- EXPORT PRICES BY COUNTRY
-
10. PROFILES OF MAJOR PRODUCERS
The Largest Producers on The Market and Their Profiles
This Chapter is Available Only for the Professional Edition PRO -
LIST OF TABLES
- Key Findings In 2023
- Market Volume, In Physical Terms, 2012–2023
- Market Value, 2012–2023
- Per Capita Consumption In 2012-2023
- Imports, In Physical Terms, By Country, 2012–2023
- Imports, In Value Terms, By Country, 2012–2023
- Import Prices, By Country Of Origin, 2012–2023
- Exports, In Physical Terms, By Country, 2012–2023
- Exports, In Value Terms, By Country, 2012–2023
- Export Prices, By Country Of Destination, 2012–2023
-
LIST OF FIGURES
- Market Volume, In Physical Terms, 2012–2023
- Market Value, 2012–2023
- Market Structure – Domestic Supply vs. Imports, In Physical Terms, 2012-2023
- Market Structure – Domestic Supply vs. Imports, In Value Terms, 2012-2023
- Trade Balance, In Physical Terms, 2012-2023
- Trade Balance, In Value Terms, 2012-2023
- Per Capita Consumption, 2012-2023
- Market Volume Forecast to 2030
- Market Value Forecast to 2030
- Products: Market Size And Growth, By Type
- Products: Average Per Capita Consumption, By Type
- Products: Exports And Growth, By Type
- Products: Export Prices And Growth, By Type
- Production Volume And Growth
- Exports And Growth
- Export Prices And Growth
- Market Size And Growth
- Per Capita Consumption
- Imports And Growth
- Import Prices
- Production, In Physical Terms, 2012–2023
- Production, In Value Terms, 2012–2023
- Imports, In Physical Terms, 2012–2023
- Imports, In Value Terms, 2012–2023
- Imports, In Physical Terms, By Country, 2023
- Imports, In Physical Terms, By Country, 2012–2023
- Imports, In Value Terms, By Country, 2012–2023
- Import Prices, By Country Of Origin, 2012–2023
- Exports, In Physical Terms, 2012–2023
- Exports, In Value Terms, 2012–2023
- Exports, In Physical Terms, By Country, 2023
- Exports, In Physical Terms, By Country, 2012–2023
- Exports, In Value Terms, By Country, 2012–2023
- Export Prices, By Country Of Destination, 2012–2023
This report provides an in-depth analysis of the milking machine market in Spain.
This report provides an in-depth analysis of the dairy machinery market in Spain.
This report provides an in-depth analysis of the global milking machine market.
This report provides an in-depth analysis of the global dairy machinery market.
In August 2023, the imports of Milking Machine reached their highest point. The value of milking machine imports surged to $971K during this month.
In 2016, the global milking machine imports totaled X tons, standing approx. at the previous year figure. Overall, milking machine imports continue to indicate a relatively flat trend pattern. The...
In 2016, the global milking machine imports totaled X tons, standing approx. at the previous year figure. Overall, milking machine imports continue to indicate a relatively flat trend pattern. The...
With more than twenty billion gallons produced in the U.S. alone, milk is a huge world-wide business. It is widely known that cows must be milked twice each day to stay healthy and happy, and, historically, farmers have planned around this routine. How


