World - Hydrogen Peroxide - Market Analysis, Forecast, Size, Trends And Insights
Get instant access to more than 2 million reports, dashboards, and datasets on the IndexBox Platform.
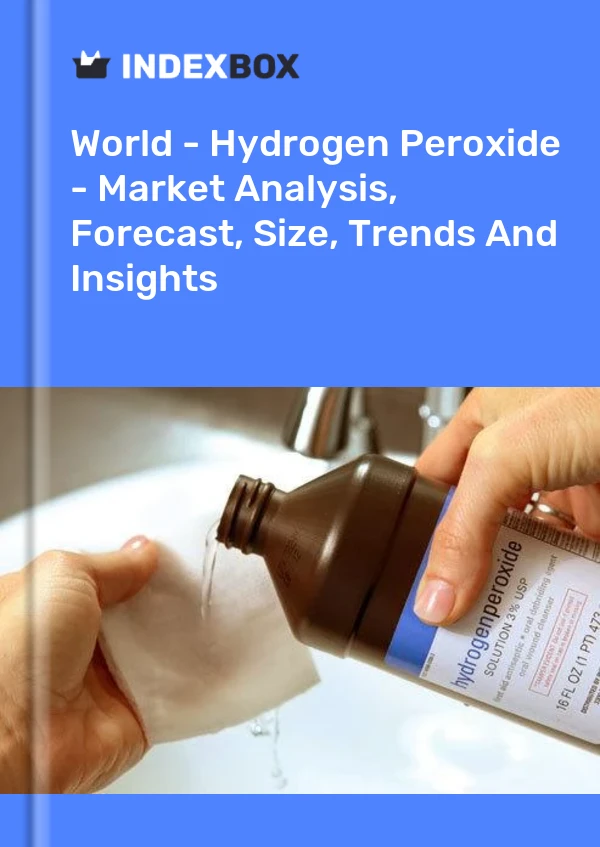
View PricingHydrogen Peroxide Market
The global hydrogen peroxide market is expected to see growth over the next eight years, with consumption trends and market performance predicted to increase. By 2030, the market volume is projected to reach 13M tons, with a value of $8.7B. China remains the largest consumer and producer of hydrogen peroxide, while Russia and Germany are the top importers. The average per capita consumption of hydrogen peroxide varies significantly by country, with Qatar, Sweden, Japan, and the UK leading in terms of consumption per person. The market is also driven by increasing exports, with France, Belgium, and South Korea being key exporting countries. Overall, the hydrogen peroxide market is expected to see continued growth and expansion in the coming years.
Market Forecast
Driven by increasing demand for hydrogen peroxide worldwide, the market is expected to continue an upward consumption trend over the next eight years. Market performance is forecast to decelerate, expanding with an anticipated CAGR of +3.7% for the period from 2022 to 2030, which is projected to bring the market volume to 13M tons by the end of 2030.
In value terms, the market is forecast to increase with an anticipated CAGR of +6.0% for the period from 2022 to 2030, which is projected to bring the market value to $8.7B (in nominal prices) by the end of 2030.
Consumption
World Consumption of Hydrogen Peroxide
In 2022, approx. 9.8M tons of hydrogen peroxide were consumed worldwide; increasing by 5.5% compared with 2021. Overall, the total consumption indicated a strong increase from 2012 to 2022: its volume increased at an average annual rate of +5.5% over the last decade. The trend pattern, however, indicated some noticeable fluctuations being recorded throughout the analyzed period. Based on 2022 figures, consumption increased by +71.4% against 2012 indices. Global consumption peaked in 2022 and is likely to see gradual growth in years to come.
The global hydrogen peroxide market value expanded rapidly to $5.4B in 2022, with an increase of 9% against the previous year. This figure reflects the total revenues of producers and importers (excluding logistics costs, retail marketing costs, and retailers' margins, which will be included in the final consumer price). Over the period under review, the total consumption indicated a buoyant expansion from 2012 to 2022: its value increased at an average annual rate of +5.7% over the last decade. The trend pattern, however, indicated some noticeable fluctuations being recorded throughout the analyzed period. Based on 2022 figures, consumption increased by +73.3% against 2012 indices. Over the period under review, the global market attained the peak level in 2022 and is likely to see gradual growth in the near future.
Consumption By Country
China (1.8M tons) remains the largest hydrogen peroxide consuming country worldwide, accounting for 18% of total volume. Moreover, hydrogen peroxide consumption in China exceeded the figures recorded by the second-largest consumer, the United States (766K tons), twofold. India (693K tons) ranked third in terms of total consumption with a 7.1% share.
From 2012 to 2022, the average annual rate of growth in terms of volume in China totaled +7.4%. The remaining consuming countries recorded the following average annual rates of consumption growth: the United States (+8.2% per year) and India (+6.1% per year).
In value terms, China ($806M), India ($504M) and the United States ($475M) were the countries with the highest levels of market value in 2022, together accounting for 33% of the global market. Japan, Russia, Pakistan, the UK, Indonesia, Brazil, Bangladesh, Germany, Qatar and Sweden lagged somewhat behind, together comprising a further 33%.
In terms of the main consuming countries, Qatar, with a CAGR of +40.6%, saw the highest rates of growth with regard to market size over the period under review, while market for the other global leaders experienced more modest paces of growth.
In 2022, the highest levels of hydrogen peroxide per capita consumption was registered in Qatar (74 kg per person), followed by Sweden (24 kg per person), Japan (3.7 kg per person) and the UK (3.7 kg per person), while the world average per capita consumption of hydrogen peroxide was estimated at less than 0.1 kg per person.
From 2012 to 2022, the average annual rate of growth in terms of the hydrogen peroxide per capita consumption in Qatar amounted to +35.1%. In the other countries, the average annual rates were as follows: Sweden (-3.3% per year) and Japan (+4.4% per year).
Production
World Production of Hydrogen Peroxide
In 2022, global production of hydrogen peroxide expanded to 9.4M tons, growing by 2% against the previous year's figure. Overall, the total production indicated a resilient expansion from 2012 to 2022: its volume increased at an average annual rate of +5.4% over the last decade. The trend pattern, however, indicated some noticeable fluctuations being recorded throughout the analyzed period. Based on 2022 figures, production decreased by -3.1% against 2020 indices. The pace of growth was the most pronounced in 2020 with an increase of 13%. As a result, production reached the peak volume of 9.7M tons. From 2021 to 2022, global production growth remained at a somewhat lower figure.
In value terms, hydrogen peroxide production amounted to $5.2B in 2022 estimated in export price. Over the period under review, the total production indicated a buoyant expansion from 2012 to 2022: its value increased at an average annual rate of +5.5% over the last decade. The trend pattern, however, indicated some noticeable fluctuations being recorded throughout the analyzed period. Based on 2022 figures, production increased by +70.6% against 2012 indices. The most prominent rate of growth was recorded in 2020 with an increase of 16% against the previous year. Over the period under review, global production attained the peak level in 2022 and is expected to retain growth in the near future.
Production By Country
China (1.8M tons) remains the largest hydrogen peroxide producing country worldwide, comprising approx. 19% of total volume. Moreover, hydrogen peroxide production in China exceeded the figures recorded by the second-largest producer, the United States (746K tons), twofold. The third position in this ranking was taken by India (696K tons), with a 7.4% share.
In China, hydrogen peroxide production increased at an average annual rate of +7.6% over the period from 2012-2022. In the other countries, the average annual rates were as follows: the United States (+8.0% per year) and India (+7.0% per year).
Imports
World Imports of Hydrogen Peroxide
In 2022, purchases abroad of hydrogen peroxide increased by 27% to 2.3M tons, rising for the second year in a row after two years of decline. Over the period under review, total imports indicated noticeable growth from 2012 to 2022: its volume increased at an average annual rate of +4.8% over the last decade. The trend pattern, however, indicated some noticeable fluctuations being recorded throughout the analyzed period. Based on 2022 figures, imports increased by +37.3% against 2020 indices. As a result, imports reached the peak and are likely to continue growth in the immediate term.
In value terms, hydrogen peroxide imports soared to $1.2B in 2022. Overall, total imports indicated moderate growth from 2012 to 2022: its value increased at an average annual rate of +4.9% over the last decade. The trend pattern, however, indicated some noticeable fluctuations being recorded throughout the analyzed period. Based on 2022 figures, imports increased by +46.5% against 2020 indices. As a result, imports reached the peak and are likely to continue growth in the immediate term.
Imports By Country
In 2022, Russia (395K tons), distantly followed by Germany (226K tons) were the largest importers of hydrogen peroxide, together generating 27% of total imports. The Netherlands (91K tons), Italy (90K tons), the United States (87K tons), Taiwan (Chinese) (82K tons), France (68K tons), Chile (67K tons), Turkey (66K tons), Israel (59K tons), Austria (55K tons), Belgium (52K tons) and Portugal (45K tons) followed a long way behind the leaders.
From 2012 to 2022, the most notable rate of growth in terms of purchases, amongst the key importing countries, was attained by Russia (with a CAGR of +28.5%), while imports for the other global leaders experienced more modest paces of growth.
In value terms, the largest hydrogen peroxide importing markets worldwide were Germany ($117M), Russia ($65M) and Italy ($59M), with a combined 20% share of global imports. Taiwan (Chinese), France, Israel, the United States, Turkey, Chile, the Netherlands, Belgium, Austria and Portugal lagged somewhat behind, together comprising a further 30%.
Turkey, with a CAGR of +19.2%, saw the highest growth rate of the value of imports, in terms of the main importing countries over the period under review, while purchases for the other global leaders experienced more modest paces of growth.
Import Prices By Country
The average hydrogen peroxide import price stood at $524 per ton in 2022, with an increase of 6.5% against the previous year. Overall, the import price showed a relatively flat trend pattern. Over the period under review, average import prices hit record highs at $529 per ton in 2014; however, from 2015 to 2022, import prices remained at a lower figure.
Prices varied noticeably by country of destination: amid the top importers, the country with the highest price was Israel ($710 per ton), while Russia ($166 per ton) was amongst the lowest.
From 2012 to 2022, the most notable rate of growth in terms of prices was attained by Italy (+5.4%), while the other global leaders experienced more modest paces of growth.
Exports
World Exports of Hydrogen Peroxide
In 2022, global exports of hydrogen peroxide expanded markedly to 1.9M tons, surging by 9.8% on the previous year. The total export volume increased at an average annual rate of +4.2% from 2012 to 2022; however, the trend pattern indicated some noticeable fluctuations being recorded throughout the analyzed period. The most prominent rate of growth was recorded in 2017 when exports increased by 17%. The global exports peaked in 2022 and are expected to retain growth in the near future.
In value terms, hydrogen peroxide exports surged to $1.1B in 2022. Over the period under review, total exports indicated a strong expansion from 2012 to 2022: its value increased at an average annual rate of +5.6% over the last decade. The trend pattern, however, indicated some noticeable fluctuations being recorded throughout the analyzed period. Based on 2022 figures, exports increased by +89.3% against 2016 indices. As a result, the exports reached the peak and are likely to continue growth in the immediate term.
Exports By Country
The shipments of the twelve major exporters of hydrogen peroxide, namely Belgium, the Netherlands, South Korea, Brazil, Thailand, Sweden, Germany, Austria, Canada, France, Turkey and the United States, represented more than two-thirds of total export. Finland (65K tons) took a little share of total exports.
From 2012 to 2022, the biggest increases were recorded for Turkey (with a CAGR of +14.8%), while shipments for the other global leaders experienced more modest paces of growth.
In value terms, the largest hydrogen peroxide supplying countries worldwide were Belgium ($126M), the Netherlands ($109M) and South Korea ($88M), together accounting for 29% of global exports. Brazil, Germany, Thailand, Sweden, France, the United States, Austria, Turkey, Finland and Canada lagged somewhat behind, together accounting for a further 47%.
Turkey, with a CAGR of +17.4%, saw the highest growth rate of the value of exports, in terms of the main exporting countries over the period under review, while shipments for the other global leaders experienced more modest paces of growth.
Export Prices By Country
In 2022, the average hydrogen peroxide export price amounted to $592 per ton, jumping by 18% against the previous year. Over the last decade, it increased at an average annual rate of +1.4%. As a result, the export price reached the peak level and is likely to continue growth in the immediate term.
There were significant differences in the average prices amongst the major exporting countries. In 2022, amid the top suppliers, the country with the highest price was France ($750 per ton), while Canada ($373 per ton) was amongst the lowest.
From 2012 to 2022, the most notable rate of growth in terms of prices was attained by France (+32.3%), while the other global leaders experienced more modest paces of growth.
This report provides an in-depth analysis of the global hydrogen peroxide market. Within it, you will discover the latest data on market trends and opportunities by country, consumption, production and price developments, as well as the global trade (imports and exports). The forecast exhibits the market prospects through 2030.
Product coverage:
- Prodcom 20136300 - Hydrogen peroxide
Country coverage:
Worldwide - the report contains statistical data for 200 countries and includes detailed profiles of the 50 largest consuming countries:
- USA
- China
- Japan
- Germany
- United Kingdom
- France
- Brazil
- Italy
- Russian Federation
- India
- Canada
- Australia
- Republic of Korea
- Spain
- Mexico
- Indonesia
- Netherlands
- Turkey
- Saudi Arabia
- Switzerland
- Sweden
- Nigeria
- Poland
- Belgium
- Argentina
- Norway
- Austria
- Thailand
- United Arab Emirates
- Colombia
- Denmark
- South Africa
- Malaysia
- Israel
- Singapore
- Egypt
- Philippines
- Finland
- Chile
- Ireland
- Pakistan
- Greece
- Portugal
- Kazakhstan
- Algeria
- Czech Republic
- Qatar
- Peru
- Romania
- Vietnam
+ the largest producing countries
Data coverage:
- Global market volume and value
- Per Capita consumption
- Forecast of the market dynamics in the medium term
- Global production, split by region and country
- Global trade (exports and imports)
- Export and import prices
- Market trends, drivers and restraints
- Key market players and their profiles
Reasons to buy this report:
- Take advantage of the latest data
- Find deeper insights into current market developments
- Discover vital success factors affecting the market
This report is designed for manufacturers, distributors, importers, and wholesalers, as well as for investors, consultants and advisors.
In this report, you can find information that helps you to make informed decisions on the following issues:
- How to diversify your business and benefit from new market opportunities
- How to load your idle production capacity
- How to boost your sales on overseas markets
- How to increase your profit margins
- How to make your supply chain more sustainable
- How to reduce your production and supply chain costs
- How to outsource production to other countries
- How to prepare your business for global expansion
While doing this research, we combine the accumulated expertise of our analysts and the capabilities of artificial intelligence. The AI-based platform, developed by our data scientists, constitutes the key working tool for business analysts, empowering them to discover deep insights and ideas from the marketing data.
-
1. INTRODUCTION
Making Data-Driven Decisions to Grow Your Business
- REPORT DESCRIPTION
- RESEARCH METHODOLOGY AND AI PLATFORM
- DATA-DRIVEN DECISIONS FOR YOUR BUSINESS
- GLOSSARY AND SPECIFIC TERMS
-
2. EXECUTIVE SUMMARY
A Quick Overview of Market Performance
- KEY FINDINGS
- MARKET TRENDS This Chapter is Available Only for the Professional Edition PRO
-
3. MARKET OVERVIEW
Understanding the Current State of The Market and Its Prospects
- MARKET SIZE
- CONSUMPTION BY COUNTRY
- MARKET FORECAST TO 2030
-
4. MOST PROMISING PRODUCT
Finding New Products to Diversify Your Business
This Chapter is Available Only for the Professional Edition PRO- TOP PRODUCTS TO DIVERSIFY YOUR BUSINESS
- BEST-SELLING PRODUCTS
- MOST CONSUMED PRODUCT
- MOST TRADED PRODUCT
- MOST PROFITABLE PRODUCT FOR EXPORT
-
5. MOST PROMISING SUPPLYING COUNTRIES
Choosing the Best Countries to Establish Your Sustainable Supply Chain
This Chapter is Available Only for the Professional Edition PRO- TOP COUNTRIES TO SOURCE YOUR PRODUCT
- TOP PRODUCING COUNTRIES
- TOP EXPORTING COUNTRIES
- LOW-COST EXPORTING COUNTRIES
-
6. MOST PROMISING OVERSEAS MARKETS
Choosing the Best Countries to Boost Your Exports
This Chapter is Available Only for the Professional Edition PRO- TOP OVERSEAS MARKETS FOR EXPORTING YOUR PRODUCT
- TOP CONSUMING MARKETS
- UNSATURATED MARKETS
- TOP IMPORTING MARKETS
- MOST PROFITABLE MARKETS
7. GLOBAL PRODUCTION
The Latest Trends and Insights into The Industry
- PRODUCTION VOLUME AND VALUE
- PRODUCTION BY COUNTRY
8. GLOBAL IMPORTS
The Largest Importers on The Market and How They Succeed
- IMPORTS FROM 2012–2023
- IMPORTS BY COUNTRY
- IMPORT PRICES BY COUNTRY
9. GLOBAL EXPORTS
The Largest Exporters on The Market and How They Succeed
- EXPORTS FROM 2012–2023
- EXPORTS BY COUNTRY
- EXPORT PRICES BY COUNTRY
-
10. PROFILES OF MAJOR PRODUCERS
The Largest Producers on The Market and Their Profiles
This Chapter is Available Only for the Professional Edition PRO -
11. COUNTRY PROFILES
The Largest Markets And Their Profiles
This Chapter is Available Only for the Professional Edition PRO- United States
- China
- Japan
- Germany
- United Kingdom
- France
- Brazil
- Italy
- Russian Federation
- India
- Canada
- Australia
- Republic of Korea
- Spain
- Mexico
- Indonesia
- Netherlands
- Turkey
- Saudi Arabia
- Switzerland
- Sweden
- Nigeria
- Poland
- Belgium
- Argentina
- Norway
- Austria
- Thailand
- United Arab Emirates
- Colombia
- Denmark
- South Africa
- Malaysia
- Israel
- Singapore
- Egypt
- Philippines
- Finland
- Chile
- Ireland
- Pakistan
- Greece
- Portugal
- Kazakhstan
- Algeria
- Czech Republic
- Qatar
- Peru
- Romania
- Vietnam
-
LIST OF TABLES
- Key Findings In 2023
- Market Volume, In Physical Terms, 2012–2023
- Market Value, 2012–2023
- Per Capita Consumption, By Country, 2018–2023
- Production, In Physical Terms, By Country, 2012–2023
- Imports, In Physical Terms, By Country, 2012–2023
- Imports, In Value Terms, By Country, 2012–2023
- Import Prices, By Country Of Destination, 2012–2023
- Exports, In Physical Terms, By Country, 2012–2023
- Exports, In Value Terms, By Country, 2012–2023
- Export Prices, By Country Of Origin, 2012–2023
-
LIST OF FIGURES
- Market Volume, In Physical Terms, 2012–2023
- Market Value, 2012–2023
- Consumption, By Country, 2023
- Market Volume Forecast to 2030
- Market Value Forecast to 2030
- Products: Market Size And Growth, By Type
- Products: Average Per Capita Consumption, By Type
- Products: Exports And Growth, By Type
- Products: Export Prices And Growth, By Type
- Production Volume And Growth
- Exports And Growth
- Export Prices And Growth
- Market Size And Growth
- Per Capita Consumption
- Imports And Growth
- Import Prices
- Production, In Physical Terms, 2012–2023
- Production, In Value Terms, 2012–2023
- Production, By Country, 2023
- Production, In Physical Terms, By Country, 2012–2023
- Imports, In Physical Terms, 2012–2023
- Imports, In Value Terms, 2012–2023
- Imports, In Physical Terms, By Country, 2023
- Imports, In Physical Terms, By Country, 2012–2023
- Imports, In Value Terms, By Country, 2012–2023
- Import Prices, By Country, 2012–2023
- Exports, In Physical Terms, 2012–2023
- Exports, In Value Terms, 2012–2023
- Exports, In Physical Terms, By Country, 2023
- Exports, In Physical Terms, By Country, 2012–2023
- Exports, In Value Terms, By Country, 2012–2023
- Export Prices, 2012–2023


