Republic of Korea - Fishing Rods And Other Line Fishing Tackle - Market Analysis, Forecast, Size, Trends And Insights
Get instant access to more than 2 million reports, dashboards, and datasets on the IndexBox Platform.
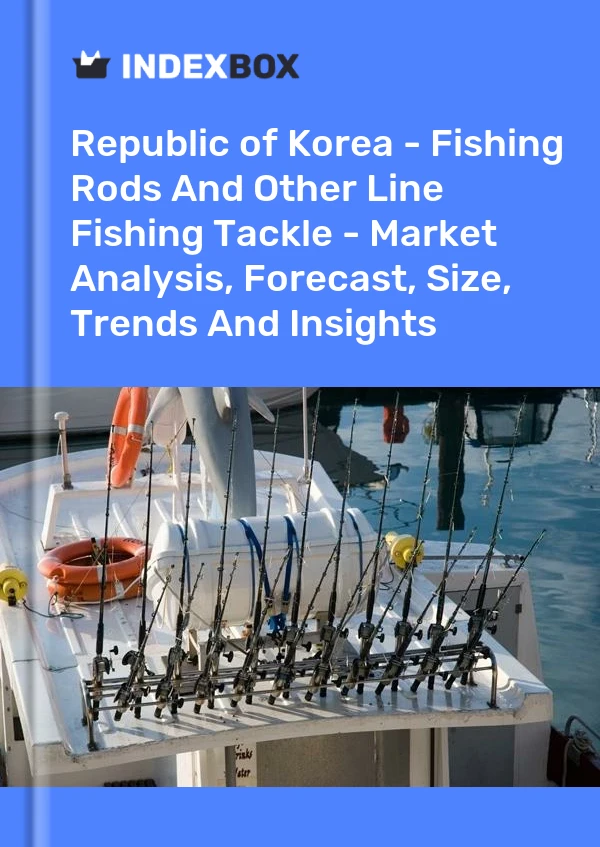
View PricingFishing Rod Price in South Korea - 2021
Contents:
- Fishing Rod Price in South Korea (CIF) - 2022
- Fishing Rod Price in South Korea (FOB) - 2022
- Fishing Rod Imports in South Korea
- Fishing Rod Exports in South Korea
Fishing Rod Price in South Korea (CIF) - 2022
The average fishing rod import price stood at $18 per unit in 2022, stabilizing at the previous year. Overall, the import price showed a relatively flat trend pattern. The pace of growth was the most pronounced in 2018 an increase of 12%. As a result, import price reached the peak level of $21 per unit. From 2019 to 2022, the average import prices remained at a somewhat lower figure.
There were significant differences in the average prices amongst the major supplying countries. In 2022, amid the top importers, the country with the highest price was Japan ($83 per unit), while the price for China ($13 per unit) was amongst the lowest.
From 2012 to 2022, the most notable rate of growth in terms of prices was attained by Vietnam (+6.7%), while the prices for the other major suppliers experienced mixed trend patterns.
Fishing Rod Price in South Korea (FOB) - 2022
The average fishing rod export price stood at $34 per unit in 2022, shrinking by -6.6% against the previous year. In general, the export price, however, saw a relatively flat trend pattern. The growth pace was the most rapid in 2021 when the average export price increased by 14% against the previous year. As a result, the export price reached the peak level of $37 per unit, and then reduced in the following year.
Prices varied noticeably by country of destination: amid the top suppliers, the country with the highest price was Japan ($75 per unit), while the average price for exports to Peru ($5.7 per unit) was amongst the lowest.
From 2012 to 2022, the most notable rate of growth in terms of prices was recorded for supplies to Russia (+6.2%), while the prices for the other major destinations experienced more modest paces of growth.
Fishing Rod Imports in South Korea
After three years of growth, purchases abroad of fishing rods and other line fishing tackle decreased by -7.8% to 9.7M units in 2022. The total import volume increased at an average annual rate of +7.0% from 2019 to 2022; however, the trend pattern indicated some noticeable fluctuations being recorded throughout the analyzed period. The pace of growth appeared the most rapid in 2021 with an increase of 20% against the previous year. As a result, imports reached the peak of 10M units, and then contracted in the following year.
In value terms, fishing rod imports declined to $178M in 2022. The total import value increased at an average annual rate of +6.5% over the period from 2019 to 2022; however, the trend pattern remained consistent, with only minor fluctuations in certain years. The pace of growth appeared the most rapid in 2021 with an increase of 17% against the previous year. As a result, imports attained the peak of $192M, and then dropped in the following year.
| Import of Fishing Rod in South Korea (Million USD) | |||||
|---|---|---|---|---|---|
| COUNTRY | 2019 | 2020 | 2021 | 2022 | CAGR, 2019-2022 |
| China | 72.9 | 92.2 | 102 | 102 | 11.8% |
| Japan | 47.2 | 44.6 | 42.1 | 43.4 | -2.8% |
| Vietnam | 10.2 | 9.6 | 13.7 | 13.5 | 9.8% |
| Malaysia | 5.3 | 6.5 | 7.4 | 7.4 | 11.8% |
| Cambodia | 2.6 | 3.7 | 3.1 | 2.9 | 3.7% |
| Others | 8.9 | 7.0 | 23.4 | 8.4 | -1.9% |
| Total | 147 | 164 | 192 | 178 | 6.6% |
Top Suppliers of Fishing Rod to South Korea in 2022:
- China (8.2M units)
- Vietnam (0.5M units)
- Japan (0.5M units)
- Cambodia (0.2M units)
- Malaysia (0.2M units)
Fishing Rod Exports in South Korea
After three years of growth, shipments abroad of fishing rods and other line fishing tackle decreased by -8% to 3.9M units in 2022. The total export volume increased at an average annual rate of +4.6% from 2019 to 2022; the trend pattern remained consistent, with only minor fluctuations being recorded throughout the analyzed period. The most prominent rate of growth was recorded in 2021 when exports increased by 22%. As a result, the exports reached the peak of 4.3M units, and then reduced in the following year.
In value terms, fishing rod exports declined to $135M in 2022. The total export value increased at an average annual rate of +7.1% from 2019 to 2022; the trend pattern indicated some noticeable fluctuations being recorded throughout the analyzed period. The pace of growth was the most pronounced in 2021 with an increase of 39% against the previous year. As a result, the exports reached the peak of $157M, and then declined in the following year.
| Export of Fishing Rod in South Korea (Million USD) | |||||
|---|---|---|---|---|---|
| COUNTRY | 2019 | 2020 | 2021 | 2022 | CAGR, 2019-2022 |
| United States | 39.5 | 44.3 | 56.9 | 53.7 | 10.8% |
| China | 11.2 | 14.6 | 17.0 | 15.2 | 10.7% |
| Japan | 11.8 | 11.8 | 13.5 | 12.5 | 1.9% |
| Paraguay | 3.0 | 1.8 | 3.0 | 3.5 | 5.3% |
| Russia | 3.2 | 1.9 | 2.5 | 2.7 | -5.5% |
| Spain | 1.5 | 2.0 | 2.1 | 2.0 | 10.1% |
| Philippines | 1.3 | 1.2 | 1.7 | 1.6 | 7.2% |
| Vietnam | 1.3 | 1.7 | 1.7 | 1.6 | 7.2% |
| Cambodia | 1.1 | 1.2 | 1.7 | 1.5 | 10.9% |
| Peru | 0.8 | 0.7 | 1.1 | 1.0 | 7.7% |
| South Africa | 0.6 | 0.4 | 0.6 | 0.7 | 5.3% |
| Argentina | 0.5 | 0.7 | 0.8 | 0.7 | 11.9% |
| Fiji | 1.2 | 0.6 | 0.6 | 0.7 | -16.4% |
| Others | 33.2 | 30.0 | 53.9 | 37.7 | 4.3% |
| Total | 110 | 113 | 157 | 135 | 7.1% |
Top Export Markets for Fishing Rod from South Korea in 2022:
- United States (718.1K units)
- China (441.8K units)
- Vietnam (258.0K units)
- Peru (176.6K units)
- Japan (167.0K units)
- Cambodia (161.8K units)
- Paraguay (146.6K units)
- Spain (107.1K units)
- Russia (105.6K units)
- Argentina (92.3K units)
- Philippines (91.7K units)
- Fiji (82.6K units)
- South Africa (72.5K units)
This report provides an in-depth analysis of the fishing rod market in Republic of Korea. Within it, you will discover the latest data on market trends and opportunities by country, consumption, production and price developments, as well as the global trade (imports and exports). The forecast exhibits the market prospects through 2030.
Product coverage:
- Prodcom 32301600 - Fishing rods, other line fishing tackle, articles for hunting or fishing n.e.c.
Country coverage:
- South Korea
Data coverage:
- Market volume and value
- Per Capita consumption
- Forecast of the market dynamics in the medium term
- Trade (exports and imports) in Republic of Korea
- Export and import prices
- Market trends, drivers and restraints
- Key market players and their profiles
Reasons to buy this report:
- Take advantage of the latest data
- Find deeper insights into current market developments
- Discover vital success factors affecting the market
This report is designed for manufacturers, distributors, importers, and wholesalers, as well as for investors, consultants and advisors.
In this report, you can find information that helps you to make informed decisions on the following issues:
- How to diversify your business and benefit from new market opportunities
- How to load your idle production capacity
- How to boost your sales on overseas markets
- How to increase your profit margins
- How to make your supply chain more sustainable
- How to reduce your production and supply chain costs
- How to outsource production to other countries
- How to prepare your business for global expansion
While doing this research, we combine the accumulated expertise of our analysts and the capabilities of artificial intelligence. The AI-based platform, developed by our data scientists, constitutes the key working tool for business analysts, empowering them to discover deep insights and ideas from the marketing data.
-
1. INTRODUCTION
Making Data-Driven Decisions to Grow Your Business
- REPORT DESCRIPTION
- RESEARCH METHODOLOGY AND AI PLATFORM
- DATA-DRIVEN DECISIONS FOR YOUR BUSINESS
- GLOSSARY AND SPECIFIC TERMS
-
2. EXECUTIVE SUMMARY
A Quick Overview of Market Performance
- KEY FINDINGS
- MARKET TRENDS This Chapter is Available Only for the Professional Edition PRO
-
3. MARKET OVERVIEW
Understanding the Current State of The Market and Its Prospects
- MARKET SIZE
- MARKET STRUCTURE
- TRADE BALANCE
- PER CAPITA CONSUMPTION
- MARKET FORECAST TO 2030
-
4. MOST PROMISING PRODUCT
Finding New Products to Diversify Your Business
This Chapter is Available Only for the Professional Edition PRO- TOP PRODUCTS TO DIVERSIFY YOUR BUSINESS
- BEST-SELLING PRODUCTS
- MOST CONSUMED PRODUCT
- MOST TRADED PRODUCT
- MOST PROFITABLE PRODUCT FOR EXPORT
-
5. MOST PROMISING SUPPLYING COUNTRIES
Choosing the Best Countries to Establish Your Sustainable Supply Chain
This Chapter is Available Only for the Professional Edition PRO- TOP COUNTRIES TO SOURCE YOUR PRODUCT
- TOP PRODUCING COUNTRIES
- TOP EXPORTING COUNTRIES
- LOW-COST EXPORTING COUNTRIES
-
6. MOST PROMISING OVERSEAS MARKETS
Choosing the Best Countries to Boost Your Exports
This Chapter is Available Only for the Professional Edition PRO- TOP OVERSEAS MARKETS FOR EXPORTING YOUR PRODUCT
- TOP CONSUMING MARKETS
- UNSATURATED MARKETS
- TOP IMPORTING MARKETS
- MOST PROFITABLE MARKETS
7. PRODUCTION
The Latest Trends and Insights into The Industry
- PRODUCTION VOLUME AND VALUE
8. IMPORTS
The Largest Import Supplying Countries
- IMPORTS FROM 2012–2023
- IMPORTS BY COUNTRY
- IMPORT PRICES BY COUNTRY
9. EXPORTS
The Largest Destinations for Exports
- EXPORTS FROM 2012–2023
- EXPORTS BY COUNTRY
- EXPORT PRICES BY COUNTRY
-
10. PROFILES OF MAJOR PRODUCERS
The Largest Producers on The Market and Their Profiles
This Chapter is Available Only for the Professional Edition PRO -
LIST OF TABLES
- Key Findings In 2023
- Market Volume, In Physical Terms, 2012–2023
- Market Value, 2012–2023
- Per Capita Consumption In 2012-2023
- Imports, In Physical Terms, By Country, 2012–2023
- Imports, In Value Terms, By Country, 2012–2023
- Import Prices, By Country Of Origin, 2012–2023
- Exports, In Physical Terms, By Country, 2012–2023
- Exports, In Value Terms, By Country, 2012–2023
- Export Prices, By Country Of Destination, 2012–2023
-
LIST OF FIGURES
- Market Volume, In Physical Terms, 2012–2023
- Market Value, 2012–2023
- Market Structure – Domestic Supply vs. Imports, In Physical Terms, 2012-2023
- Market Structure – Domestic Supply vs. Imports, In Value Terms, 2012-2023
- Trade Balance, In Physical Terms, 2012-2023
- Trade Balance, In Value Terms, 2012-2023
- Per Capita Consumption, 2012-2023
- Market Volume Forecast to 2030
- Market Value Forecast to 2030
- Products: Market Size And Growth, By Type
- Products: Average Per Capita Consumption, By Type
- Products: Exports And Growth, By Type
- Products: Export Prices And Growth, By Type
- Production Volume And Growth
- Exports And Growth
- Export Prices And Growth
- Market Size And Growth
- Per Capita Consumption
- Imports And Growth
- Import Prices
- Production, In Physical Terms, 2012–2023
- Production, In Value Terms, 2012–2023
- Imports, In Physical Terms, 2012–2023
- Imports, In Value Terms, 2012–2023
- Imports, In Physical Terms, By Country, 2023
- Imports, In Physical Terms, By Country, 2012–2023
- Imports, In Value Terms, By Country, 2012–2023
- Import Prices, By Country Of Origin, 2012–2023
- Exports, In Physical Terms, 2012–2023
- Exports, In Value Terms, 2012–2023
- Exports, In Physical Terms, By Country, 2023
- Exports, In Physical Terms, By Country, 2012–2023
- Exports, In Value Terms, By Country, 2012–2023
- Export Prices, By Country Of Destination, 2012–2023
This report provides an in-depth analysis of the fishing rod market in Republic of Korea.
This report provides an in-depth analysis of the global fishing rod market.
This report provides an in-depth analysis of the fishing rod market in Republic of Korea.
This report provides an in-depth analysis of the global fishing rod market.
In 2016, the global fishing rod imports totaled X tons, approximately reflecting the previous year level. In general, fishing rod imports continue to indicate a relatively flat trend pattern. The...
In 2016, the global fishing rod imports totaled X tons, approximately reflecting the previous year level. In general, fishing rod imports continue to indicate a relatively flat trend pattern. The...


