Norway - Expanded Clays - Market Analysis, Forecast, Size, Trends And Insights
Get instant access to more than 2 million reports, dashboards, and datasets on the IndexBox Platform.
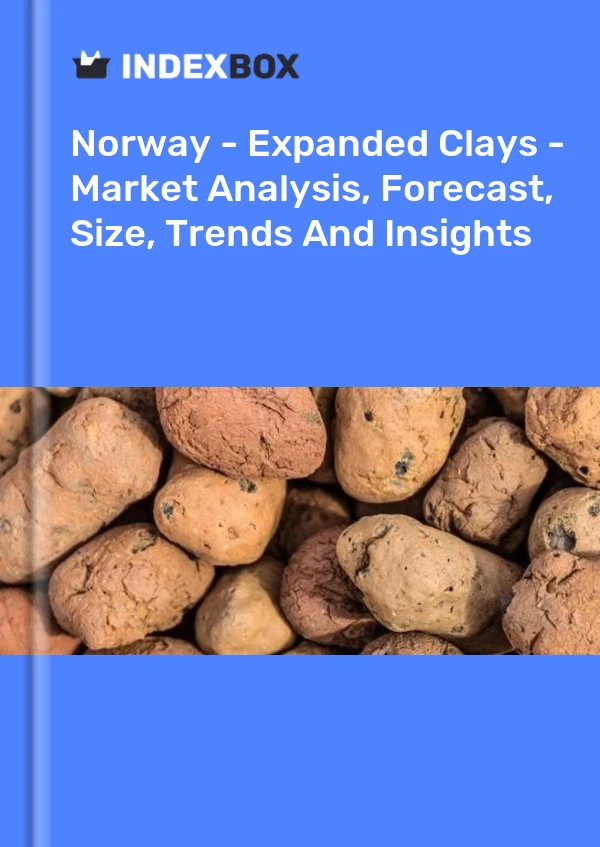
View PricingExpanded Clays Price in Norway - 2023
Contents:
- Expanded Clays Price in Norway (FOB) - 2023
- Expanded Clays Price in Norway (CIF) - 2023
- Expanded Clays Exports in Norway
- Expanded Clays Imports in Norway
Expanded Clays Price in Norway (FOB) - 2023
The average expanded clays export price stood at $808 per ton in August 2023, waning by -17.7% against the previous month. Over the period under review, the export price, however, posted a prominent increase. The most prominent rate of growth was recorded in July 2023 an increase of 140% m-o-m. As a result, the export price reached the peak level of $982 per ton, and then fell remarkably in the following month.
Prices varied noticeably by the country of destination: the country with the highest price was Spain ($1,333 per ton), while the average price for exports to Sweden ($226 per ton) was amongst the lowest.
From August 2022 to August 2023, the most notable rate of growth in terms of prices was recorded for supplies to Spain (+9.0%), while the prices for the other major destinations experienced more modest paces of growth.
Expanded Clays Price in Norway (CIF) - 2023
In August 2023, the average expanded clays import price amounted to $286 per ton, reducing by -33.4% against the previous month. In general, the import price saw a abrupt contraction. The pace of growth was the most pronounced in December 2022 when the average import price increased by 48% against the previous month. Over the period under review, average import prices hit record highs at $763 per ton in April 2023; however, from May 2023 to August 2023, import prices failed to regain momentum.
Prices varied noticeably by the country of origin: the country with the highest price was the UK ($2,419 per ton), while the price for Estonia ($199 per ton) was amongst the lowest.
From August 2022 to August 2023, the most notable rate of growth in terms of prices was attained by Sweden (+2.3%), while the prices for the other major suppliers experienced mixed trend patterns.
Expanded Clays Exports in Norway
In 2022, exports of exfoliated vermiculite, expanded clays and foamed slag from Norway amounted to 35K tons, increasing by 2.4% against the previous year. The total export volume increased at an average annual rate of +4.6% from 2019 to 2022; the trend pattern remained consistent, with somewhat noticeable fluctuations being observed in certain years. The growth pace was the most rapid in 2021 with an increase of 16%. The exports peaked in 2022 and are likely to continue growth in the near future.
In value terms, expanded clays exports rose slightly to $7.8M in 2022. The total export value increased at an average annual rate of +7.5% over the period from 2019 to 2022; the trend pattern indicated some noticeable fluctuations being recorded throughout the analyzed period. The most prominent rate of growth was recorded in 2021 when exports increased by 30%. Over the period under review, the exports reached the peak figure in 2022 and are expected to retain growth in the immediate term.
| Export of Expanded Clays in Norway (Thousand USD) | |||||
|---|---|---|---|---|---|
| COUNTRY | 2019 | 2020 | 2021 | 2022 | CAGR, 2019-2022 |
| Sweden | 2,166 | 2,096 | 3,964 | 3,917 | 21.8% |
| United Kingdom | 1,474 | 1,205 | 360 | 928 | -14.3% |
| Algeria | 678 | 170 | 850 | 839 | 7.4% |
| France | 246 | 302 | 592 | 585 | 33.5% |
| South Korea | 81.0 | 202 | 256 | 253 | 46.2% |
| Spain | 51.8 | 319 | 85.6 | 140 | 39.3% |
| Others | 1,584 | 1,414 | 1,331 | 1,143 | -10.3% |
| Total | 6,281 | 5,708 | 7,438 | 7,805 | 7.5% |
Top Export Markets for Expanded Clays from Norway in 2022:
- Sweden (22.7K tons)
- United Kingdom (7.2K tons)
- Algeria (1.5K tons)
- France (1.0K tons)
- South Korea (0.7K tons)
- Spain (0.5K tons)
Expanded Clays Imports in Norway
In 2022, overseas purchases of exfoliated vermiculite, expanded clays and foamed slag decreased by -33.7% to 10K tons for the first time since 2018, thus ending a three-year rising trend. Overall, imports, however, showed resilient growth. The most prominent rate of growth was recorded in 2021 when imports increased by 55% against the previous year. As a result, imports reached the peak of 15K tons, and then dropped significantly in the following year.
In value terms, expanded clays imports contracted dramatically to $4.8M in 2022. Over the period under review, imports, however, saw a mild increase. The pace of growth appeared the most rapid in 2021 with an increase of 19% against the previous year. As a result, imports reached the peak of $6M, and then contracted rapidly in the following year.
| Import of Expanded Clays in Norway (Thousand USD) | |||||
|---|---|---|---|---|---|
| COUNTRY | 2019 | 2020 | 2021 | 2022 | CAGR, 2019-2022 |
| Denmark | 1,034 | 1,567 | 1,990 | 1,607 | 15.8% |
| United Kingdom | 2,114 | 1,789 | 1,655 | 1,473 | -11.3% |
| United States | 499 | 436 | 752 | 607 | 6.7% |
| Netherlands | 281 | 442 | 594 | 480 | 19.5% |
| Sweden | 341 | 383 | 442 | 357 | 1.5% |
| Others | 416 | 439 | 581 | 301 | -10.2% |
| Total | 4,685 | 5,056 | 6,013 | 4,824 | 1.0% |
Top Suppliers of Expanded Clays to Norway in 2022:
- Denmark (8.7K tons)
- United Kingdom (0.5K tons)
- Sweden (0.5K tons)
- United States (0.2K tons)
- Netherlands (0.2K tons)
This report provides an in-depth analysis of the expanded clays market in Norway. Within it, you will discover the latest data on market trends and opportunities by country, consumption, production and price developments, as well as the global trade (imports and exports). The forecast exhibits the market prospects through 2030.
Product coverage:
- Prodcom 23991920 - Exfoliated vermiculite, expanded clays, foamed slag and similar expanded mineral materials and mixtures thereof
Country coverage:
- Norway
Data coverage:
- Market volume and value
- Per Capita consumption
- Forecast of the market dynamics in the medium term
- Trade (exports and imports) in Norway
- Export and import prices
- Market trends, drivers and restraints
- Key market players and their profiles
Reasons to buy this report:
- Take advantage of the latest data
- Find deeper insights into current market developments
- Discover vital success factors affecting the market
This report is designed for manufacturers, distributors, importers, and wholesalers, as well as for investors, consultants and advisors.
In this report, you can find information that helps you to make informed decisions on the following issues:
- How to diversify your business and benefit from new market opportunities
- How to load your idle production capacity
- How to boost your sales on overseas markets
- How to increase your profit margins
- How to make your supply chain more sustainable
- How to reduce your production and supply chain costs
- How to outsource production to other countries
- How to prepare your business for global expansion
While doing this research, we combine the accumulated expertise of our analysts and the capabilities of artificial intelligence. The AI-based platform, developed by our data scientists, constitutes the key working tool for business analysts, empowering them to discover deep insights and ideas from the marketing data.
-
1. INTRODUCTION
Making Data-Driven Decisions to Grow Your Business
- REPORT DESCRIPTION
- RESEARCH METHODOLOGY AND AI PLATFORM
- DATA-DRIVEN DECISIONS FOR YOUR BUSINESS
- GLOSSARY AND SPECIFIC TERMS
-
2. EXECUTIVE SUMMARY
A Quick Overview of Market Performance
- KEY FINDINGS
- MARKET TRENDS This Chapter is Available Only for the Professional Edition PRO
-
3. MARKET OVERVIEW
Understanding the Current State of The Market and Its Prospects
- MARKET SIZE
- MARKET STRUCTURE
- TRADE BALANCE
- PER CAPITA CONSUMPTION
- MARKET FORECAST TO 2030
-
4. MOST PROMISING PRODUCT
Finding New Products to Diversify Your Business
This Chapter is Available Only for the Professional Edition PRO- TOP PRODUCTS TO DIVERSIFY YOUR BUSINESS
- BEST-SELLING PRODUCTS
- MOST CONSUMED PRODUCT
- MOST TRADED PRODUCT
- MOST PROFITABLE PRODUCT FOR EXPORT
-
5. MOST PROMISING SUPPLYING COUNTRIES
Choosing the Best Countries to Establish Your Sustainable Supply Chain
This Chapter is Available Only for the Professional Edition PRO- TOP COUNTRIES TO SOURCE YOUR PRODUCT
- TOP PRODUCING COUNTRIES
- TOP EXPORTING COUNTRIES
- LOW-COST EXPORTING COUNTRIES
-
6. MOST PROMISING OVERSEAS MARKETS
Choosing the Best Countries to Boost Your Exports
This Chapter is Available Only for the Professional Edition PRO- TOP OVERSEAS MARKETS FOR EXPORTING YOUR PRODUCT
- TOP CONSUMING MARKETS
- UNSATURATED MARKETS
- TOP IMPORTING MARKETS
- MOST PROFITABLE MARKETS
7. PRODUCTION
The Latest Trends and Insights into The Industry
- PRODUCTION VOLUME AND VALUE
8. IMPORTS
The Largest Import Supplying Countries
- IMPORTS FROM 2012–2023
- IMPORTS BY COUNTRY
- IMPORT PRICES BY COUNTRY
9. EXPORTS
The Largest Destinations for Exports
- EXPORTS FROM 2012–2023
- EXPORTS BY COUNTRY
- EXPORT PRICES BY COUNTRY
-
10. PROFILES OF MAJOR PRODUCERS
The Largest Producers on The Market and Their Profiles
This Chapter is Available Only for the Professional Edition PRO -
LIST OF TABLES
- Key Findings In 2023
- Market Volume, In Physical Terms, 2012–2023
- Market Value, 2012–2023
- Per Capita Consumption In 2012-2023
- Imports, In Physical Terms, By Country, 2012–2023
- Imports, In Value Terms, By Country, 2012–2023
- Import Prices, By Country Of Origin, 2012–2023
- Exports, In Physical Terms, By Country, 2012–2023
- Exports, In Value Terms, By Country, 2012–2023
- Export Prices, By Country Of Destination, 2012–2023
-
LIST OF FIGURES
- Market Volume, In Physical Terms, 2012–2023
- Market Value, 2012–2023
- Market Structure – Domestic Supply vs. Imports, In Physical Terms, 2012-2023
- Market Structure – Domestic Supply vs. Imports, In Value Terms, 2012-2023
- Trade Balance, In Physical Terms, 2012-2023
- Trade Balance, In Value Terms, 2012-2023
- Per Capita Consumption, 2012-2023
- Market Volume Forecast to 2030
- Market Value Forecast to 2030
- Products: Market Size And Growth, By Type
- Products: Average Per Capita Consumption, By Type
- Products: Exports And Growth, By Type
- Products: Export Prices And Growth, By Type
- Production Volume And Growth
- Exports And Growth
- Export Prices And Growth
- Market Size And Growth
- Per Capita Consumption
- Imports And Growth
- Import Prices
- Production, In Physical Terms, 2012–2023
- Production, In Value Terms, 2012–2023
- Imports, In Physical Terms, 2012–2023
- Imports, In Value Terms, 2012–2023
- Imports, In Physical Terms, By Country, 2023
- Imports, In Physical Terms, By Country, 2012–2023
- Imports, In Value Terms, By Country, 2012–2023
- Import Prices, By Country Of Origin, 2012–2023
- Exports, In Physical Terms, 2012–2023
- Exports, In Value Terms, 2012–2023
- Exports, In Physical Terms, By Country, 2023
- Exports, In Physical Terms, By Country, 2012–2023
- Exports, In Value Terms, By Country, 2012–2023
- Export Prices, By Country Of Destination, 2012–2023
This report provides an in-depth analysis of the expanded clays market in Norway.
This report provides an in-depth analysis of the mineral wool market in Norway.
This report provides an in-depth analysis of the global expanded clays market.
This report provides an in-depth analysis of the global mineral wool market.
For the fifth consecutive year, the global mineral wool market recorded growth in sales value, which increased by...
In value terms, slag, rock wool and similar mineral wools imports stood at $X in 2016. The total import value increased at an average annual rate of +X% from 2007 to 2016; the trend pattern indic...
In value terms, slag, rock wool and similar mineral wools exports totaled $X in 2016. The total export value increased at an average annual rate of +X% over the period from 2007 to 2016; the trend ...


