Portugal - Fruits, Nuts And Peel (Sugar Preserved) - Market Analysis, Forecast, Size, Trends and Insights
Get instant access to more than 2 million reports, dashboards, and datasets on the IndexBox Platform.
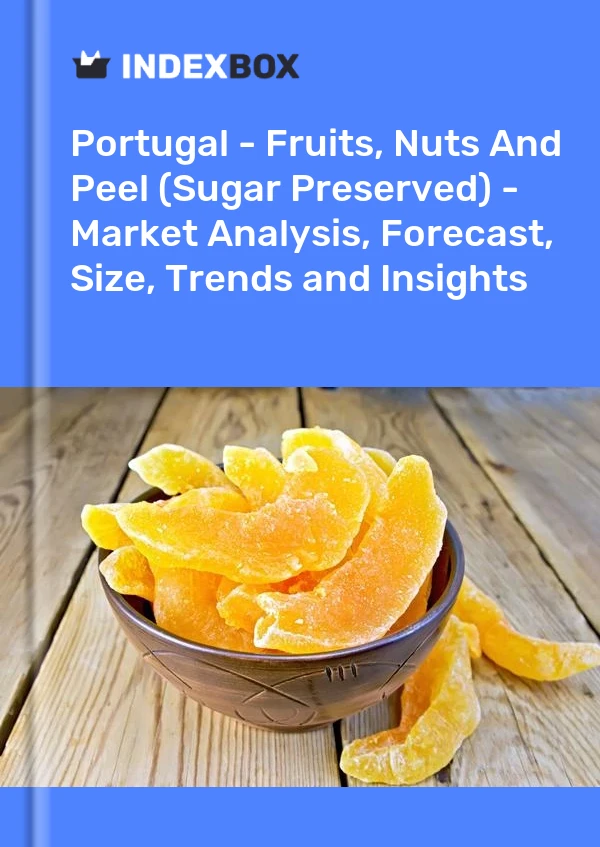
View PricingCandied Fruit Price in Portugal - 2023
Contents:
- Candied Fruit Price in Portugal (CIF) - 2023
- Candied Fruit Price in Portugal (FOB) - 2022
- Candied Fruit Imports in Portugal
- Candied Fruit Exports in Portugal
Candied Fruit Price in Portugal (CIF) - 2023
In April 2023, the average candied fruit import price amounted to $4,250 per ton, with an increase of 8.2% against the previous month. In general, import price indicated temperate growth from April 2022 to April 2023: its price increased at an average monthly rate of +4.9% over the last twelve months. The trend pattern, however, indicated some noticeable fluctuations being recorded throughout the analyzed period. Based on April 2023 figures, candied fruit import price decreased by -3.0% against February 2023 indices. The growth pace was the most rapid in October 2022 when the average import price increased by 59% against the previous month. Over the period under review, average import prices hit record highs at $4,380 per ton in February 2023; however, from March 2023 to April 2023, import prices failed to regain momentum.
There were significant differences in the average prices amongst the major supplying countries. In April 2023, the country with the highest price was Italy ($7,548 per ton), while the price for Germany ($2,226 per ton) was amongst the lowest.
From April 2022 to April 2023, the most notable rate of growth in terms of prices was attained by Spain (+4.6%), while the prices for the other major suppliers experienced more modest paces of growth.
Candied Fruit Price in Portugal (FOB) - 2022
In 2022, the average candied fruit export price amounted to $2,343 per ton, growing by 9.3% against the previous year. Over the period under review, the export price, however, saw a slight setback. The most prominent rate of growth was recorded in 2013 when the average export price increased by 22% against the previous year. As a result, the export price attained the peak level of $3,276 per ton. From 2014 to 2022, the average export prices remained at a lower figure.
There were significant differences in the average prices for the major export markets. In 2022, amid the top suppliers, the country with the highest price was Spain ($4,092 per ton), while the average price for exports to France ($1,543 per ton) was amongst the lowest.
From 2012 to 2022, the most notable rate of growth in terms of prices was recorded for supplies to Spain (+9.3%), while the prices for the other major destinations experienced mixed trend patterns.
Candied Fruit Imports in Portugal
In 2022, the amount of candied fruits imported into Portugal dropped to 888 tons, waning by -8.9% against 2021 figures. Over the period under review, imports, however, continue to indicate buoyant growth. The most prominent rate of growth was recorded in 2021 with an increase of 154%. As a result, imports reached the peak of 975 tons, and then reduced in the following year.
In value terms, candied fruit imports surged to $2.9M in 2022. Overall, imports, however, recorded significant growth. The most prominent rate of growth was recorded in 2021 when imports increased by 154% against the previous year. Imports peaked in 2022 and are expected to retain growth in the immediate term.
| Import of Candied Fruit in Portugal (Thousand USD) | |||||
|---|---|---|---|---|---|
| COUNTRY | 2019 | 2020 | 2021 | 2022 | CAGR, 2019-2022 |
| Spain | 845 | 631 | 2,052 | 2,398 | 41.6% |
| Italy | 227 | 156 | 178 | 285 | 7.9% |
| Thailand | N/A | 45.0 | N/A | 72.9 | 27.3% |
| Germany | 6.5 | 14.4 | 62.4 | 29.1 | 64.8% |
| Others | 157 | 100 | 112 | 163 | 1.3% |
| Total | 1,235 | 947 | 2,404 | 2,949 | 33.7% |
Top Suppliers of Candied Fruit to Portugal in 2022:
- Spain (772.0 tons)
- Italy (44.2 tons)
- Germany (20.0 tons)
- Thailand (15.7 tons)
Candied Fruit Exports in Portugal
In 2022, exports of candied fruits from Portugal contracted to 308 tons, with a decrease of -8.4% against the year before. In general, exports saw a abrupt curtailment. The smallest decline of -3.2% was in 2021.
In value terms, candied fruit exports totaled $722K in 2022. Overall, exports showed a abrupt downturn. The growth pace was the most rapid in 2021 with an increase of 9% against the previous year.
| Export of Candied Fruit in Portugal (Thousand USD) | |||||
|---|---|---|---|---|---|
| COUNTRY | 2019 | 2020 | 2021 | 2022 | CAGR, 2019-2022 |
| Angola | 85.2 | 38.9 | 26.2 | 155 | 22.1% |
| France | 157 | 155 | 160 | 148 | -1.9% |
| Luxembourg | 239 | 208 | 187 | 116 | -21.4% |
| Spain | 183 | 34.4 | 30.6 | 85.7 | -22.3% |
| Belgium | 37.2 | 41.7 | 47.0 | 37.7 | 0.4% |
| United States | 59.2 | 77.9 | 107 | 30.5 | -19.8% |
| Uganda | N/A | 6.6 | 19.5 | 24.7 | 93.5% |
| Canada | 29.2 | 18.6 | 18.2 | 21.8 | -9.3% |
| Cabo Verde | 23.5 | 14.8 | 12.4 | 21.2 | -3.4% |
| Others | 93.5 | 65.7 | 113 | 80.4 | -4.9% |
| Total | 907 | 661 | 721 | 722 | -7.3% |
Top Export Markets for Candied Fruit from Portugal in 2022:
- France (96.0 tons)
- Luxembourg (70.6 tons)
- Angola (59.0 tons)
- Spain (20.9 tons)
- Belgium (18.6 tons)
- Uganda (9.8 tons)
- United States (7.8 tons)
- Canada (6.9 tons)
- Cabo Verde (6.4 tons)
This report provides an in-depth analysis of the candied fruit market in Portugal. Within it, you will discover the latest data on market trends and opportunities by country, consumption, production and price developments, as well as the global trade (imports and exports). The forecast exhibits the market prospects through 2030.
Product coverage:
- FCL 625 - Fruit, Nuts, Peel, Sugar Preserved
Country coverage:
- Portugal
Data coverage:
- Market volume and value
- Per Capita consumption
- Forecast of the market dynamics in the medium term
- Trade (exports and imports) in Portugal
- Export and import prices
- Market trends, drivers and restraints
- Key market players and their profiles
Reasons to buy this report:
- Take advantage of the latest data
- Find deeper insights into current market developments
- Discover vital success factors affecting the market
This report is designed for manufacturers, distributors, importers, and wholesalers, as well as for investors, consultants and advisors.
In this report, you can find information that helps you to make informed decisions on the following issues:
- How to diversify your business and benefit from new market opportunities
- How to load your idle production capacity
- How to boost your sales on overseas markets
- How to increase your profit margins
- How to make your supply chain more sustainable
- How to reduce your production and supply chain costs
- How to outsource production to other countries
- How to prepare your business for global expansion
While doing this research, we combine the accumulated expertise of our analysts and the capabilities of artificial intelligence. The AI-based platform, developed by our data scientists, constitutes the key working tool for business analysts, empowering them to discover deep insights and ideas from the marketing data.
-
1. INTRODUCTION
Making Data-Driven Decisions to Grow Your Business
- REPORT DESCRIPTION
- RESEARCH METHODOLOGY AND AI PLATFORM
- DATA-DRIVEN DECISIONS FOR YOUR BUSINESS
- GLOSSARY AND SPECIFIC TERMS
-
2. EXECUTIVE SUMMARY
A Quick Overview of Market Performance
- KEY FINDINGS
- MARKET TRENDS This Chapter is Available Only for the Professional Edition PRO
-
3. MARKET OVERVIEW
Understanding the Current State of The Market and Its Prospects
- MARKET SIZE
- MARKET STRUCTURE
- TRADE BALANCE
- PER CAPITA CONSUMPTION
- MARKET FORECAST TO 2030
-
4. MOST PROMISING PRODUCT
Finding New Products to Diversify Your Business
This Chapter is Available Only for the Professional Edition PRO- TOP PRODUCTS TO DIVERSIFY YOUR BUSINESS
- BEST-SELLING PRODUCTS
- MOST CONSUMED PRODUCT
- MOST TRADED PRODUCT
- MOST PROFITABLE PRODUCT FOR EXPORT
-
5. MOST PROMISING SUPPLYING COUNTRIES
Choosing the Best Countries to Establish Your Sustainable Supply Chain
This Chapter is Available Only for the Professional Edition PRO- TOP COUNTRIES TO SOURCE YOUR PRODUCT
- TOP PRODUCING COUNTRIES
- COUNTRIES WITH TOP YIELDS
- TOP EXPORTING COUNTRIES
- LOW-COST EXPORTING COUNTRIES
-
6. MOST PROMISING OVERSEAS MARKETS
Choosing the Best Countries to Boost Your Exports
This Chapter is Available Only for the Professional Edition PRO- TOP OVERSEAS MARKETS FOR EXPORTING YOUR PRODUCT
- TOP CONSUMING MARKETS
- UNSATURATED MARKETS
- TOP IMPORTING MARKETS
- MOST PROFITABLE MARKETS
7. PRODUCTION
The Latest Trends and Insights into The Industry
- PRODUCTION, HARVESTED AREA AND YIELD
8. IMPORTS
The Largest Import Supplying Countries
- IMPORTS FROM 2012–2023
- IMPORTS BY COUNTRY
- IMPORT PRICES BY COUNTRY
9. EXPORTS
The Largest Destinations for Exports
- EXPORTS FROM 2012–2023
- EXPORTS BY COUNTRY
- EXPORT PRICES BY COUNTRY
-
10. PROFILES OF MAJOR PRODUCERS
The Largest Producers on The Market and Their Profiles
This Chapter is Available Only for the Professional Edition PRO -
LIST OF TABLES
- Key Findings In 2023
- Market Volume, In Physical Terms, 2012–2023
- Market Value, 2012–2023
- Per Capita Consumption In 2012-2023
- Imports, In Physical Terms, By Country, 2012–2023
- Imports, In Value Terms, By Country, 2012–2023
- Import Prices, By Country Of Origin, 2012–2023
- Exports, In Physical Terms, By Country, 2012–2023
- Exports, In Value Terms, By Country, 2012–2023
- Export Prices, By Country Of Destination, 2012–2023
-
LIST OF FIGURES
- Market Volume, In Physical Terms, 2012–2023
- Market Value, 2012–2023
- Market Structure – Domestic Supply vs. Imports, In Physical Terms, 2012-2023
- Market Structure – Domestic Supply vs. Imports, In Value Terms, 2012-2023
- Trade Balance, In Physical Terms, 2012-2023
- Trade Balance, In Value Terms, 2012-2023
- Per Capita Consumption, 2012-2023
- Market Volume Forecast to 2030
- Market Value Forecast to 2030
- Products: Market Size And Growth, By Type
- Products: Average Per Capita Consumption, By Type
- Products: Exports And Growth, By Type
- Products: Export Prices And Growth, By Type
- Production Volume And Growth
- Yield And Growth
- Exports And Growth
- Export Prices And Growth
- Market Size And Growth
- Per Capita Consumption
- Imports And Growth
- Import Prices
- Production, In Physical Terms, 2012–2023
- Production, In Value Terms, 2012–2023
- Area Harvested, 2012–2023
- Yield, 2012–2023
- Imports, In Physical Terms, 2012–2023
- Imports, In Value Terms, 2012–2023
- Imports, In Physical Terms, By Country, 2023
- Imports, In Physical Terms, By Country, 2012–2023
- Imports, In Value Terms, By Country, 2012–2023
- Import Prices, By Country Of Origin, 2012–2023
- Exports, In Physical Terms, 2012–2023
- Exports, In Value Terms, 2012–2023
- Exports, In Physical Terms, By Country, 2023
- Exports, In Physical Terms, By Country, 2012–2023
- Exports, In Value Terms, By Country, 2012–2023
- Export Prices, By Country Of Destination, 2012–2023
This report provides an in-depth analysis of the candied fruit market in Portugal.
This report provides an in-depth analysis of the global candied fruit market.
This report provides an in-depth analysis of the preserved fruit market in Portugal.
This report provides an in-depth analysis of the candied fruit market in Portugal.
Global Preserved Fruit Market Report 2019. This report provides an in-depth analysis of the global preserved fruit market.
This report provides an in-depth analysis of the global candied fruit market.
The global market for candied fruits is on the rise, with increasing demand worldwide. The market is expected to continue growing over the next seven years, with consumption projected to increase in volume and value terms. The article provides insights into market performance, consumption trends, production, imports, and exports of candied fruits.
In value terms, prepared fruits and nuts imports amounted to $X in 2016. Overall, it indicated a prominent growth from 2007 to 2016: the total imports value increased at an average annual rate of +X>
In value terms, prepared fruits and nuts exports totaled $X in 2016. Overall, it indicated a remarkable increase from 2007 to 2016: the total exports value increased at an average annual rate of +X>
Thailand continues to lead the way in the global trade of sugar preserved fruits, nuts and peel. In 2014, Thailand exported X thousand tons of fruits, nuts and peel totaling X million USD, X% over the previous year. Its primary trading partner was


