
U.S. Wood Window and Door Market. Analysis And Forecast to 2030
Get instant access to more than 2 million reports, dashboards, and datasets on the IndexBox Platform.
View PricingNovember 2023 Sees 15% Decline in U.S. Imports of Wood Windows and Doors, Dropping to $79M
U.S. Wood Window and Door Imports
In November 2023, approximately 1.1M units of wood window and door were imported into the United States; waning by -14.3% on the previous month. In general, imports saw a relatively flat trend pattern. The pace of growth appeared the most rapid in May 2023 when imports increased by 9.9% m-o-m. Over the period under review, imports reached the peak figure at 1.4M units in August 2023; however, from September 2023 to November 2023, imports stood at a somewhat lower figure.
In value terms, wood window and door imports plummeted to $79M (IndexBox estimates) in November 2023. Over the period under review, imports showed a relatively flat trend pattern. The most prominent rate of growth was recorded in May 2023 with an increase of 8.5% against the previous month. As a result, imports reached the peak of $99M. From June 2023 to November 2023, the growth of imports remained at a somewhat lower figure.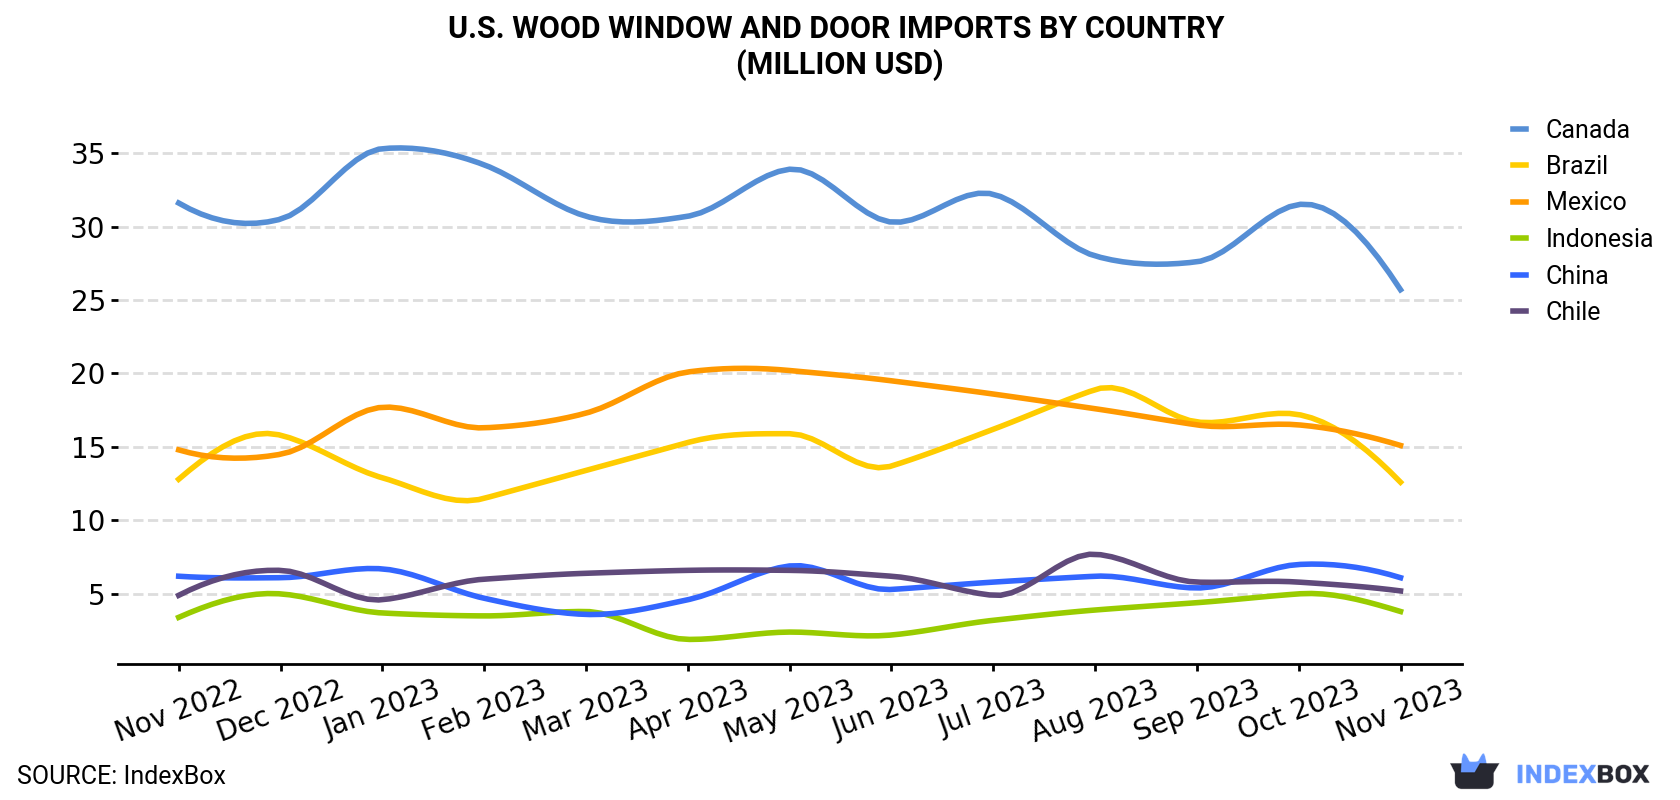
| COUNTRY | Import Value of Wood Window and Door in U.S. (million USD) | ||||||||||||
|---|---|---|---|---|---|---|---|---|---|---|---|---|---|
| Nov 2022 | Dec 2022 | Jan 2023 | Feb 2023 | Mar 2023 | Apr 2023 | May 2023 | Jun 2023 | Jul 2023 | Aug 2023 | Sep 2023 | Oct 2023 | Nov 2023 | |
| Canada | 31.6 | 30.5 | 35.3 | 34.2 | 30.7 | 30.7 | 33.9 | 30.3 | 32.2 | 28.0 | 27.6 | 31.5 | 25.7 |
| Mexico | 14.8 | 14.5 | 17.7 | 16.3 | 17.3 | 20.1 | 20.2 | 19.5 | 18.6 | 17.6 | 16.5 | 16.5 | 15.1 |
| Brazil | 12.8 | 15.8 | 12.9 | 11.5 | 13.4 | 15.3 | 15.9 | 13.7 | 16.2 | 18.9 | 16.7 | 17.2 | 12.6 |
| China | 6.2 | 6.1 | 6.7 | 4.7 | 3.6 | 4.6 | 6.9 | 5.3 | 5.8 | 6.2 | 5.4 | 7.0 | 6.1 |
| Chile | 4.9 | 6.6 | 4.6 | 6.0 | 6.4 | 6.6 | 6.6 | 6.2 | 4.9 | 7.7 | 5.8 | 5.8 | 5.2 |
| Indonesia | 3.4 | 5.0 | 3.7 | 3.5 | 3.8 | 1.9 | 2.4 | 2.2 | 3.2 | 3.9 | 4.4 | 5.0 | 3.8 |
| Others | 12.6 | 11.2 | 13.6 | 8.1 | 9.9 | 12.3 | 13.5 | 12.7 | 15.3 | 11.1 | 10.9 | 10.1 | 10.6 |
| Total | 86.2 | 89.7 | 94.4 | 84.4 | 85.0 | 91.5 | 99.3 | 89.8 | 96.2 | 93.5 | 87.4 | 93.1 | 79.0 |
Imports by Country
Mexico (421K units), Brazil (213K units) and China (145K units) were the main suppliers of wood window and door imports to the United States, together comprising 69% of total imports. These countries were followed by Chile, Canada and Indonesia, which together accounted for a further 21%.
From November 2022 to November 2023, the most notable rate of growth in terms of purchases, amongst the main suppliers, was attained by Indonesia (with a CAGR of +2.3%), while imports for the other leaders experienced more modest paces of growth.
In value terms, the largest wood window and door suppliers to the United States were Canada ($26M), Mexico ($15M) and Brazil ($13M), with a combined 68% share of total imports. China, Chile and Indonesia lagged somewhat behind, together comprising a further 19%.
In terms of the main suppliers, Indonesia, with a CAGR of +1.0%, recorded the highest growth rate of the value of imports, over the period under review, while purchases for the other leaders experienced more modest paces of growth.
Import Prices by Country
In November 2023, the wood window and door price amounted to $70.0 per unit (CIF, US), almost unchanged from the previous month. Over the period under review, the import price continues to indicate a relatively flat trend pattern. The pace of growth was the most pronounced in January 2023 when the average import price increased by 7.8% month-to-month. The import price peaked at $76.0 per unit in March 2023; however, from April 2023 to November 2023, import prices stood at a somewhat lower figure.
Prices varied noticeably by the country of origin: the country with the highest price was Canada ($344 per unit), while the price for Vietnam ($22.7 per unit) was amongst the lowest.
From November 2022 to November 2023, the most notable rate of growth in terms of prices was attained by Canada (+2.5%), while the prices for the other major suppliers experienced more modest paces of growth.
This report provides an in-depth analysis of the market for wood window and door in the U.S.. Within it, you will discover the latest data on market trends and opportunities by country, consumption, production and price developments, as well as the global trade (imports and exports). The forecast exhibits the market prospects through 2030.
Product coverage:
- NAICS 321911 - Wood window and door manufacturing
Companies mentioned:
- Andersen Corporation
- Marvin Lumber and Cedar Company
- Pella Corporation
- Masonite International Corporation
- Ply Gem Industries
- Amarr Company
- Weather Shield Mfg.
- Conestoga Wood Specialties Corporation
- Odl Incorporated
- Judson Enterprises
- Decore-Ative Specialties
- Bright Wood Corporation
- Woodharbor Molding & Millworks
- Marshfield Doorsystems
- Truth Hardware Corporation
- Marvins Windows and Doors of Tennessee, Steves & Sons
- Eggers Industries
- T. M. Cobb Company
- Cascade Ohio
- Mohawk Flush Doors
- Mw Manufacturers
- Marvin Windows of Tennessee
- Masonite Corporation
- Roberts Trading Corporation
- US Test Company 201
- Hwd Acquisition
- Clopay Building Products Company
- Masonite Holdings
- The Cook & Boardman Group
Country coverage:
- United States
Data coverage:
- Market volume and value
- Per Capita consumption
- Forecast of the market dynamics in the medium term
- Trade (exports and imports) in the U.S.
- Export and import prices
- Market trends, drivers and restraints
- Key market players and their profiles
Reasons to buy this report:
- Take advantage of the latest data
- Find deeper insights into current market developments
- Discover vital success factors affecting the market
This report is designed for manufacturers, distributors, importers, and wholesalers, as well as for investors, consultants and advisors.
In this report, you can find information that helps you to make informed decisions on the following issues:
- How to diversify your business and benefit from new market opportunities
- How to load your idle production capacity
- How to boost your sales on overseas markets
- How to increase your profit margins
- How to make your supply chain more sustainable
- How to reduce your production and supply chain costs
- How to outsource production to other countries
- How to prepare your business for global expansion
While doing this research, we combine the accumulated expertise of our analysts and the capabilities of artificial intelligence. The AI-based platform, developed by our data scientists, constitutes the key working tool for business analysts, empowering them to discover deep insights and ideas from the marketing data.
-
1. INTRODUCTION
Making Data-Driven Decisions to Grow Your Business
- REPORT DESCRIPTION
- RESEARCH METHODOLOGY AND AI PLATFORM
- DATA-DRIVEN DECISIONS FOR YOUR BUSINESS
- GLOSSARY AND SPECIFIC TERMS
-
2. EXECUTIVE SUMMARY
A Quick Overview of Market Performance
- KEY FINDINGS
- MARKET TRENDS This Chapter is Available Only for the Professional Edition PRO
-
3. MARKET OVERVIEW
Understanding the Current State of The Market and Its Prospects
- MARKET SIZE
- MARKET STRUCTURE
- TRADE BALANCE
- PER CAPITA CONSUMPTION
- MARKET FORECAST TO 2030
-
4. MOST PROMISING PRODUCT
Finding New Products to Diversify Your Business
This Chapter is Available Only for the Professional Edition PRO- TOP PRODUCTS TO DIVERSIFY YOUR BUSINESS
- BEST-SELLING PRODUCTS
- MOST CONSUMED PRODUCT
- MOST TRADED PRODUCT
- MOST PROFITABLE PRODUCT FOR EXPORT
-
5. MOST PROMISING SUPPLYING COUNTRIES
Choosing the Best Countries to Establish Your Sustainable Supply Chain
This Chapter is Available Only for the Professional Edition PRO- TOP COUNTRIES TO SOURCE YOUR PRODUCT
- TOP PRODUCING COUNTRIES
- TOP EXPORTING COUNTRIES
- LOW-COST EXPORTING COUNTRIES
-
6. MOST PROMISING OVERSEAS MARKETS
Choosing the Best Countries to Boost Your Exports
This Chapter is Available Only for the Professional Edition PRO- TOP OVERSEAS MARKETS FOR EXPORTING YOUR PRODUCT
- TOP CONSUMING MARKETS
- UNSATURATED MARKETS
- TOP IMPORTING MARKETS
- MOST PROFITABLE MARKETS
7. PRODUCTION
The Latest Trends and Insights into The Industry
- PRODUCTION VOLUME AND VALUE
8. IMPORTS
The Largest Import Supplying Countries
- IMPORTS FROM 2012–2023
- IMPORTS BY COUNTRY
- IMPORT PRICES BY COUNTRY
9. EXPORTS
The Largest Destinations for Exports
- EXPORTS FROM 2012–2023
- EXPORTS BY COUNTRY
- EXPORT PRICES BY COUNTRY
-
10. PROFILES OF MAJOR PRODUCERS
The Largest Producers on The Market and Their Profiles
This Chapter is Available Only for the Professional Edition PRO -
LIST OF TABLES
- Key Findings In 2023
- Market Volume, In Physical Terms, 2012–2023
- Market Value, 2012–2023
- Per Capita Consumption In 2012-2023
- Imports, In Physical Terms, By Country, 2012–2023
- Imports, In Value Terms, By Country, 2012–2023
- Import Prices, By Country Of Origin, 2012–2023
- Exports, In Physical Terms, By Country, 2012–2023
- Exports, In Value Terms, By Country, 2012–2023
- Export Prices, By Country Of Destination, 2012–2023
-
LIST OF FIGURES
- Market Volume, In Physical Terms, 2012–2023
- Market Value, 2012–2023
- Market Structure – Domestic Supply vs. Imports, In Physical Terms, 2012-2023
- Market Structure – Domestic Supply vs. Imports, In Value Terms, 2012-2023
- Trade Balance, In Physical Terms, 2012-2023
- Trade Balance, In Value Terms, 2012-2023
- Per Capita Consumption, 2012-2023
- Market Volume Forecast to 2030
- Market Value Forecast to 2030
- Products: Market Size And Growth, By Type
- Products: Average Per Capita Consumption, By Type
- Products: Exports And Growth, By Type
- Products: Export Prices And Growth, By Type
- Production Volume And Growth
- Exports And Growth
- Export Prices And Growth
- Market Size And Growth
- Per Capita Consumption
- Imports And Growth
- Import Prices
- Production, In Physical Terms, 2012–2023
- Production, In Value Terms, 2012–2023
- Imports, In Physical Terms, 2012–2023
- Imports, In Value Terms, 2012–2023
- Imports, In Physical Terms, By Country, 2023
- Imports, In Physical Terms, By Country, 2012–2023
- Imports, In Value Terms, By Country, 2012–2023
- Import Prices, By Country Of Origin, 2012–2023
- Exports, In Physical Terms, 2012–2023
- Exports, In Value Terms, 2012–2023
- Exports, In Physical Terms, By Country, 2023
- Exports, In Physical Terms, By Country, 2012–2023
- Exports, In Value Terms, By Country, 2012–2023
- Export Prices, By Country Of Destination, 2012–2023


