
U.S. Scale And Balance Market. Analysis And Forecast to 2030
Get instant access to more than 2 million reports, dashboards, and datasets on the IndexBox Platform.
View PricingImport of Scales and Balances in the United States Decreases to $942M in 2023
U.S. Scale And Balance Imports
In 2023, approx. 84K tons of scales and balances were imported into the United States; growing by 27% against 2022 figures. In general, total imports indicated a buoyant expansion from 2013 to 2023: its volume increased at an average annual rate of +6.3% over the last decade. The trend pattern, however, indicated some noticeable fluctuations being recorded throughout the analyzed period. Based on 2023 figures, imports increased by +94.8% against 2017 indices. The most prominent rate of growth was recorded in 2020 with an increase of 28% against the previous year. Over the period under review, imports attained the peak figure in 2023 and are expected to retain growth in the near future.
In value terms, scale and balance imports dropped modestly to $942M (IndexBox estimates) in 2023. The total import value increased at an average annual rate of +2.0% over the period from 2013 to 2023; however, the trend pattern remained consistent, with only minor fluctuations being recorded in certain years. The pace of growth was the most pronounced in 2021 with an increase of 23% against the previous year. Over the period under review, imports reached the maximum at $976M in 2022, and then dropped in the following year.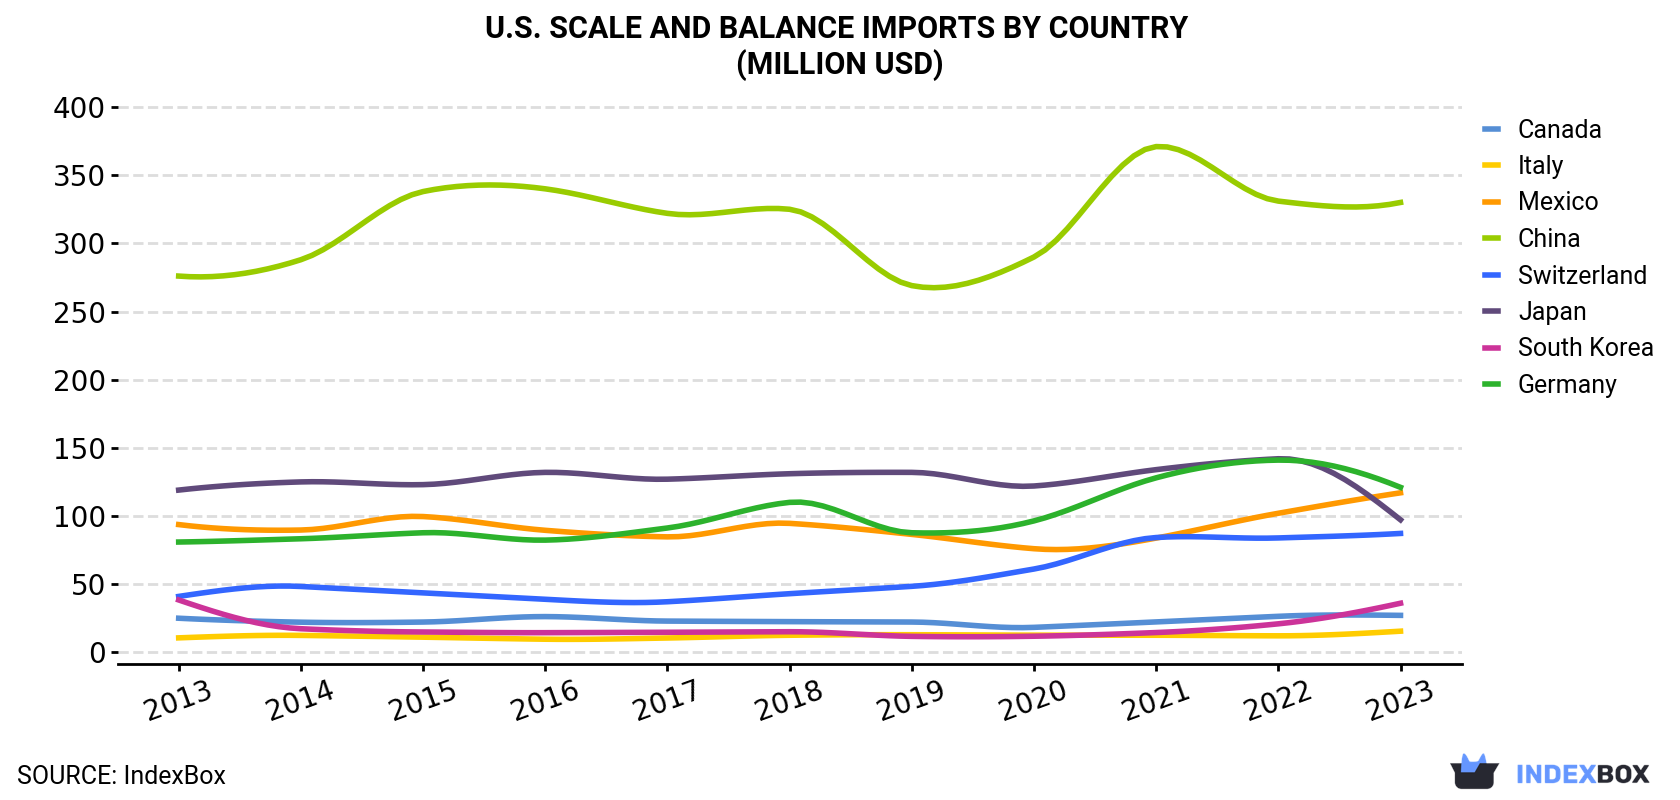
| COUNTRY | Import Value of Scale And Balance in U.S. (million USD) | ||||||||||
|---|---|---|---|---|---|---|---|---|---|---|---|
| 2013 | 2014 | 2015 | 2016 | 2017 | 2018 | 2019 | 2020 | 2021 | 2022 | 2023 | |
| China | 276 | 288 | 338 | 340 | 322 | 325 | 269 | 290 | 371 | 331 | 330 |
| Germany | 80.9 | 83.3 | 87.7 | 82.3 | 91.2 | 110 | 87.7 | 96.4 | 128 | 141 | 121 |
| Mexico | 93.7 | 89.7 | 99.6 | 89.5 | 84.7 | 94.6 | 86.5 | 76.0 | 83.8 | 102 | 117 |
| Japan | 119 | 125 | 123 | 132 | 127 | 131 | 132 | 122 | 134 | 142 | 97.2 |
| Switzerland | 41.0 | 48.3 | 43.6 | 38.9 | 37.1 | 43.0 | 48.4 | 61.1 | 84.2 | 83.9 | 87.2 |
| South Korea | 38.4 | 17.3 | 14.9 | 14.4 | 14.7 | 15.1 | 11.7 | 11.8 | 14.5 | 20.9 | 36.0 |
| Canada | 25.0 | 22.1 | 22.2 | 26.2 | 22.9 | 22.5 | 22.2 | 18.3 | 22.3 | 26.4 | 27.1 |
| Italy | 10.6 | 12.4 | 11.1 | 9.6 | 10.5 | 12.5 | 12.9 | 12.6 | 12.5 | 12.1 | 15.5 |
| Others | 89.8 | 79.7 | 81.1 | 77.8 | 89.8 | 103 | 90.4 | 88.1 | 104 | 118 | 110 |
| Total | 774 | 766 | 821 | 811 | 799 | 856 | 761 | 776 | 954 | 976 | 942 |
Imports by Country
In 2023, China (74K tons) constituted the largest supplier of scale and balance to the United States, accounting for a 88% share of total imports. It was followed by South Korea (2.4K tons), with a 2.9% share of total imports. The third position in this ranking was held by Mexico (1.9K tons), with a 2.3% share.
From 2013 to 2023, the average annual rate of growth in terms of volume from China amounted to +7.1%. The remaining supplying countries recorded the following average annual rates of imports growth: South Korea (+15.4% per year) and Mexico (-4.5% per year).
In value terms, China ($330M) constituted the largest supplier of scales and balances to the United States, comprising 35% of total imports. The second position in the ranking was taken by Germany ($121M), with a 13% share of total imports. It was followed by Mexico, with a 12% share.
From 2013 to 2023, the average annual rate of growth in terms of value from China stood at +1.8%. The remaining supplying countries recorded the following average annual rates of imports growth: Germany (+4.1% per year) and Mexico (+2.3% per year).
Import Prices by Country
In 2023, the scale and balance price stood at $11,218 per ton (CIF, US), waning by -24.3% against the previous year. Overall, the import price continues to indicate a noticeable shrinkage. The pace of growth was the most pronounced in 2014 an increase of 5.5%. Over the period under review, average import prices reached the maximum at $19,419 per ton in 2018; however, from 2019 to 2023, import prices stood at a somewhat lower figure.
There were significant differences in the average prices amongst the major supplying countries. In 2023, amid the top importers, the country with the highest price was Japan ($152,034 per ton), while the price for China ($4,480 per ton) was amongst the lowest.
From 2013 to 2023, the most notable rate of growth in terms of prices was attained by Japan (+11.6%), while the prices for the other major suppliers experienced mixed trend patterns.
This report provides an in-depth analysis of the scale and balance market in the U.S.. Within it, you will discover the latest data on market trends and opportunities by country, consumption, production and price developments, as well as the global trade (imports and exports). The forecast exhibits the market prospects through 2030.
Product coverage:
- NAICS 333997 - Scale and balance manufacturing
Companies mentioned:
- Mettler-Toledo International Inc.
- Rice Lake Weighing Systems
- Avery Weigh-Tronix
- Digi-Star
- Mettler-Toledo
- Fairbanks Scales
- Merrick Industries
- Gps Insight
- Intercomp Co.
- Cardinal Scale Manufacturing Company
- Parr Instrument Company
- Hitachi Chemical Diagnostics
- Measurement Systems International
- Hyer Industries
- General Electrodynamics Corp
- Belt-Way Scales
- Pennsylvania Scale Company
- Vishay Blh
- The A H Emery Company
- E. Rowe Foundry & Machine Company
- Zurex Corporation
- Precision Analysis
- Mettler-Toledo
- Thermo Ramsey
- Cat Scale Company
- Ets-Lindgren
- Winslow Scale Company
- Unibridge Systems
- Fancor
- Tannehill International Industries
- Digi-Star Holdings
Country coverage:
- United States
Data coverage:
- Market volume and value
- Per Capita consumption
- Forecast of the market dynamics in the medium term
- Trade (exports and imports) in the U.S.
- Export and import prices
- Market trends, drivers and restraints
- Key market players and their profiles
Reasons to buy this report:
- Take advantage of the latest data
- Find deeper insights into current market developments
- Discover vital success factors affecting the market
This report is designed for manufacturers, distributors, importers, and wholesalers, as well as for investors, consultants and advisors.
In this report, you can find information that helps you to make informed decisions on the following issues:
- How to diversify your business and benefit from new market opportunities
- How to load your idle production capacity
- How to boost your sales on overseas markets
- How to increase your profit margins
- How to make your supply chain more sustainable
- How to reduce your production and supply chain costs
- How to outsource production to other countries
- How to prepare your business for global expansion
While doing this research, we combine the accumulated expertise of our analysts and the capabilities of artificial intelligence. The AI-based platform, developed by our data scientists, constitutes the key working tool for business analysts, empowering them to discover deep insights and ideas from the marketing data.
-
1. INTRODUCTION
Making Data-Driven Decisions to Grow Your Business
- REPORT DESCRIPTION
- RESEARCH METHODOLOGY AND AI PLATFORM
- DATA-DRIVEN DECISIONS FOR YOUR BUSINESS
- GLOSSARY AND SPECIFIC TERMS
-
2. EXECUTIVE SUMMARY
A Quick Overview of Market Performance
- KEY FINDINGS
- MARKET TRENDS This Chapter is Available Only for the Professional Edition PRO
-
3. MARKET OVERVIEW
Understanding the Current State of The Market and Its Prospects
- MARKET SIZE
- MARKET STRUCTURE
- TRADE BALANCE
- PER CAPITA CONSUMPTION
- MARKET FORECAST TO 2030
-
4. MOST PROMISING PRODUCT
Finding New Products to Diversify Your Business
This Chapter is Available Only for the Professional Edition PRO- TOP PRODUCTS TO DIVERSIFY YOUR BUSINESS
- BEST-SELLING PRODUCTS
- MOST CONSUMED PRODUCT
- MOST TRADED PRODUCT
- MOST PROFITABLE PRODUCT FOR EXPORT
-
5. MOST PROMISING SUPPLYING COUNTRIES
Choosing the Best Countries to Establish Your Sustainable Supply Chain
This Chapter is Available Only for the Professional Edition PRO- TOP COUNTRIES TO SOURCE YOUR PRODUCT
- TOP PRODUCING COUNTRIES
- TOP EXPORTING COUNTRIES
- LOW-COST EXPORTING COUNTRIES
-
6. MOST PROMISING OVERSEAS MARKETS
Choosing the Best Countries to Boost Your Exports
This Chapter is Available Only for the Professional Edition PRO- TOP OVERSEAS MARKETS FOR EXPORTING YOUR PRODUCT
- TOP CONSUMING MARKETS
- UNSATURATED MARKETS
- TOP IMPORTING MARKETS
- MOST PROFITABLE MARKETS
7. PRODUCTION
The Latest Trends and Insights into The Industry
- PRODUCTION VOLUME AND VALUE
8. IMPORTS
The Largest Import Supplying Countries
- IMPORTS FROM 2012–2023
- IMPORTS BY COUNTRY
- IMPORT PRICES BY COUNTRY
9. EXPORTS
The Largest Destinations for Exports
- EXPORTS FROM 2012–2023
- EXPORTS BY COUNTRY
- EXPORT PRICES BY COUNTRY
-
10. PROFILES OF MAJOR PRODUCERS
The Largest Producers on The Market and Their Profiles
This Chapter is Available Only for the Professional Edition PRO -
LIST OF TABLES
- Key Findings In 2023
- Market Volume, In Physical Terms, 2012–2023
- Market Value, 2012–2023
- Per Capita Consumption In 2012-2023
- Imports, In Physical Terms, By Country, 2012–2023
- Imports, In Value Terms, By Country, 2012–2023
- Import Prices, By Country Of Origin, 2012–2023
- Exports, In Physical Terms, By Country, 2012–2023
- Exports, In Value Terms, By Country, 2012–2023
- Export Prices, By Country Of Destination, 2012–2023
-
LIST OF FIGURES
- Market Volume, In Physical Terms, 2012–2023
- Market Value, 2012–2023
- Market Structure – Domestic Supply vs. Imports, In Physical Terms, 2012-2023
- Market Structure – Domestic Supply vs. Imports, In Value Terms, 2012-2023
- Trade Balance, In Physical Terms, 2012-2023
- Trade Balance, In Value Terms, 2012-2023
- Per Capita Consumption, 2012-2023
- Market Volume Forecast to 2030
- Market Value Forecast to 2030
- Products: Market Size And Growth, By Type
- Products: Average Per Capita Consumption, By Type
- Products: Exports And Growth, By Type
- Products: Export Prices And Growth, By Type
- Production Volume And Growth
- Exports And Growth
- Export Prices And Growth
- Market Size And Growth
- Per Capita Consumption
- Imports And Growth
- Import Prices
- Production, In Physical Terms, 2012–2023
- Production, In Value Terms, 2012–2023
- Imports, In Physical Terms, 2012–2023
- Imports, In Value Terms, 2012–2023
- Imports, In Physical Terms, By Country, 2023
- Imports, In Physical Terms, By Country, 2012–2023
- Imports, In Value Terms, By Country, 2012–2023
- Import Prices, By Country Of Origin, 2012–2023
- Exports, In Physical Terms, 2012–2023
- Exports, In Value Terms, 2012–2023
- Exports, In Physical Terms, By Country, 2023
- Exports, In Physical Terms, By Country, 2012–2023
- Exports, In Value Terms, By Country, 2012–2023
- Export Prices, By Country Of Destination, 2012–2023


