
U.S. - Photographic (Other Than Cinematographic) Cameras - Market Analysis, Forecast, Size, Trends and Insights
Get instant access to more than 2 million reports, dashboards, and datasets on the IndexBox Platform.
View PricingSeptember 2023 Sees a Small Increase in U.S. Import of Photo Cameras Worth $22M
U.S. Photo Camera Imports
In September 2023, photo camera imports into the United States soared to 898K units, rising by 36% compared with August 2023. In general, imports recorded temperate growth. The most prominent rate of growth was recorded in February 2023 when imports increased by 44% month-to-month. Imports peaked in September 2023.
In value terms, photo camera imports expanded modestly to $22M (IndexBox estimates) in September 2023. Over the period under review, imports saw a relatively flat trend pattern. The growth pace was the most rapid in March 2023 with an increase of 31% m-o-m. Over the period under review, imports hit record highs at 26M units in October 2022; however, from November 2022 to September 2023, imports stood at a somewhat lower figure.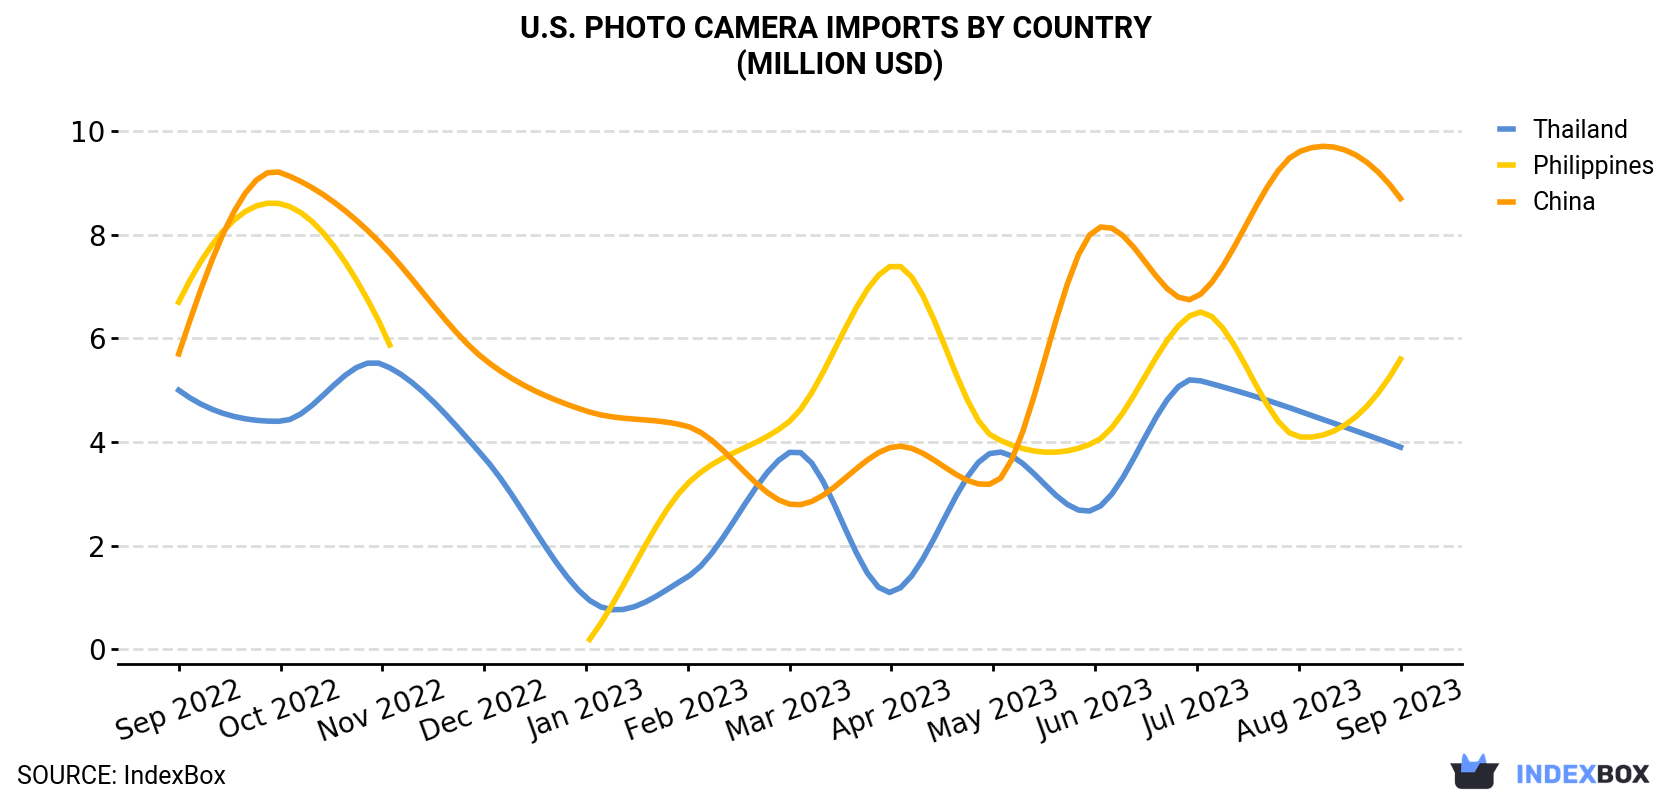
| COUNTRY | Import Value of Photo Camera in U.S. (million USD) | ||||||||||||
|---|---|---|---|---|---|---|---|---|---|---|---|---|---|
| Sep 2022 | Oct 2022 | Nov 2022 | Dec 2022 | Jan 2023 | Feb 2023 | Mar 2023 | Apr 2023 | May 2023 | Jun 2023 | Jul 2023 | Aug 2023 | Sep 2023 | |
| China | 5.7 | 9.2 | 7.8 | 5.6 | 4.6 | 4.3 | 2.8 | 3.9 | 3.2 | 8.1 | 6.8 | 9.6 | 8.7 |
| Philippines | 6.7 | 8.6 | 6.2 | N/A | 0.1 | 3.2 | 4.4 | 7.4 | 4.1 | 4.0 | 6.5 | 4.1 | 5.6 |
| Thailand | 5.0 | 4.4 | 5.5 | 3.7 | 1.0 | 1.4 | 3.8 | 1.1 | 3.8 | 2.7 | 5.2 | 4.6 | 3.9 |
| Others | 2.8 | 3.5 | 4.0 | 3.2 | 4.0 | 3.0 | 4.6 | 3.7 | 6.2 | 4.2 | 3.9 | 3.8 | 4.2 |
| Total | 20.2 | 25.6 | 23.4 | 12.5 | 9.7 | 11.9 | 15.5 | 16.1 | 17.3 | 19.0 | 22.3 | 22.1 | 22.5 |
Imports by Country
In September 2023, China (599K units) constituted the largest supplier of photo camera to the United States, accounting for a 67% share of total imports. Moreover, photo camera imports from China exceeded the figures recorded by the second-largest supplier, the Philippines (157K units), fourfold.
From September 2022 to September 2023, the average monthly growth rate of volume from China totaled +9.1%. The remaining supplying countries recorded the following average monthly rates of imports growth: the Philippines (-0.5% per month) and Thailand (-1.2% per month).
In value terms, the largest photo camera suppliers to the United States were China ($8.7M), the Philippines ($5.6M) and Thailand ($3.9M), with a combined 81% share of total imports.
Among the main suppliers, China, with a CAGR of +3.6%, saw the highest growth rate of the value of imports, over the period under review, while purchases for the other leaders experienced a decline.
Imports by Type
Cameras, photographic (excluding cinematographic); of a kind (not SLR) for roll film of a width of 35mm (472K units), cameras, photographic (excluding cinematographic); instant print cameras (416K units) and cameras, photographic (excluding cinematographic); specially designed for underwater use, aerial survey, medical or surgical examination of internal organs; comparison cameras for forensic or criminological use (5.3K units) were the main products of photo camera imports to the United States, with a combined 100% share of total imports.
From September 2022 to September 2023, the biggest increases were in cameras, photographic (excluding cinematographic); of a kind (not SLR) for roll film of a width of 35mm (with a CAGR of +14.6%), while purchases for the other products experienced mixed trend patterns.
In value terms, cameras, photographic (excluding cinematographic); instant print cameras ($17M) constituted the largest type of photo camera supplied to the United States, comprising 74% of total imports. The second position in the ranking was taken by cameras, photographic (excluding cinematographic); of a kind (not SLR) for roll film of a width of 35mm ($2.9M), with a 13% share of total imports. It was followed by cameras, photographic (excluding cinematographic); specially designed for underwater use, aerial survey, medical or surgical examination of internal organs; comparison cameras for forensic or criminological use, with a 7.2% share.
Import Prices by Country
In September 2023, the photo camera price amounted to $25.1 per unit (CIF, US), which is down by -25.4% against the previous month. Overall, the import price continues to indicate a noticeable descent. The pace of growth was the most pronounced in April 2023 when the average import price increased by 59% m-o-m. As a result, import price reached the peak level of $51,189 per thousand units. From May 2023 to September 2023, the average import prices remained at a lower figure.
There were significant differences in the average prices amongst the major supplying countries. In September 2023, the country with the highest price was the Philippines ($35.6 per unit), while the price for China ($14.6 per unit) was amongst the lowest.
From September 2022 to September 2023, the most notable rate of growth in terms of prices was attained by Thailand (-0.7%), while the prices for the other major suppliers experienced a decline.
This report provides an in-depth analysis of the photo camera market in the U.S.. Within it, you will discover the latest data on market trends and opportunities by country, consumption, production and price developments, as well as the global trade (imports and exports). The forecast exhibits the market prospects through 2030.
Product coverage:
- Prodcom 26701250 - Cameras of a kind used for preparing printing plates or cylinders, cameras specially designed for underwater use, for aerial survey or for medical or surgical examination of internal organs, comparison cameras for forensic or criminological laboratories
- Prodcom 26701400 - Instant print cameras and other cameras (excluding digital cameras, cameras of a kind used for preparing printing plates or cylinders as well as cameras specially designed for underwater use, for aerial survey or for medical or surgical examination of internal organs, comparison cameras for forensic or criminological laboratories)
Country coverage:
- United States
Data coverage:
- Market volume and value
- Per Capita consumption
- Forecast of the market dynamics in the medium term
- Trade (exports and imports) in the U.S.
- Export and import prices
- Market trends, drivers and restraints
- Key market players and their profiles
Reasons to buy this report:
- Take advantage of the latest data
- Find deeper insights into current market developments
- Discover vital success factors affecting the market
This report is designed for manufacturers, distributors, importers, and wholesalers, as well as for investors, consultants and advisors.
In this report, you can find information that helps you to make informed decisions on the following issues:
- How to diversify your business and benefit from new market opportunities
- How to load your idle production capacity
- How to boost your sales on overseas markets
- How to increase your profit margins
- How to make your supply chain more sustainable
- How to reduce your production and supply chain costs
- How to outsource production to other countries
- How to prepare your business for global expansion
While doing this research, we combine the accumulated expertise of our analysts and the capabilities of artificial intelligence. The AI-based platform, developed by our data scientists, constitutes the key working tool for business analysts, empowering them to discover deep insights and ideas from the marketing data.
-
1. INTRODUCTION
Making Data-Driven Decisions to Grow Your Business
- REPORT DESCRIPTION
- RESEARCH METHODOLOGY AND AI PLATFORM
- DATA-DRIVEN DECISIONS FOR YOUR BUSINESS
- GLOSSARY AND SPECIFIC TERMS
-
2. EXECUTIVE SUMMARY
A Quick Overview of Market Performance
- KEY FINDINGS
- MARKET TRENDS This Chapter is Available Only for the Professional Edition PRO
-
3. MARKET OVERVIEW
Understanding the Current State of The Market and Its Prospects
- MARKET SIZE
- MARKET STRUCTURE
- TRADE BALANCE
- PER CAPITA CONSUMPTION
- MARKET FORECAST TO 2030
-
4. MOST PROMISING PRODUCT
Finding New Products to Diversify Your Business
This Chapter is Available Only for the Professional Edition PRO- TOP PRODUCTS TO DIVERSIFY YOUR BUSINESS
- BEST-SELLING PRODUCTS
- MOST CONSUMED PRODUCT
- MOST TRADED PRODUCT
- MOST PROFITABLE PRODUCT FOR EXPORT
-
5. MOST PROMISING SUPPLYING COUNTRIES
Choosing the Best Countries to Establish Your Sustainable Supply Chain
This Chapter is Available Only for the Professional Edition PRO- TOP COUNTRIES TO SOURCE YOUR PRODUCT
- TOP PRODUCING COUNTRIES
- TOP EXPORTING COUNTRIES
- LOW-COST EXPORTING COUNTRIES
-
6. MOST PROMISING OVERSEAS MARKETS
Choosing the Best Countries to Boost Your Exports
This Chapter is Available Only for the Professional Edition PRO- TOP OVERSEAS MARKETS FOR EXPORTING YOUR PRODUCT
- TOP CONSUMING MARKETS
- UNSATURATED MARKETS
- TOP IMPORTING MARKETS
- MOST PROFITABLE MARKETS
7. PRODUCTION
The Latest Trends and Insights into The Industry
- PRODUCTION VOLUME AND VALUE
8. IMPORTS
The Largest Import Supplying Countries
- IMPORTS FROM 2012–2023
- IMPORTS BY COUNTRY
- IMPORT PRICES BY COUNTRY
9. EXPORTS
The Largest Destinations for Exports
- EXPORTS FROM 2012–2023
- EXPORTS BY COUNTRY
- EXPORT PRICES BY COUNTRY
-
10. PROFILES OF MAJOR PRODUCERS
The Largest Producers on The Market and Their Profiles
This Chapter is Available Only for the Professional Edition PRO -
LIST OF TABLES
- Key Findings In 2023
- Market Volume, In Physical Terms, 2012–2023
- Market Value, 2012–2023
- Per Capita Consumption In 2012-2023
- Imports, In Physical Terms, By Country, 2012–2023
- Imports, In Value Terms, By Country, 2012–2023
- Import Prices, By Country Of Origin, 2012–2023
- Exports, In Physical Terms, By Country, 2012–2023
- Exports, In Value Terms, By Country, 2012–2023
- Export Prices, By Country Of Destination, 2012–2023
-
LIST OF FIGURES
- Market Volume, In Physical Terms, 2012–2023
- Market Value, 2012–2023
- Market Structure – Domestic Supply vs. Imports, In Physical Terms, 2012-2023
- Market Structure – Domestic Supply vs. Imports, In Value Terms, 2012-2023
- Trade Balance, In Physical Terms, 2012-2023
- Trade Balance, In Value Terms, 2012-2023
- Per Capita Consumption, 2012-2023
- Market Volume Forecast to 2030
- Market Value Forecast to 2030
- Products: Market Size And Growth, By Type
- Products: Average Per Capita Consumption, By Type
- Products: Exports And Growth, By Type
- Products: Export Prices And Growth, By Type
- Production Volume And Growth
- Exports And Growth
- Export Prices And Growth
- Market Size And Growth
- Per Capita Consumption
- Imports And Growth
- Import Prices
- Production, In Physical Terms, 2012–2023
- Production, In Value Terms, 2012–2023
- Imports, In Physical Terms, 2012–2023
- Imports, In Value Terms, 2012–2023
- Imports, In Physical Terms, By Country, 2023
- Imports, In Physical Terms, By Country, 2012–2023
- Imports, In Value Terms, By Country, 2012–2023
- Import Prices, By Country Of Origin, 2012–2023
- Exports, In Physical Terms, 2012–2023
- Exports, In Value Terms, 2012–2023
- Exports, In Physical Terms, By Country, 2023
- Exports, In Physical Terms, By Country, 2012–2023
- Exports, In Value Terms, By Country, 2012–2023
- Export Prices, By Country Of Destination, 2012–2023


