U.S. Metal Household Furniture Market. Analysis And Forecast to 2030
Get instant access to more than 2 million reports, dashboards, and datasets on the IndexBox Platform.
View PricingPrice of Metal Household Furniture in the U.S. Drops by 3% to $3,548 per Ton
U.S. Metal Household Furniture Import Price in June 2023
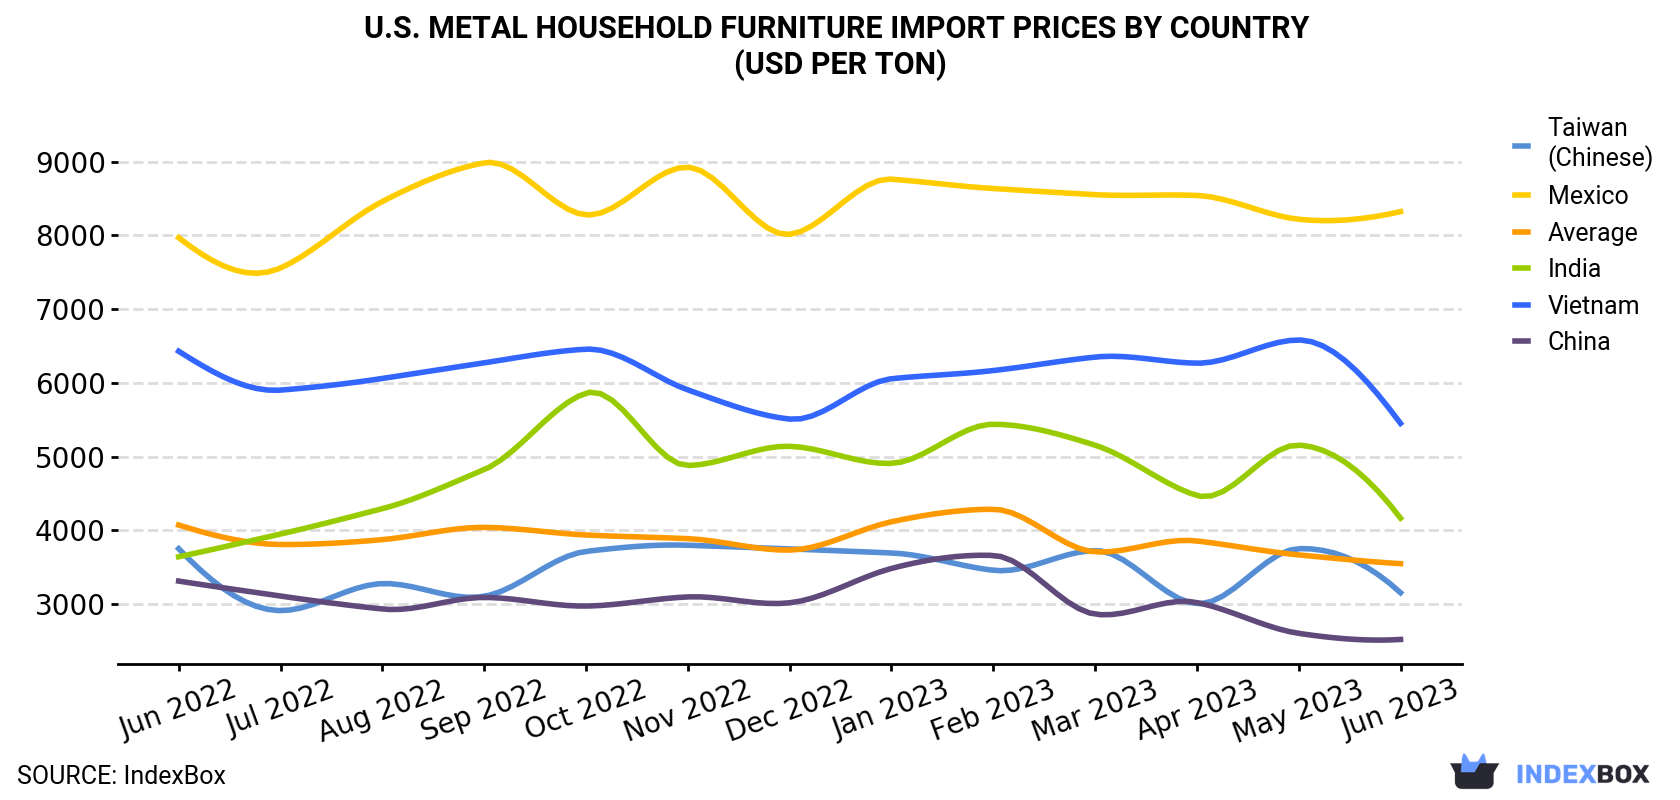
In June 2023, the metal household furniture price stood at $3,548 per ton (CIF, US), falling by -3.2% against the previous month. Over the period under review, the import price showed a slight slump. The growth pace was the most rapid in January 2023 an increase of 10% m-o-m. The import price peaked at $4,286 per ton in February 2023; however, from March 2023 to June 2023, import prices failed to regain momentum.
Prices varied noticeably by the country of origin: the country with the highest price was Mexico ($8,323 per ton), while the price for China ($2,520 per ton) was amongst the lowest.
From June 2022 to June 2023, the most notable rate of growth in terms of prices was attained by India (+1.1%), while the prices for the other major suppliers experienced mixed trend patterns.
| COUNTRY | Import Price of Metal Household Furniture in U.S. (USD per ton) | ||||||||||||
|---|---|---|---|---|---|---|---|---|---|---|---|---|---|
| Jun 2022 | Jul 2022 | Aug 2022 | Sep 2022 | Oct 2022 | Nov 2022 | Dec 2022 | Jan 2023 | Feb 2023 | Mar 2023 | Apr 2023 | May 2023 | Jun 2023 | |
| Mexico | 7,969 | 7,558 | 8,460 | 8,985 | 8,278 | 8,926 | 8,014 | 8,763 | 8,636 | 8,553 | 8,542 | 8,219 | 8,323 |
| Vietnam | 6,429 | 5,902 | 6,060 | 6,272 | 6,457 | 5,905 | 5,509 | 6,056 | 6,167 | 6,350 | 6,267 | 6,582 | 5,451 |
| India | 3,642 | 3,950 | 4,294 | 4,824 | 5,862 | 4,879 | 5,140 | 4,908 | 5,439 | 5,155 | 4,472 | 5,156 | 4,165 |
| Taiwan (Chinese) | 3,751 | 2,911 | 3,278 | 3,105 | 3,714 | 3,798 | 3,748 | 3,693 | 3,458 | 3,726 | 3,005 | 3,752 | 3,154 |
| China | 3,312 | 3,109 | 2,933 | 3,090 | 2,973 | 3,097 | 3,017 | 3,483 | 3,660 | 2,863 | 3,021 | 2,603 | 2,520 |
| Average | 4,072 | 3,808 | 3,874 | 4,040 | 3,937 | 3,887 | 3,732 | 4,116 | 4,286 | 3,708 | 3,856 | 3,667 | 3,548 |
U.S. Metal Household Furniture Imports
In June 2023, approximately 95K tons of metal household furniture were imported into the United States; reducing by -3.6% on the month before. Overall, imports showed a pronounced decrease. The growth pace was the most rapid in November 2022 with an increase of 14% m-o-m.
In value terms, metal household furniture imports dropped to $336M (IndexBox estimates) in June 2023. In general, imports continue to indicate a noticeable descent. The most prominent rate of growth was recorded in November 2022 when imports increased by 13% month-to-month.
U.S. Metal Household Furniture Imports by Country
In June 2023, China (64K tons) constituted the largest supplier of metal household furniture to the United States, with a 68% share of total imports. Moreover, metal household furniture imports from China exceeded the figures recorded by the second-largest supplier, Vietnam (11K tons), sixfold. Taiwan (Chinese) (9.8K tons) ranked third in terms of total imports with a 10% share.
From June 2022 to June 2023, the average monthly rate of growth in terms of volume from China totaled -3.0%. The remaining supplying countries recorded the following average monthly rates of imports growth: Vietnam (-0.7% per month) and Taiwan (Chinese) (+7.4% per month).
In value terms, China ($161M) constituted the largest supplier of metal household furniture to the United States, comprising 48% of total imports. The second position in the ranking was held by Vietnam ($60M), with an 18% share of total imports. It was followed by Taiwan (Chinese), with a 9.2% share.
From June 2022 to June 2023, the average monthly growth rate of value from China amounted to -5.2%. The remaining supplying countries recorded the following average monthly rates of imports growth: Vietnam (-2.1% per month) and Taiwan (Chinese) (+5.9% per month).
This report provides an in-depth analysis of the metal household furniture market in the U.S.. Within it, you will discover the latest data on market trends and opportunities by country, consumption, production and price developments, as well as the global trade (imports and exports). The forecast exhibits the market prospects through 2030.
Product coverage:
- NAICS 337124 - Metal household furniture manufacturing
Companies mentioned:
- Summer Infant
- RSI Home Products
- Purcell Systems
- Kln Steel Products Company
- Rio Brands
- Cole Kepro International
- Tropitone Furniture Co.
- Southern Aluminum Manufacturing
- Nambe
- Telescope Casual Furniture
- Webcoat
- Graco Children's Products
- Wabash Valley Manufacturing
- Hollywood Bed & Spring Mfg. Co.
- Poly-Wood
- Mantua Manufacturing Co.
- Robern
- Wesley Allen
- Brown Jordan Company
- Henry Crown and Company
- Pavilion Furniture
- Woodard--Cm
- Murray's Iron Works
- Swaim
- Warren Homes
- Chicago American Manufacturing
- US Test Company 221
- Metal Box InternationalKln Manufacturing
Country coverage:
- United States
Data coverage:
- Market volume and value
- Per Capita consumption
- Forecast of the market dynamics in the medium term
- Trade (exports and imports) in the U.S.
- Export and import prices
- Market trends, drivers and restraints
- Key market players and their profiles
Reasons to buy this report:
- Take advantage of the latest data
- Find deeper insights into current market developments
- Discover vital success factors affecting the market
This report is designed for manufacturers, distributors, importers, and wholesalers, as well as for investors, consultants and advisors.
In this report, you can find information that helps you to make informed decisions on the following issues:
- How to diversify your business and benefit from new market opportunities
- How to load your idle production capacity
- How to boost your sales on overseas markets
- How to increase your profit margins
- How to make your supply chain more sustainable
- How to reduce your production and supply chain costs
- How to outsource production to other countries
- How to prepare your business for global expansion
While doing this research, we combine the accumulated expertise of our analysts and the capabilities of artificial intelligence. The AI-based platform, developed by our data scientists, constitutes the key working tool for business analysts, empowering them to discover deep insights and ideas from the marketing data.
-
1. INTRODUCTION
Making Data-Driven Decisions to Grow Your Business
- REPORT DESCRIPTION
- RESEARCH METHODOLOGY AND AI PLATFORM
- DATA-DRIVEN DECISIONS FOR YOUR BUSINESS
- GLOSSARY AND SPECIFIC TERMS
-
2. EXECUTIVE SUMMARY
A Quick Overview of Market Performance
- KEY FINDINGS
- MARKET TRENDS This Chapter is Available Only for the Professional Edition PRO
-
3. MARKET OVERVIEW
Understanding the Current State of The Market and Its Prospects
- MARKET SIZE
- MARKET STRUCTURE
- TRADE BALANCE
- PER CAPITA CONSUMPTION
- MARKET FORECAST TO 2030
-
4. MOST PROMISING PRODUCT
Finding New Products to Diversify Your Business
This Chapter is Available Only for the Professional Edition PRO- TOP PRODUCTS TO DIVERSIFY YOUR BUSINESS
- BEST-SELLING PRODUCTS
- MOST CONSUMED PRODUCT
- MOST TRADED PRODUCT
- MOST PROFITABLE PRODUCT FOR EXPORT
-
5. MOST PROMISING SUPPLYING COUNTRIES
Choosing the Best Countries to Establish Your Sustainable Supply Chain
This Chapter is Available Only for the Professional Edition PRO- TOP COUNTRIES TO SOURCE YOUR PRODUCT
- TOP PRODUCING COUNTRIES
- TOP EXPORTING COUNTRIES
- LOW-COST EXPORTING COUNTRIES
-
6. MOST PROMISING OVERSEAS MARKETS
Choosing the Best Countries to Boost Your Exports
This Chapter is Available Only for the Professional Edition PRO- TOP OVERSEAS MARKETS FOR EXPORTING YOUR PRODUCT
- TOP CONSUMING MARKETS
- UNSATURATED MARKETS
- TOP IMPORTING MARKETS
- MOST PROFITABLE MARKETS
7. PRODUCTION
The Latest Trends and Insights into The Industry
- PRODUCTION VOLUME AND VALUE
8. IMPORTS
The Largest Import Supplying Countries
- IMPORTS FROM 2012–2023
- IMPORTS BY COUNTRY
- IMPORT PRICES BY COUNTRY
9. EXPORTS
The Largest Destinations for Exports
- EXPORTS FROM 2012–2023
- EXPORTS BY COUNTRY
- EXPORT PRICES BY COUNTRY
-
10. PROFILES OF MAJOR PRODUCERS
The Largest Producers on The Market and Their Profiles
This Chapter is Available Only for the Professional Edition PRO -
LIST OF TABLES
- Key Findings In 2023
- Market Volume, In Physical Terms, 2012–2023
- Market Value, 2012–2023
- Per Capita Consumption In 2012-2023
- Imports, In Physical Terms, By Country, 2012–2023
- Imports, In Value Terms, By Country, 2012–2023
- Import Prices, By Country Of Origin, 2012–2023
- Exports, In Physical Terms, By Country, 2012–2023
- Exports, In Value Terms, By Country, 2012–2023
- Export Prices, By Country Of Destination, 2012–2023
-
LIST OF FIGURES
- Market Volume, In Physical Terms, 2012–2023
- Market Value, 2012–2023
- Market Structure – Domestic Supply vs. Imports, In Physical Terms, 2012-2023
- Market Structure – Domestic Supply vs. Imports, In Value Terms, 2012-2023
- Trade Balance, In Physical Terms, 2012-2023
- Trade Balance, In Value Terms, 2012-2023
- Per Capita Consumption, 2012-2023
- Market Volume Forecast to 2030
- Market Value Forecast to 2030
- Products: Market Size And Growth, By Type
- Products: Average Per Capita Consumption, By Type
- Products: Exports And Growth, By Type
- Products: Export Prices And Growth, By Type
- Production Volume And Growth
- Exports And Growth
- Export Prices And Growth
- Market Size And Growth
- Per Capita Consumption
- Imports And Growth
- Import Prices
- Production, In Physical Terms, 2012–2023
- Production, In Value Terms, 2012–2023
- Imports, In Physical Terms, 2012–2023
- Imports, In Value Terms, 2012–2023
- Imports, In Physical Terms, By Country, 2023
- Imports, In Physical Terms, By Country, 2012–2023
- Imports, In Value Terms, By Country, 2012–2023
- Import Prices, By Country Of Origin, 2012–2023
- Exports, In Physical Terms, 2012–2023
- Exports, In Value Terms, 2012–2023
- Exports, In Physical Terms, By Country, 2023
- Exports, In Physical Terms, By Country, 2012–2023
- Exports, In Value Terms, By Country, 2012–2023
- Export Prices, By Country Of Destination, 2012–2023


