U.S. - Brewing Or Distilling Dregs And Waste - Market Analysis, Forecast, Size, Trends And Insights
Get instant access to more than 2 million reports, dashboards, and datasets on the IndexBox Platform.
View PricingAfter Three Consecutive Months of Contraction, U.S. Brewing Dregs Experience 7% Price Reduction, Averaging $300 per Ton
U.S. Brewing Dregs Export Price in July 2023
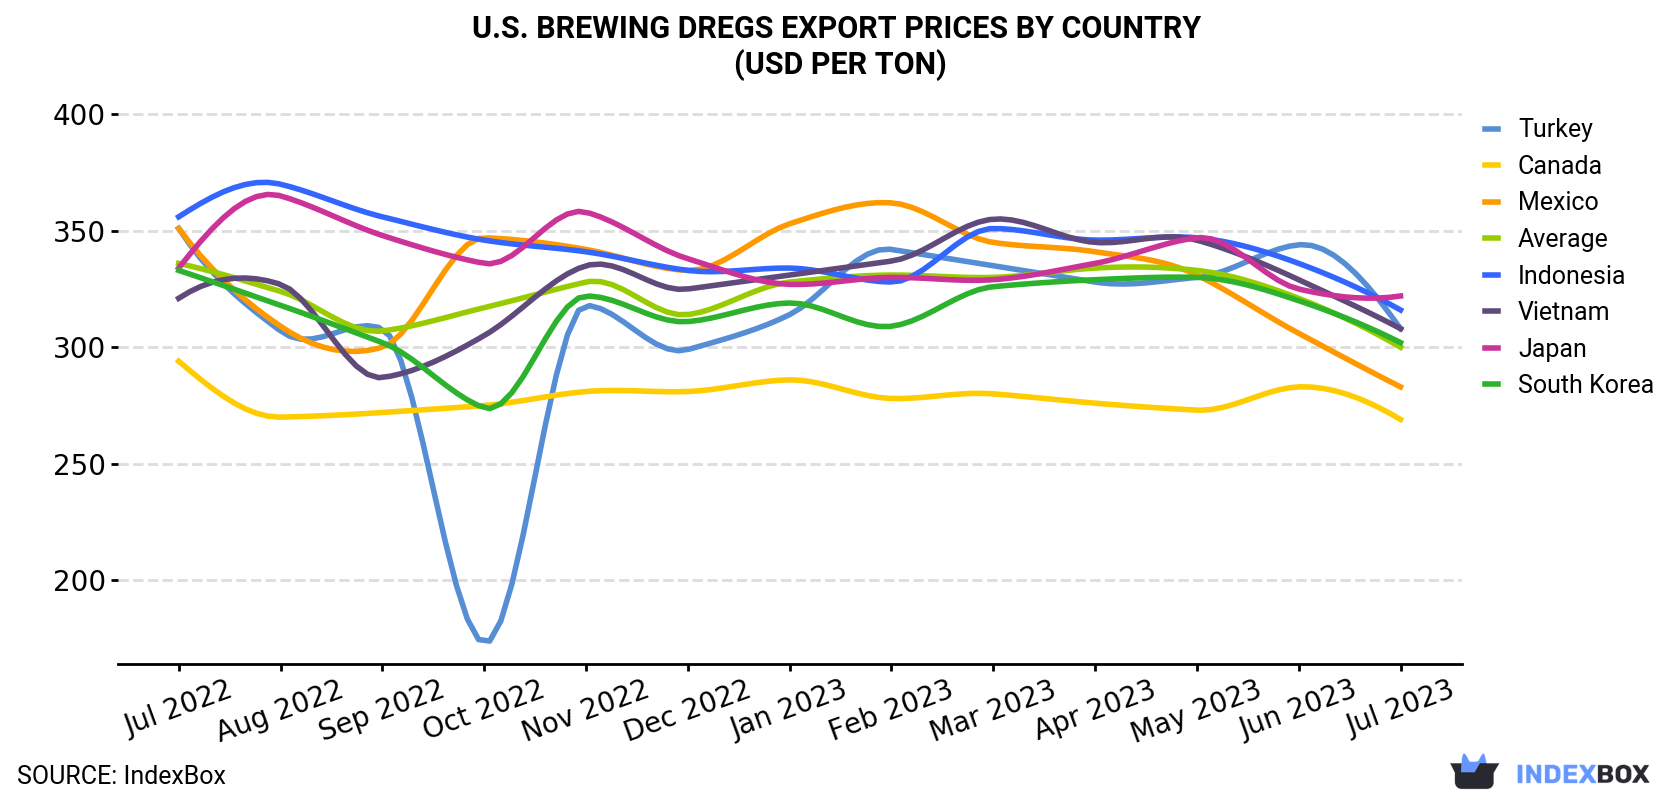
In July 2023, the brewing dregs price amounted to $300 per ton (FOB, US), with a decrease of -6.5% against the previous month. Overall, the export price recorded a relatively flat trend pattern. The most prominent rate of growth was recorded in January 2023 an increase of 4.6% m-o-m. Over the period under review, the average export prices hit record highs at $336 per ton in July 2022; however, from August 2022 to July 2023, the export prices failed to regain momentum.
Average prices varied noticeably for the major foreign markets. In July 2023, the highest price was recorded for prices to Japan ($322 per ton) and Indonesia ($316 per ton), while the average price for exports to Canada ($269 per ton) and Mexico ($283 per ton) were amongst the lowest.
From July 2022 to July 2023, the most notable rate of growth in terms of prices was recorded for supplies to Japan (-0.3%), while the prices for the other major destinations experienced a decline.
| COUNTRY | Export Price of Brewing Dregs in U.S. (USD per ton) | ||||||||||||
|---|---|---|---|---|---|---|---|---|---|---|---|---|---|
| Jul 2022 | Aug 2022 | Sep 2022 | Oct 2022 | Nov 2022 | Dec 2022 | Jan 2023 | Feb 2023 | Mar 2023 | Apr 2023 | May 2023 | Jun 2023 | Jul 2023 | |
| Japan | 334 | 365 | 348 | 336 | 358 | 338 | 327 | 330 | 329 | 336 | 347 | 325 | 322 |
| Indonesia | 356 | 370 | 356 | 346 | 341 | 333 | 334 | 328 | 351 | 346 | 347 | 336 | 316 |
| Turkey | 351 | 307 | 308 | 173 | 318 | 299 | 314 | 342 | 335 | 328 | 330 | 344 | 308 |
| Vietnam | 321 | 327 | 287 | 305 | 335 | 325 | 331 | 337 | 355 | 345 | 346 | 329 | 308 |
| South Korea | 333 | 318 | 302 | 274 | 322 | 311 | 319 | 309 | 326 | 329 | 330 | 320 | 302 |
| Mexico | 351 | 309 | 300 | 347 | 342 | 333 | 353 | 362 | 345 | 341 | 331 | 306 | 283 |
| Canada | 294 | 270 | 272 | 275 | 281 | 281 | 286 | 278 | 280 | 276 | 273 | 283 | 269 |
| Average | 336 | 324 | 307 | 317 | 328 | 314 | 328 | 331 | 330 | 334 | 333 | 321 | 300 |
U.S. Brewing Dregs Exports
In July 2023, the amount of brewing or distilling dregs and waste exported from the United States was estimated at 993K tons, rising by 4.6% on the previous month's figure. Overall, exports, however, saw a relatively flat trend pattern. The pace of growth appeared the most rapid in May 2023 with an increase of 23% month-to-month.
In value terms, brewing dregs exports declined slightly to $298M (IndexBox estimates) in July 2023. In general, exports, however, continue to indicate a mild setback. The pace of growth was the most pronounced in May 2023 with an increase of 23% m-o-m.
U.S. Brewing Dregs Exports by Country
Mexico (185K tons), Vietnam (124K tons) and Indonesia (121K tons) were the main destinations of brewing dregs exports from the United States, together accounting for 43% of total exports. These countries were followed by Turkey, South Korea, Canada, Japan, Spain, Morocco, Taiwan (Chinese), Thailand, the Philippines and the UK, which together accounted for a further 43%.
From July 2022 to July 2023, the biggest increases were in Spain (with a CAGR of +12.6%), while shipments for the other leaders experienced more modest paces of growth.
In value terms, Mexico ($52M), Vietnam ($38M) and Indonesia ($38M) were the largest markets for brewing dregs exported from the United States worldwide, together comprising 43% of total exports. These countries were followed by Turkey, South Korea, Japan, Canada, Spain, Morocco, Thailand, Taiwan (Chinese), the Philippines and the UK, which together accounted for a further 44%.
Spain, with a CAGR of +11.3%, recorded the highest rates of growth with regard to the value of exports, among the main countries of destination over the period under review, while shipments for the other leaders experienced more modest paces of growth.
This report provides an in-depth analysis of the brewing dregs market in the U.S.. Within it, you will discover the latest data on market trends and opportunities by country, consumption, production and price developments, as well as the global trade (imports and exports). The forecast exhibits the market prospects through 2030.
Product coverage:
- Prodcom 11052000 - Brewing or distilling dregs and waste (excluding alcohol duty)
Country coverage:
- United States
Data coverage:
- Market volume and value
- Per Capita consumption
- Forecast of the market dynamics in the medium term
- Trade (exports and imports) in the U.S.
- Export and import prices
- Market trends, drivers and restraints
- Key market players and their profiles
Reasons to buy this report:
- Take advantage of the latest data
- Find deeper insights into current market developments
- Discover vital success factors affecting the market
This report is designed for manufacturers, distributors, importers, and wholesalers, as well as for investors, consultants and advisors.
In this report, you can find information that helps you to make informed decisions on the following issues:
- How to diversify your business and benefit from new market opportunities
- How to load your idle production capacity
- How to boost your sales on overseas markets
- How to increase your profit margins
- How to make your supply chain more sustainable
- How to reduce your production and supply chain costs
- How to outsource production to other countries
- How to prepare your business for global expansion
While doing this research, we combine the accumulated expertise of our analysts and the capabilities of artificial intelligence. The AI-based platform, developed by our data scientists, constitutes the key working tool for business analysts, empowering them to discover deep insights and ideas from the marketing data.
-
1. INTRODUCTION
Making Data-Driven Decisions to Grow Your Business
- REPORT DESCRIPTION
- RESEARCH METHODOLOGY AND AI PLATFORM
- DATA-DRIVEN DECISIONS FOR YOUR BUSINESS
- GLOSSARY AND SPECIFIC TERMS
-
2. EXECUTIVE SUMMARY
A Quick Overview of Market Performance
- KEY FINDINGS
- MARKET TRENDS This Chapter is Available Only for the Professional Edition PRO
-
3. MARKET OVERVIEW
Understanding the Current State of The Market and Its Prospects
- MARKET SIZE
- MARKET STRUCTURE
- TRADE BALANCE
- PER CAPITA CONSUMPTION
- MARKET FORECAST TO 2030
-
4. MOST PROMISING PRODUCT
Finding New Products to Diversify Your Business
This Chapter is Available Only for the Professional Edition PRO- TOP PRODUCTS TO DIVERSIFY YOUR BUSINESS
- BEST-SELLING PRODUCTS
- MOST CONSUMED PRODUCT
- MOST TRADED PRODUCT
- MOST PROFITABLE PRODUCT FOR EXPORT
-
5. MOST PROMISING SUPPLYING COUNTRIES
Choosing the Best Countries to Establish Your Sustainable Supply Chain
This Chapter is Available Only for the Professional Edition PRO- TOP COUNTRIES TO SOURCE YOUR PRODUCT
- TOP PRODUCING COUNTRIES
- TOP EXPORTING COUNTRIES
- LOW-COST EXPORTING COUNTRIES
-
6. MOST PROMISING OVERSEAS MARKETS
Choosing the Best Countries to Boost Your Exports
This Chapter is Available Only for the Professional Edition PRO- TOP OVERSEAS MARKETS FOR EXPORTING YOUR PRODUCT
- TOP CONSUMING MARKETS
- UNSATURATED MARKETS
- TOP IMPORTING MARKETS
- MOST PROFITABLE MARKETS
7. PRODUCTION
The Latest Trends and Insights into The Industry
- PRODUCTION VOLUME AND VALUE
8. IMPORTS
The Largest Import Supplying Countries
- IMPORTS FROM 2012–2023
- IMPORTS BY COUNTRY
- IMPORT PRICES BY COUNTRY
9. EXPORTS
The Largest Destinations for Exports
- EXPORTS FROM 2012–2023
- EXPORTS BY COUNTRY
- EXPORT PRICES BY COUNTRY
-
10. PROFILES OF MAJOR PRODUCERS
The Largest Producers on The Market and Their Profiles
This Chapter is Available Only for the Professional Edition PRO -
LIST OF TABLES
- Key Findings In 2023
- Market Volume, In Physical Terms, 2012–2023
- Market Value, 2012–2023
- Per Capita Consumption In 2012-2023
- Imports, In Physical Terms, By Country, 2012–2023
- Imports, In Value Terms, By Country, 2012–2023
- Import Prices, By Country Of Origin, 2012–2023
- Exports, In Physical Terms, By Country, 2012–2023
- Exports, In Value Terms, By Country, 2012–2023
- Export Prices, By Country Of Destination, 2012–2023
-
LIST OF FIGURES
- Market Volume, In Physical Terms, 2012–2023
- Market Value, 2012–2023
- Market Structure – Domestic Supply vs. Imports, In Physical Terms, 2012-2023
- Market Structure – Domestic Supply vs. Imports, In Value Terms, 2012-2023
- Trade Balance, In Physical Terms, 2012-2023
- Trade Balance, In Value Terms, 2012-2023
- Per Capita Consumption, 2012-2023
- Market Volume Forecast to 2030
- Market Value Forecast to 2030
- Products: Market Size And Growth, By Type
- Products: Average Per Capita Consumption, By Type
- Products: Exports And Growth, By Type
- Products: Export Prices And Growth, By Type
- Production Volume And Growth
- Exports And Growth
- Export Prices And Growth
- Market Size And Growth
- Per Capita Consumption
- Imports And Growth
- Import Prices
- Production, In Physical Terms, 2012–2023
- Production, In Value Terms, 2012–2023
- Imports, In Physical Terms, 2012–2023
- Imports, In Value Terms, 2012–2023
- Imports, In Physical Terms, By Country, 2023
- Imports, In Physical Terms, By Country, 2012–2023
- Imports, In Value Terms, By Country, 2012–2023
- Import Prices, By Country Of Origin, 2012–2023
- Exports, In Physical Terms, 2012–2023
- Exports, In Value Terms, 2012–2023
- Exports, In Physical Terms, By Country, 2023
- Exports, In Physical Terms, By Country, 2012–2023
- Exports, In Value Terms, By Country, 2012–2023
- Export Prices, By Country Of Destination, 2012–2023


