U.S. Audio And Video Equipment Market. Analysis And Forecast to 2030
Get instant access to more than 2 million reports, dashboards, and datasets on the IndexBox Platform.
View PricingImports of Audio and Video Equipment Surge by 11% to $4.4B in October 2023
U.S. Audio And Video Equipment Imports
In October 2023, approximately 186M units of audio and video equipment were imported into the United States; rising by 37% compared with the month before. In general, total imports indicated tangible growth from October 2022 to October 2023: its volume increased at an average monthly rate of +4.1% over the last twelve-month period. The trend pattern, however, indicated some noticeable fluctuations being recorded throughout the analyzed period. Based on October 2023 figures, imports increased by +34.7% against July 2023 indices. As a result, imports attained the peak and are likely to continue growth in the immediate term.
In value terms, audio and video equipment imports rose remarkably to $4.4B (IndexBox estimates) in October 2023. Over the period under review, imports, however, showed a relatively flat trend pattern. The most prominent rate of growth was recorded in September 2023 when imports increased by 16% m-o-m. Imports peaked at 4.4B units in October 2022; however, from November 2022 to October 2023, imports remained at a lower figure.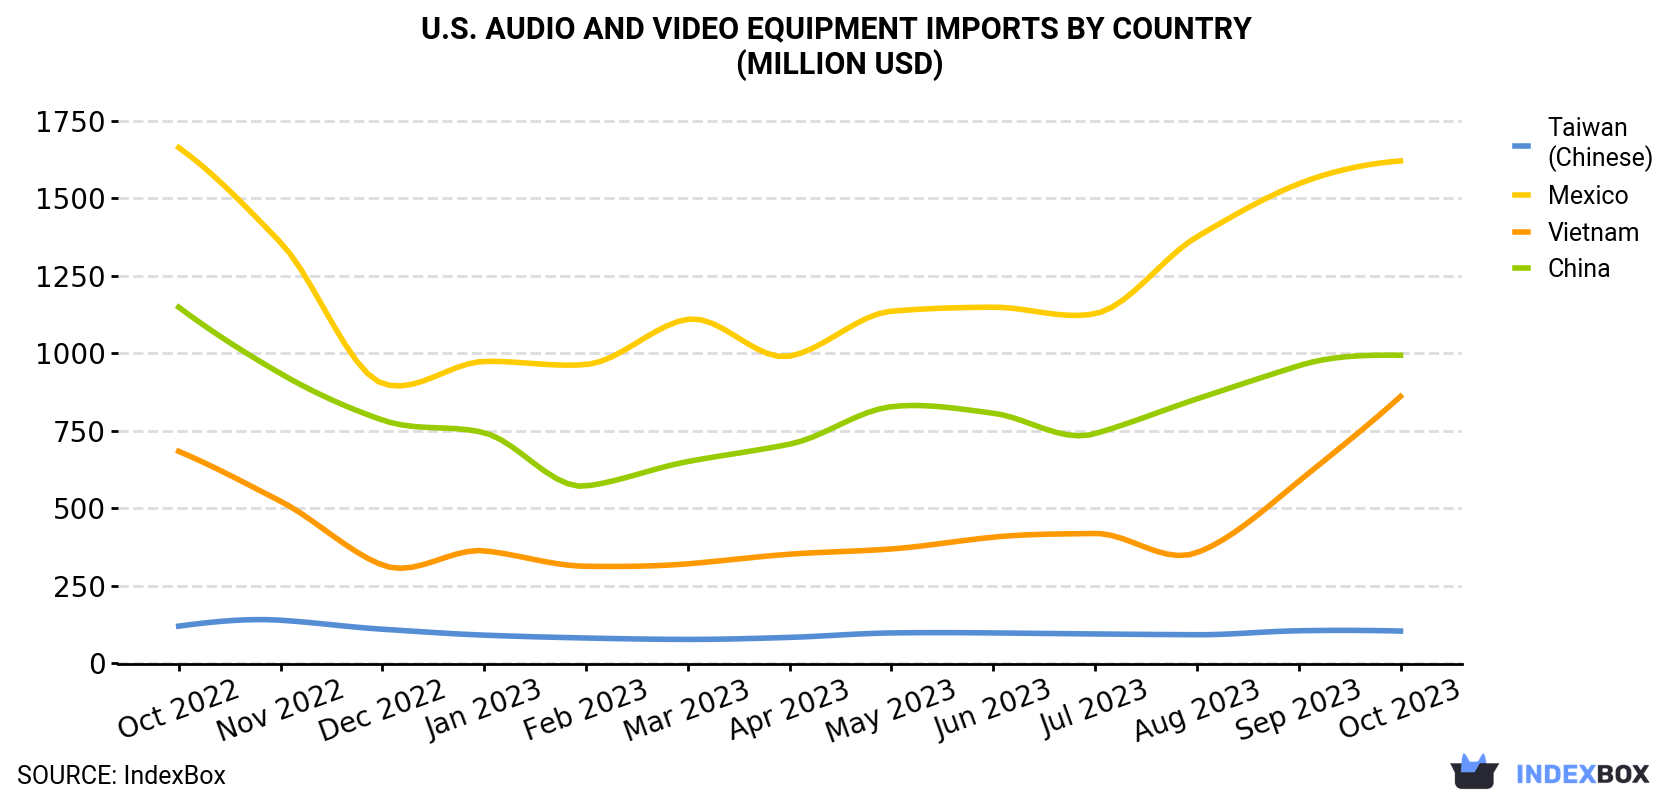
| COUNTRY | Import Value of Audio And Video Equipment in U.S. (million USD) | ||||||||||||
|---|---|---|---|---|---|---|---|---|---|---|---|---|---|
| Oct 2022 | Nov 2022 | Dec 2022 | Jan 2023 | Feb 2023 | Mar 2023 | Apr 2023 | May 2023 | Jun 2023 | Jul 2023 | Aug 2023 | Sep 2023 | Oct 2023 | |
| Mexico | 1,664 | 1,358 | 903 | 974 | 964 | 1,110 | 991 | 1,136 | 1,149 | 1,128 | 1,376 | 1,547 | 1,621 |
| China | 1,149 | 935 | 785 | 744 | 572 | 651 | 707 | 828 | 807 | 741 | 853 | 960 | 994 |
| Vietnam | 684 | 523 | 317 | 363 | 313 | 321 | 352 | 369 | 407 | 419 | 357 | 587 | 861 |
| Taiwan (Chinese) | 120 | 139 | 110 | 90.9 | 81.6 | 77.1 | 83.6 | 98.0 | 98.0 | 94.7 | 92.2 | 105 | 104 |
| Others | 781 | 680 | 601 | 641 | 554 | 706 | 663 | 698 | 681 | 697 | 680 | 712 | 777 |
| Total | 4,397 | 3,634 | 2,717 | 2,813 | 2,484 | 2,864 | 2,797 | 3,129 | 3,142 | 3,079 | 3,359 | 3,911 | 4,357 |
Imports by Country
In October 2023, China (117M units) constituted the largest supplier of audio and video equipment to the United States, accounting for a 63% share of total imports. Moreover, audio and video equipment imports from China exceeded the figures recorded by the second-largest supplier, Vietnam (33M units), threefold. The third position in this ranking was taken by Mexico (17M units), with a 9.1% share.
From October 2022 to October 2023, the average monthly growth rate of volume from China amounted to +4.9%. The remaining supplying countries recorded the following average monthly rates of imports growth: Vietnam (+6.9% per month) and Mexico (+1.4% per month).
In value terms, the largest audio and video equipment suppliers to the United States were Mexico ($1.6B), China ($994M) and Vietnam ($861M), together accounting for 80% of total imports.
In terms of the main suppliers, Vietnam, with a CAGR of +1.9%, saw the highest rates of growth with regard to the value of imports, over the period under review, while purchases for the other leaders experienced a decline.
Import Prices by Country
In October 2023, the audio and video equipment price amounted to $23.5 per unit (CIF, US), dropping by -18.5% against the previous month. Overall, the import price saw a pronounced curtailment. The most prominent rate of growth was recorded in April 2023 an increase of 61% month-to-month. Over the period under review, average import prices reached the maximum at $38.2 per unit in October 2022; however, from November 2022 to October 2023, import prices remained at a lower figure.
There were significant differences in the average prices amongst the major supplying countries. In October 2023, the country with the highest price was Mexico ($95.7 per unit), while the price for China ($8.5 per unit) was amongst the lowest.
From October 2022 to October 2023, the most notable rate of growth in terms of prices was attained by Taiwan (Chinese) (+3.0%), while the prices for the other major suppliers experienced a decline.
This report provides an in-depth analysis of the market for audio and video equipment in the U.S.. Within it, you will discover the latest data on market trends and opportunities by country, consumption, production and price developments, as well as the global trade (imports and exports). The forecast exhibits the market prospects through 2030.
Product coverage:
- NAICS 334310 - Audio and video equipment manufacturing
Companies mentioned:
- Bose Corporation
- Harman International Industries Incorporated
- Toshiba America
- Qsc Audio Products
- Technicolor Usa
- Sony Electronics
- Shure Incorporated
- Fender Musical Instruments Corporation
- Toshiba America Electronic Components
- Universal Electronics
- Harman Professional
- Loud Technologies
- Vizio
- Beats Electronics
- Lg Electronics Alabama
- Rockford Corporation
- Inrix
- Mitek Corporation
- D & M Holdings US
- Lotus International Company
- Emerson Radio Corp.
- Metra Electronics Corporation
- Warner Bros. Home Entertainment
- Zenith Electronics Corporation
- Panasonic Industrial Devices Corporation of America
- Inzi Display America
- Vtb Holdings
- Sun Mackie
- Shyk International Corp.
- Al Shellco
- Knowles Corporation
Country coverage:
- United States
Data coverage:
- Market volume and value
- Per Capita consumption
- Forecast of the market dynamics in the medium term
- Trade (exports and imports) in the U.S.
- Export and import prices
- Market trends, drivers and restraints
- Key market players and their profiles
Reasons to buy this report:
- Take advantage of the latest data
- Find deeper insights into current market developments
- Discover vital success factors affecting the market
This report is designed for manufacturers, distributors, importers, and wholesalers, as well as for investors, consultants and advisors.
In this report, you can find information that helps you to make informed decisions on the following issues:
- How to diversify your business and benefit from new market opportunities
- How to load your idle production capacity
- How to boost your sales on overseas markets
- How to increase your profit margins
- How to make your supply chain more sustainable
- How to reduce your production and supply chain costs
- How to outsource production to other countries
- How to prepare your business for global expansion
While doing this research, we combine the accumulated expertise of our analysts and the capabilities of artificial intelligence. The AI-based platform, developed by our data scientists, constitutes the key working tool for business analysts, empowering them to discover deep insights and ideas from the marketing data.
-
1. INTRODUCTION
Making Data-Driven Decisions to Grow Your Business
- REPORT DESCRIPTION
- RESEARCH METHODOLOGY AND AI PLATFORM
- DATA-DRIVEN DECISIONS FOR YOUR BUSINESS
- GLOSSARY AND SPECIFIC TERMS
-
2. EXECUTIVE SUMMARY
A Quick Overview of Market Performance
- KEY FINDINGS
- MARKET TRENDS This Chapter is Available Only for the Professional Edition PRO
-
3. MARKET OVERVIEW
Understanding the Current State of The Market and Its Prospects
- MARKET SIZE
- MARKET STRUCTURE
- TRADE BALANCE
- PER CAPITA CONSUMPTION
- MARKET FORECAST TO 2030
-
4. MOST PROMISING PRODUCT
Finding New Products to Diversify Your Business
This Chapter is Available Only for the Professional Edition PRO- TOP PRODUCTS TO DIVERSIFY YOUR BUSINESS
- BEST-SELLING PRODUCTS
- MOST CONSUMED PRODUCT
- MOST TRADED PRODUCT
- MOST PROFITABLE PRODUCT FOR EXPORT
-
5. MOST PROMISING SUPPLYING COUNTRIES
Choosing the Best Countries to Establish Your Sustainable Supply Chain
This Chapter is Available Only for the Professional Edition PRO- TOP COUNTRIES TO SOURCE YOUR PRODUCT
- TOP PRODUCING COUNTRIES
- TOP EXPORTING COUNTRIES
- LOW-COST EXPORTING COUNTRIES
-
6. MOST PROMISING OVERSEAS MARKETS
Choosing the Best Countries to Boost Your Exports
This Chapter is Available Only for the Professional Edition PRO- TOP OVERSEAS MARKETS FOR EXPORTING YOUR PRODUCT
- TOP CONSUMING MARKETS
- UNSATURATED MARKETS
- TOP IMPORTING MARKETS
- MOST PROFITABLE MARKETS
7. PRODUCTION
The Latest Trends and Insights into The Industry
- PRODUCTION VOLUME AND VALUE
8. IMPORTS
The Largest Import Supplying Countries
- IMPORTS FROM 2012–2023
- IMPORTS BY COUNTRY
- IMPORT PRICES BY COUNTRY
9. EXPORTS
The Largest Destinations for Exports
- EXPORTS FROM 2012–2023
- EXPORTS BY COUNTRY
- EXPORT PRICES BY COUNTRY
-
10. PROFILES OF MAJOR PRODUCERS
The Largest Producers on The Market and Their Profiles
This Chapter is Available Only for the Professional Edition PRO -
LIST OF TABLES
- Key Findings In 2023
- Market Volume, In Physical Terms, 2012–2023
- Market Value, 2012–2023
- Per Capita Consumption In 2012-2023
- Imports, In Physical Terms, By Country, 2012–2023
- Imports, In Value Terms, By Country, 2012–2023
- Import Prices, By Country Of Origin, 2012–2023
- Exports, In Physical Terms, By Country, 2012–2023
- Exports, In Value Terms, By Country, 2012–2023
- Export Prices, By Country Of Destination, 2012–2023
-
LIST OF FIGURES
- Market Volume, In Physical Terms, 2012–2023
- Market Value, 2012–2023
- Market Structure – Domestic Supply vs. Imports, In Physical Terms, 2012-2023
- Market Structure – Domestic Supply vs. Imports, In Value Terms, 2012-2023
- Trade Balance, In Physical Terms, 2012-2023
- Trade Balance, In Value Terms, 2012-2023
- Per Capita Consumption, 2012-2023
- Market Volume Forecast to 2030
- Market Value Forecast to 2030
- Products: Market Size And Growth, By Type
- Products: Average Per Capita Consumption, By Type
- Products: Exports And Growth, By Type
- Products: Export Prices And Growth, By Type
- Production Volume And Growth
- Exports And Growth
- Export Prices And Growth
- Market Size And Growth
- Per Capita Consumption
- Imports And Growth
- Import Prices
- Production, In Physical Terms, 2012–2023
- Production, In Value Terms, 2012–2023
- Imports, In Physical Terms, 2012–2023
- Imports, In Value Terms, 2012–2023
- Imports, In Physical Terms, By Country, 2023
- Imports, In Physical Terms, By Country, 2012–2023
- Imports, In Value Terms, By Country, 2012–2023
- Import Prices, By Country Of Origin, 2012–2023
- Exports, In Physical Terms, 2012–2023
- Exports, In Value Terms, 2012–2023
- Exports, In Physical Terms, By Country, 2023
- Exports, In Physical Terms, By Country, 2012–2023
- Exports, In Value Terms, By Country, 2012–2023
- Export Prices, By Country Of Destination, 2012–2023


