
United Kingdom - Telephone Apparatus - Market Analysis, Forecast, Size, Trends And Insights
Get instant access to more than 2 million reports, dashboards, and datasets on the IndexBox Platform.
View PricingUK Imports of Telephone Apparatus Increase by 8% to $1.7B in June 2023
United Kingdom Telephone Apparatus Imports
In June 2023, after three months of growth, there was significant decline in purchases abroad of telephone apparatus, when their volume decreased by -8.7% to 11M units. In general, imports continue to indicate a relatively flat trend pattern. The growth pace was the most rapid in November 2022 with an increase of 17% against the previous month. As a result, imports reached the peak of 12M units. From December 2022 to June 2023, the growth of imports remained at a somewhat lower figure.
In value terms, telephone apparatus imports rose notably to $1.7B (IndexBox estimates) in June 2023. Overall, imports, however, continue to indicate a relatively flat trend pattern. The most prominent rate of growth was recorded in March 2023 with an increase of 30% month-to-month. Over the period under review, imports reached the maximum at 2.2B units in November 2022; however, from December 2022 to June 2023, imports stood at a somewhat lower figure.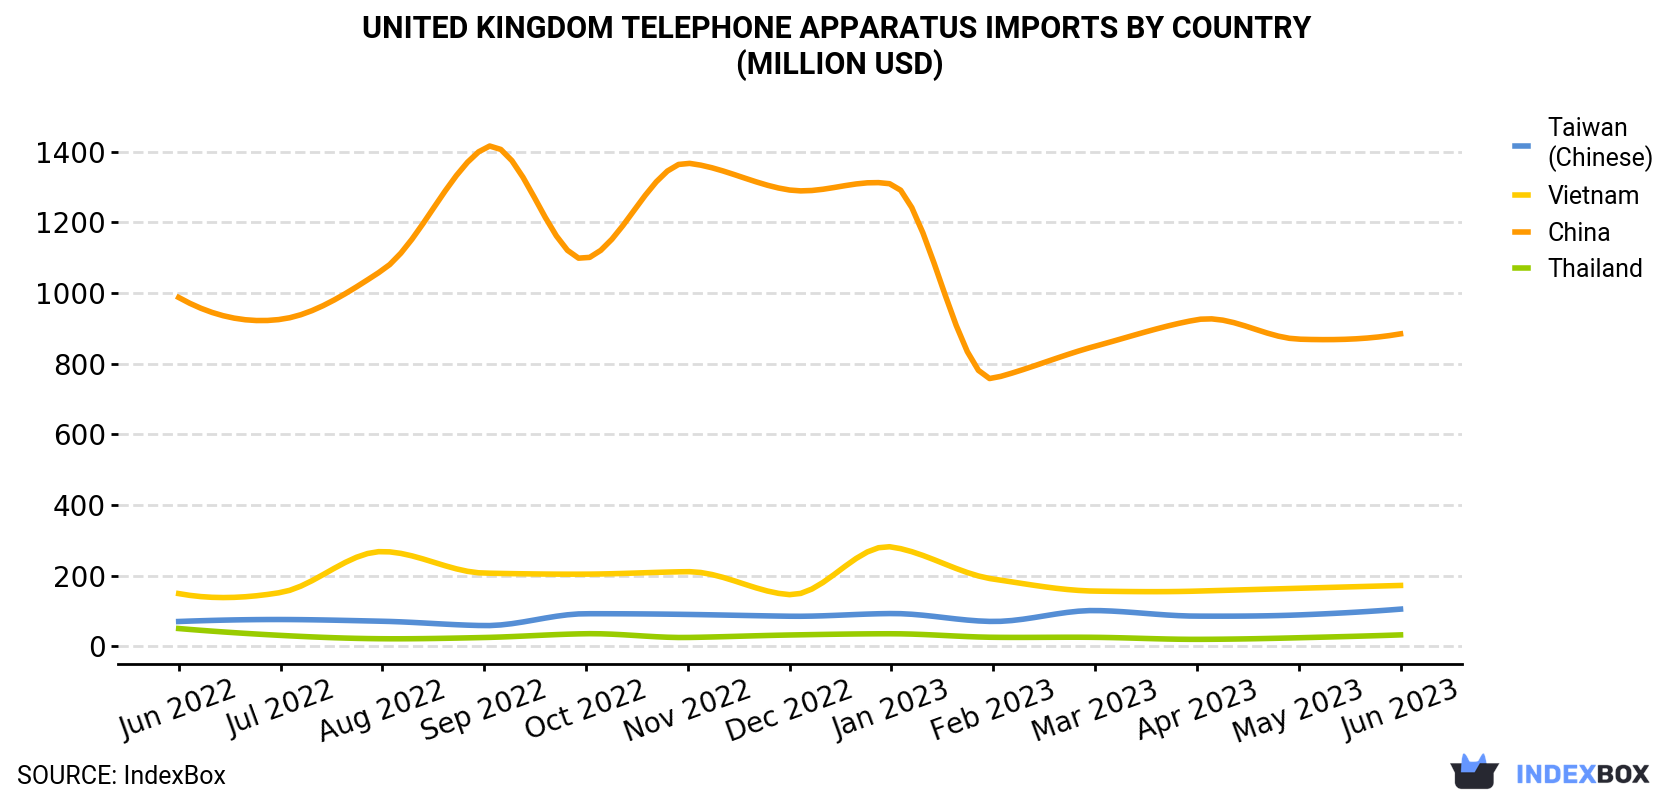
| COUNTRY | Import Value of Telephone Apparatus in United Kingdom (million USD) | ||||||||||||
|---|---|---|---|---|---|---|---|---|---|---|---|---|---|
| Jun 2022 | Jul 2022 | Aug 2022 | Sep 2022 | Oct 2022 | Nov 2022 | Dec 2022 | Jan 2023 | Feb 2023 | Mar 2023 | Apr 2023 | May 2023 | Jun 2023 | |
| China | 987 | 925 | 1,064 | 1,410 | 1,097 | 1,367 | 1,291 | 1,308 | 758 | 849 | 924 | 869 | 884 |
| Vietnam | 149 | 152 | 268 | 207 | 204 | 211 | 146 | 281 | 190 | 156 | 156 | 164 | 172 |
| Taiwan (Chinese) | 70.0 | 75.6 | 70.7 | 58.4 | 92.0 | 90.0 | 84.9 | 92.5 | 70.1 | 101 | 85.2 | 88.6 | 105 |
| Thailand | 50.1 | 30.7 | 21.2 | 24.7 | 35.4 | 24.8 | 31.8 | 35.3 | 25.3 | 25.2 | 19.5 | 24.0 | 32.1 |
| Others | 364 | 385 | 345 | 368 | 363 | 481 | 461 | 405 | 364 | 697 | 423 | 466 | 544 |
| Total | 1,620 | 1,568 | 1,769 | 2,068 | 1,792 | 2,174 | 2,015 | 2,121 | 1,407 | 1,828 | 1,608 | 1,612 | 1,738 |
Imports by Country
In June 2023, China (5.6M units) constituted the largest telephone apparatus supplier to the UK, accounting for a 53% share of total imports. Moreover, telephone apparatus imports from China exceeded the figures recorded by the second-largest supplier, Vietnam (1M units), fivefold. The third position in this ranking was held by Taiwan (Chinese) (662K units), with a 6.3% share.
From June 2022 to June 2023, the average monthly growth rate of volume from China totaled -1.1%. The remaining supplying countries recorded the following average monthly rates of imports growth: Vietnam (+1.3% per month) and Taiwan (Chinese) (+1.5% per month).
In value terms, China ($884M) constituted the largest supplier of telephone apparatus to the UK, comprising 51% of total imports. The second position in the ranking was held by Vietnam ($172M), with a 9.9% share of total imports. It was followed by Taiwan (Chinese), with a 6.1% share.
From June 2022 to June 2023, the average monthly rate of growth in terms of value from China was relatively modest. The remaining supplying countries recorded the following average monthly rates of imports growth: Vietnam (+1.2% per month) and Taiwan (Chinese) (+3.4% per month).
Imports by Type
In June 2023, telephonic or telegraphic switching apparatus (8.4M units) constituted the largest type of telephone apparatus supplied to the UK, accounting for a 80% share of total imports. Moreover, telephonic or telegraphic switching apparatus exceeded the figures recorded for the second-largest type, mobile phones (1.8M units), fivefold. The third position in this ranking was held by line telephone sets with cordless handsets (210K units), with a 2% share.
From June 2022 to June 2023, the average monthly rate of growth in terms of the volume of import of telephonic or telegraphic switching apparatus was relatively modest. With regard to the other supplied products, the following average monthly rates of growth were recorded: mobile phones (-3.4% per month) and line telephone sets with cordless handsets (+0.1% per month).
In value terms, the most traded types of telephone apparatus in the UK were telephonic or telegraphic switching apparatus ($850M), mobile phones ($816M) and communication apparatus (excluding telephone sets or base stations); machines for the transmission or reception of voice, images or other data (including wired/wireless networks), n.e.c. in item no. 8517.6 ($50M), with a combined 99% share of total imports. These products were followed by telephone sets n.e.c. in item no. 8517.1, line telephone sets with cordless handsets and base stations, which together accounted for a further 1.2%.
Import Prices by Country
In June 2023, the telephone apparatus price amounted to $165 per unit (CIF, United Kingdom), rising by 18% against the previous month. In general, the import price saw a relatively flat trend pattern. The most prominent rate of growth was recorded in December 2022 when the average import price increased by 19% m-o-m. Over the period under review, average import prices hit record highs at $209 per unit in January 2023; however, from February 2023 to June 2023, import prices remained at a lower figure.
Prices varied noticeably by the country of origin: the country with the highest price was India ($468 per unit), while the price for Tunisia ($31.8 per unit) was amongst the lowest.
From June 2022 to June 2023, the most notable rate of growth in terms of prices was attained by the Netherlands (+3.2%), while the prices for the other major suppliers experienced more modest paces of growth.
This report provides an in-depth analysis of the telephone apparatus market in the UK. Within it, you will discover the latest data on market trends and opportunities by country, consumption, production and price developments, as well as the global trade (imports and exports). The forecast exhibits the market prospects through 2030.
Product coverage:
- Prodcom 26302100 - Line telephone sets with cordless handsets
- Prodcom 26302200 - Telephones for cellular networks or for other wireless networks
- Prodcom 26302310 - Base stations
- Prodcom 26302320 - Machines for the reception, conversion and transmission or regeneration of voice, images or other data, including switching and routing apparatus
- Prodcom 26302330 - Telephone sets (excluding line telephone sets with cordless handsets and telephones for cellular networks or for other wireless networks), videophones
- Prodcom 26302340 - Portable receivers for calling or paging
- Prodcom 26302370 - Other apparatus for the transmission or reception of voice, i mages or other data, including apparatus for communication in a wired or wireless network (such as a local or wide area network), other than transmission or reception apparatus of HS
- Prodcom 26404400 - Radio-telephony or radio-telegraphy reception apparatus (excluding portable receivers for calling or paging, those combined with radio receivers)
Country coverage:
- United Kingdom
Data coverage:
- Market volume and value
- Per Capita consumption
- Forecast of the market dynamics in the medium term
- Trade (exports and imports) in the UK
- Export and import prices
- Market trends, drivers and restraints
- Key market players and their profiles
Reasons to buy this report:
- Take advantage of the latest data
- Find deeper insights into current market developments
- Discover vital success factors affecting the market
This report is designed for manufacturers, distributors, importers, and wholesalers, as well as for investors, consultants and advisors.
In this report, you can find information that helps you to make informed decisions on the following issues:
- How to diversify your business and benefit from new market opportunities
- How to load your idle production capacity
- How to boost your sales on overseas markets
- How to increase your profit margins
- How to make your supply chain more sustainable
- How to reduce your production and supply chain costs
- How to outsource production to other countries
- How to prepare your business for global expansion
While doing this research, we combine the accumulated expertise of our analysts and the capabilities of artificial intelligence. The AI-based platform, developed by our data scientists, constitutes the key working tool for business analysts, empowering them to discover deep insights and ideas from the marketing data.
-
1. INTRODUCTION
Making Data-Driven Decisions to Grow Your Business
- REPORT DESCRIPTION
- RESEARCH METHODOLOGY AND AI PLATFORM
- DATA-DRIVEN DECISIONS FOR YOUR BUSINESS
- GLOSSARY AND SPECIFIC TERMS
-
2. EXECUTIVE SUMMARY
A Quick Overview of Market Performance
- KEY FINDINGS
- MARKET TRENDS This Chapter is Available Only for the Professional Edition PRO
-
3. MARKET OVERVIEW
Understanding the Current State of The Market and Its Prospects
- MARKET SIZE
- MARKET STRUCTURE
- TRADE BALANCE
- PER CAPITA CONSUMPTION
- MARKET FORECAST TO 2030
-
4. MOST PROMISING PRODUCT
Finding New Products to Diversify Your Business
This Chapter is Available Only for the Professional Edition PRO- TOP PRODUCTS TO DIVERSIFY YOUR BUSINESS
- BEST-SELLING PRODUCTS
- MOST CONSUMED PRODUCT
- MOST TRADED PRODUCT
- MOST PROFITABLE PRODUCT FOR EXPORT
-
5. MOST PROMISING SUPPLYING COUNTRIES
Choosing the Best Countries to Establish Your Sustainable Supply Chain
This Chapter is Available Only for the Professional Edition PRO- TOP COUNTRIES TO SOURCE YOUR PRODUCT
- TOP PRODUCING COUNTRIES
- TOP EXPORTING COUNTRIES
- LOW-COST EXPORTING COUNTRIES
-
6. MOST PROMISING OVERSEAS MARKETS
Choosing the Best Countries to Boost Your Exports
This Chapter is Available Only for the Professional Edition PRO- TOP OVERSEAS MARKETS FOR EXPORTING YOUR PRODUCT
- TOP CONSUMING MARKETS
- UNSATURATED MARKETS
- TOP IMPORTING MARKETS
- MOST PROFITABLE MARKETS
7. PRODUCTION
The Latest Trends and Insights into The Industry
- PRODUCTION VOLUME AND VALUE
8. IMPORTS
The Largest Import Supplying Countries
- IMPORTS FROM 2012–2023
- IMPORTS BY COUNTRY
- IMPORT PRICES BY COUNTRY
9. EXPORTS
The Largest Destinations for Exports
- EXPORTS FROM 2012–2023
- EXPORTS BY COUNTRY
- EXPORT PRICES BY COUNTRY
-
10. PROFILES OF MAJOR PRODUCERS
The Largest Producers on The Market and Their Profiles
This Chapter is Available Only for the Professional Edition PRO -
LIST OF TABLES
- Key Findings In 2023
- Market Volume, In Physical Terms, 2012–2023
- Market Value, 2012–2023
- Per Capita Consumption In 2012-2023
- Imports, In Physical Terms, By Country, 2012–2023
- Imports, In Value Terms, By Country, 2012–2023
- Import Prices, By Country Of Origin, 2012–2023
- Exports, In Physical Terms, By Country, 2012–2023
- Exports, In Value Terms, By Country, 2012–2023
- Export Prices, By Country Of Destination, 2012–2023
-
LIST OF FIGURES
- Market Volume, In Physical Terms, 2012–2023
- Market Value, 2012–2023
- Market Structure – Domestic Supply vs. Imports, In Physical Terms, 2012-2023
- Market Structure – Domestic Supply vs. Imports, In Value Terms, 2012-2023
- Trade Balance, In Physical Terms, 2012-2023
- Trade Balance, In Value Terms, 2012-2023
- Per Capita Consumption, 2012-2023
- Market Volume Forecast to 2030
- Market Value Forecast to 2030
- Products: Market Size And Growth, By Type
- Products: Average Per Capita Consumption, By Type
- Products: Exports And Growth, By Type
- Products: Export Prices And Growth, By Type
- Production Volume And Growth
- Exports And Growth
- Export Prices And Growth
- Market Size And Growth
- Per Capita Consumption
- Imports And Growth
- Import Prices
- Production, In Physical Terms, 2012–2023
- Production, In Value Terms, 2012–2023
- Imports, In Physical Terms, 2012–2023
- Imports, In Value Terms, 2012–2023
- Imports, In Physical Terms, By Country, 2023
- Imports, In Physical Terms, By Country, 2012–2023
- Imports, In Value Terms, By Country, 2012–2023
- Import Prices, By Country Of Origin, 2012–2023
- Exports, In Physical Terms, 2012–2023
- Exports, In Value Terms, 2012–2023
- Exports, In Physical Terms, By Country, 2023
- Exports, In Physical Terms, By Country, 2012–2023
- Exports, In Value Terms, By Country, 2012–2023
- Export Prices, By Country Of Destination, 2012–2023


