
United Kingdom - Spirits, Liqueurs And Other Spirituous Beverages - Market Analysis, Forecast, Size, Trends and Insights
Get instant access to more than 2 million reports, dashboards, and datasets on the IndexBox Platform.
View PricingExport of Spirits and Liqueurs in UK Decreases Significantly to $660M in November 2023
United Kingdom Spirits And Liqueurs Exports
In November 2023, overseas shipments of spirits, liqueurs and other spirituous beverages decreased by -15.6% to 83M litres, falling for the third consecutive month after three months of growth. Overall, exports recorded a perceptible setback. The pace of growth appeared the most rapid in February 2023 with an increase of 25% m-o-m. The exports peaked at 117M litres in November 2022; however, from December 2022 to November 2023, the exports remained at a lower figure.
In value terms, spirits and liqueurs exports declined to $660M (IndexBox estimates) in November 2023. In general, exports continue to indicate a perceptible contraction. The pace of growth appeared the most rapid in July 2023 when exports increased by 26% against the previous month. The exports peaked at 878M litres in August 2023; however, from September 2023 to November 2023, the exports failed to regain momentum.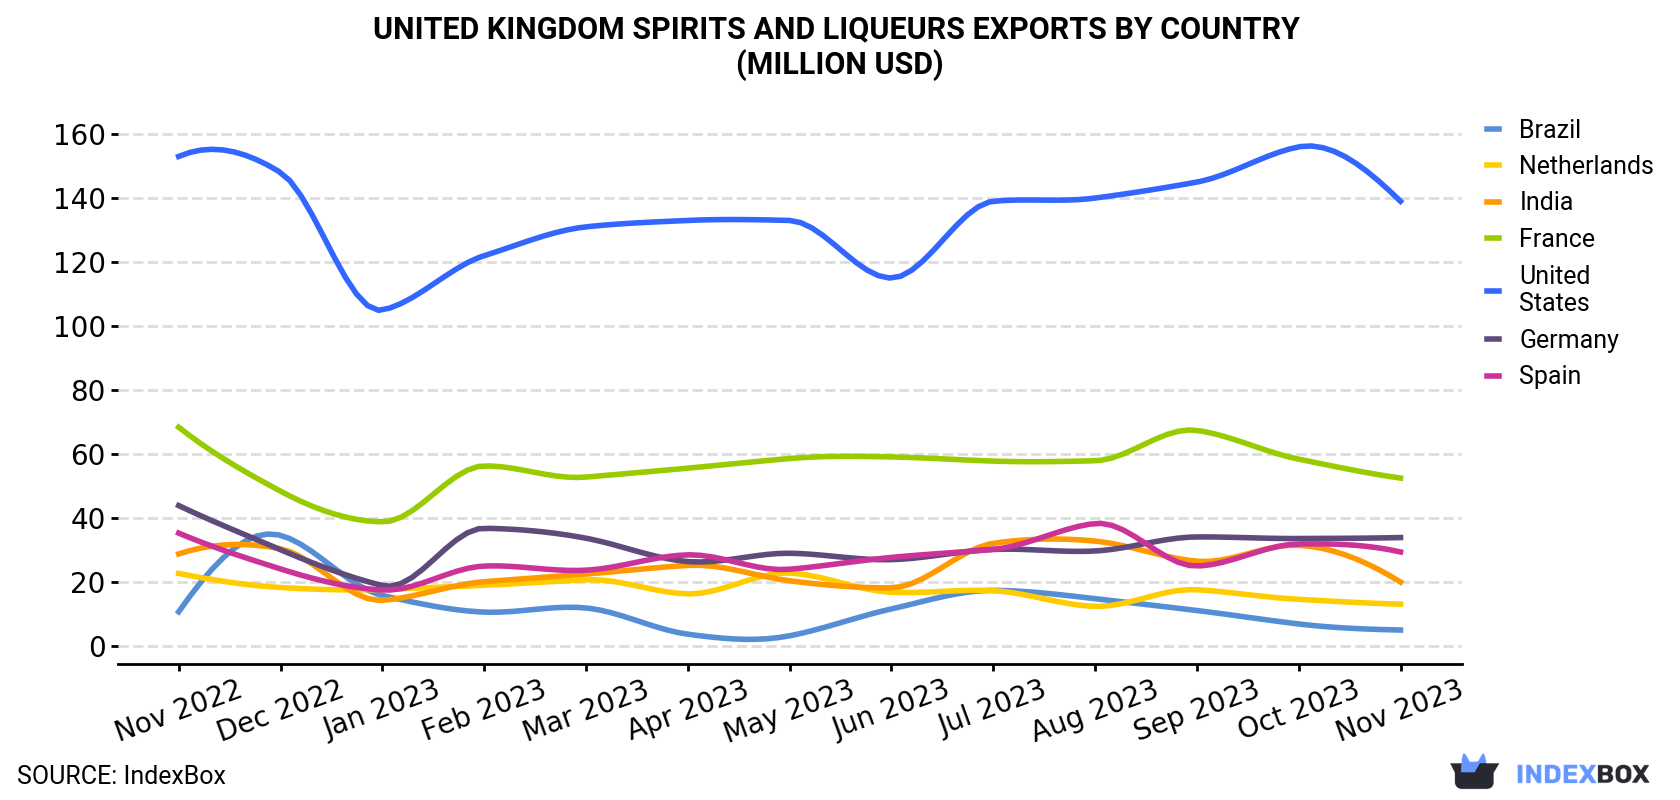
| COUNTRY | Export Value of Spirits And Liqueurs in United Kingdom (million USD) | ||||||||||||
|---|---|---|---|---|---|---|---|---|---|---|---|---|---|
| Nov 2022 | Dec 2022 | Jan 2023 | Feb 2023 | Mar 2023 | Apr 2023 | May 2023 | Jun 2023 | Jul 2023 | Aug 2023 | Sep 2023 | Oct 2023 | Nov 2023 | |
| United States | 153 | 148 | 105 | 122 | 131 | 133 | 133 | 115 | 139 | 140 | 145 | 156 | 139 |
| France | 68.4 | 48.4 | 38.8 | 56.3 | 52.8 | 55.6 | 58.6 | 59.1 | 57.8 | 57.9 | 67.4 | 58.4 | 52.5 |
| Germany | 43.9 | 30.1 | 18.9 | 36.8 | 33.7 | 26.4 | 29.0 | 27.0 | 30.2 | 29.7 | 34.1 | 33.6 | 33.9 |
| Spain | 35.3 | 24.1 | 17.5 | 25.0 | 23.7 | 28.5 | 24.0 | 27.7 | 30.2 | 38.3 | 25.0 | 31.9 | 29.4 |
| India | 28.8 | 30.4 | 14.3 | 20.1 | 22.5 | 25.2 | 20.4 | 18.2 | 32.1 | 32.8 | 26.5 | 31.5 | 20.0 |
| Netherlands | 22.7 | 18.3 | 17.7 | 19.0 | 20.7 | 16.3 | 22.8 | 16.8 | 17.3 | 12.4 | 17.6 | 14.6 | 13.1 |
| Brazil | 10.7 | 34.6 | 15.8 | 10.6 | 11.9 | 3.7 | 3.2 | 11.6 | 17.4 | 14.8 | 11.1 | 6.9 | 5.0 |
| Others | 486 | 504 | 310 | 382 | 406 | 419 | 394 | 377 | 495 | 552 | 457 | 436 | 367 |
| Total | 849 | 838 | 538 | 672 | 702 | 708 | 685 | 652 | 819 | 878 | 784 | 768 | 660 |
Exports by Country
The United States (11M litres), France (7.8M litres) and Germany (7M litres) were the main destinations of spirits and liqueurs exports from the UK, with a combined 31% share of total exports.
From November 2022 to November 2023, the biggest increases were in the United States (with a CAGR of -0.5%), while shipments for the other leaders experienced a decline.
In value terms, the United States ($139M) remains the key foreign market for spirits and liqueurs exports from the UK, comprising 21% of total exports. The second position in the ranking was held by France ($53M), with an 8% share of total exports. It was followed by Germany, with a 5.1% share.
From November 2022 to November 2023, the average monthly rate of growth in terms of value to the United States was relatively modest. Exports to the other major destinations recorded the following average monthly rates of exports growth: France (-2.2% per month) and Germany (-2.1% per month).
Export Prices by Country
In November 2023, the spirits and liqueurs price stood at $7.9 per litre (FOB, United Kingdom), picking up by 1.9% against the previous month. Over the period under review, the export price recorded a relatively flat trend pattern. The pace of growth appeared the most rapid in July 2023 when the average export price increased by 12% against the previous month. As a result, the export price reached the peak level of $8,129 per thousand litres. From August 2023 to November 2023, the the average export prices remained at a lower figure.
Prices varied noticeably by the country of destination: the country with the highest price was the United States ($12.7 per litre), while the average price for exports to Ireland ($2.7 per litre) was amongst the lowest.
From November 2022 to November 2023, the most notable rate of growth in terms of prices was recorded for supplies to Japan (+2.6%), while the prices for the other major destinations experienced more modest paces of growth.
This report provides an in-depth analysis of the spirits and liqueurs market in the UK. Within it, you will discover the latest data on market trends and opportunities by country, consumption, production and price developments, as well as the global trade (imports and exports). The forecast exhibits the market prospects through 2030.
Product coverage:
- Prodcom 11011020 - Spirits obtained from distilled grape wine or grape marc (important: excluding alcohol duty)
- Prodcom 11011030 - Whisky (important: excluding alcohol duty)
- Prodcom 11011040 - Rum and other spirits obtained by distilling fermented sugarcane products (important: excluding alcohol duty)
- Prodcom 11011050 - Gin and geneva (important: excluding alcohol duty)
- Prodcom 11011063 - Vodka of an alcoholic strength by volume of . .45,4 % (important: excluding alcohol duty)
- Prodcom 11011065 - Spirits distilled from fruit (excluding liqueurs, gin, geneva, g rape wine or grape marc (important: excluding alcohol duty))
- Prodcom 11011070 - Pure alcohols (important: excluding alcohol duty)
- Prodcom 11011080 - Spirits, liqueurs and other spirituous beverages (excluding spirits distilled from grape wine, grape marc or fruit/whisky, r um, tafia, gin and geneva, spirits distilled from fruit)
Country coverage:
- United Kingdom
Data coverage:
- Market volume and value
- Per Capita consumption
- Forecast of the market dynamics in the medium term
- Trade (exports and imports) in the UK
- Export and import prices
- Market trends, drivers and restraints
- Key market players and their profiles
Reasons to buy this report:
- Take advantage of the latest data
- Find deeper insights into current market developments
- Discover vital success factors affecting the market
This report is designed for manufacturers, distributors, importers, and wholesalers, as well as for investors, consultants and advisors.
In this report, you can find information that helps you to make informed decisions on the following issues:
- How to diversify your business and benefit from new market opportunities
- How to load your idle production capacity
- How to boost your sales on overseas markets
- How to increase your profit margins
- How to make your supply chain more sustainable
- How to reduce your production and supply chain costs
- How to outsource production to other countries
- How to prepare your business for global expansion
While doing this research, we combine the accumulated expertise of our analysts and the capabilities of artificial intelligence. The AI-based platform, developed by our data scientists, constitutes the key working tool for business analysts, empowering them to discover deep insights and ideas from the marketing data.
-
1. INTRODUCTION
Making Data-Driven Decisions to Grow Your Business
- REPORT DESCRIPTION
- RESEARCH METHODOLOGY AND AI PLATFORM
- DATA-DRIVEN DECISIONS FOR YOUR BUSINESS
- GLOSSARY AND SPECIFIC TERMS
-
2. EXECUTIVE SUMMARY
A Quick Overview of Market Performance
- KEY FINDINGS
- MARKET TRENDS This Chapter is Available Only for the Professional Edition PRO
-
3. MARKET OVERVIEW
Understanding the Current State of The Market and Its Prospects
- MARKET SIZE
- MARKET STRUCTURE
- TRADE BALANCE
- PER CAPITA CONSUMPTION
- MARKET FORECAST TO 2030
-
4. MOST PROMISING PRODUCT
Finding New Products to Diversify Your Business
This Chapter is Available Only for the Professional Edition PRO- TOP PRODUCTS TO DIVERSIFY YOUR BUSINESS
- BEST-SELLING PRODUCTS
- MOST CONSUMED PRODUCT
- MOST TRADED PRODUCT
- MOST PROFITABLE PRODUCT FOR EXPORT
-
5. MOST PROMISING SUPPLYING COUNTRIES
Choosing the Best Countries to Establish Your Sustainable Supply Chain
This Chapter is Available Only for the Professional Edition PRO- TOP COUNTRIES TO SOURCE YOUR PRODUCT
- TOP PRODUCING COUNTRIES
- TOP EXPORTING COUNTRIES
- LOW-COST EXPORTING COUNTRIES
-
6. MOST PROMISING OVERSEAS MARKETS
Choosing the Best Countries to Boost Your Exports
This Chapter is Available Only for the Professional Edition PRO- TOP OVERSEAS MARKETS FOR EXPORTING YOUR PRODUCT
- TOP CONSUMING MARKETS
- UNSATURATED MARKETS
- TOP IMPORTING MARKETS
- MOST PROFITABLE MARKETS
7. PRODUCTION
The Latest Trends and Insights into The Industry
- PRODUCTION VOLUME AND VALUE
8. IMPORTS
The Largest Import Supplying Countries
- IMPORTS FROM 2012–2023
- IMPORTS BY COUNTRY
- IMPORT PRICES BY COUNTRY
9. EXPORTS
The Largest Destinations for Exports
- EXPORTS FROM 2012–2023
- EXPORTS BY COUNTRY
- EXPORT PRICES BY COUNTRY
-
10. PROFILES OF MAJOR PRODUCERS
The Largest Producers on The Market and Their Profiles
This Chapter is Available Only for the Professional Edition PRO -
LIST OF TABLES
- Key Findings In 2023
- Market Volume, In Physical Terms, 2012–2023
- Market Value, 2012–2023
- Per Capita Consumption In 2012-2023
- Imports, In Physical Terms, By Country, 2012–2023
- Imports, In Value Terms, By Country, 2012–2023
- Import Prices, By Country Of Origin, 2012–2023
- Exports, In Physical Terms, By Country, 2012–2023
- Exports, In Value Terms, By Country, 2012–2023
- Export Prices, By Country Of Destination, 2012–2023
-
LIST OF FIGURES
- Market Volume, In Physical Terms, 2012–2023
- Market Value, 2012–2023
- Market Structure – Domestic Supply vs. Imports, In Physical Terms, 2012-2023
- Market Structure – Domestic Supply vs. Imports, In Value Terms, 2012-2023
- Trade Balance, In Physical Terms, 2012-2023
- Trade Balance, In Value Terms, 2012-2023
- Per Capita Consumption, 2012-2023
- Market Volume Forecast to 2030
- Market Value Forecast to 2030
- Products: Market Size And Growth, By Type
- Products: Average Per Capita Consumption, By Type
- Products: Exports And Growth, By Type
- Products: Export Prices And Growth, By Type
- Production Volume And Growth
- Exports And Growth
- Export Prices And Growth
- Market Size And Growth
- Per Capita Consumption
- Imports And Growth
- Import Prices
- Production, In Physical Terms, 2012–2023
- Production, In Value Terms, 2012–2023
- Imports, In Physical Terms, 2012–2023
- Imports, In Value Terms, 2012–2023
- Imports, In Physical Terms, By Country, 2023
- Imports, In Physical Terms, By Country, 2012–2023
- Imports, In Value Terms, By Country, 2012–2023
- Import Prices, By Country Of Origin, 2012–2023
- Exports, In Physical Terms, 2012–2023
- Exports, In Value Terms, 2012–2023
- Exports, In Physical Terms, By Country, 2023
- Exports, In Physical Terms, By Country, 2012–2023
- Exports, In Value Terms, By Country, 2012–2023
- Export Prices, By Country Of Destination, 2012–2023


