
United Kingdom - Motorcycles and Scooters - Market Analysis, Forecast, Size, Trends And Insights
Get instant access to more than 2 million reports, dashboards, and datasets on the IndexBox Platform.
View PricingImport of Motorcycles and Scooters in UK Sees a 6% Surge, Reaching $53M in October 2023.
United Kingdom Motorcycle and Scooter Imports
In October 2023, after five months of decline, there was significant growth in overseas purchases of motorcycles and scooters, when their volume increased by 14% to 11K units. Overall, imports, however, saw a mild slump. The pace of growth appeared the most rapid in November 2022 when imports increased by 59% against the previous month. As a result, imports reached the peak of 21K units. From December 2022 to October 2023, the growth of imports remained at a somewhat lower figure.
In value terms, motorcycle and scooter imports rose notably to $53M (IndexBox estimates) in October 2023. Over the period under review, imports, however, showed a relatively flat trend pattern. The pace of growth appeared the most rapid in February 2023 when imports increased by 60% m-o-m. Imports peaked at 83M units in May 2023; however, from June 2023 to October 2023, imports failed to regain momentum.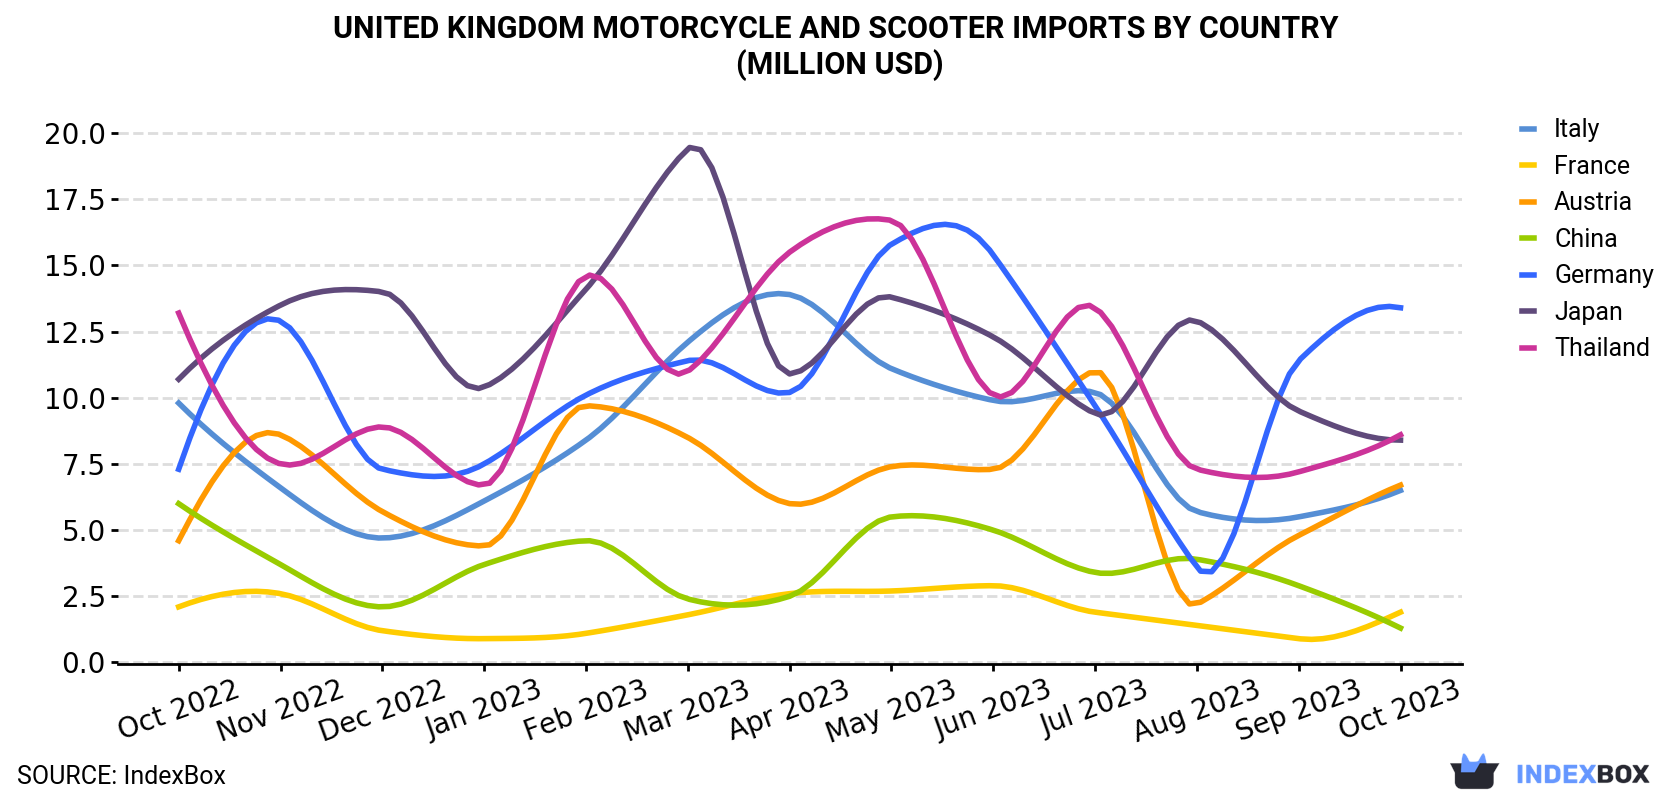
| COUNTRY | Import Value of Motorcycle and Scooter in United Kingdom (million USD) | ||||||||||||
|---|---|---|---|---|---|---|---|---|---|---|---|---|---|
| Oct 2022 | Nov 2022 | Dec 2022 | Jan 2023 | Feb 2023 | Mar 2023 | Apr 2023 | May 2023 | Jun 2023 | Jul 2023 | Aug 2023 | Sep 2023 | Oct 2023 | |
| Germany | 7.3 | 12.9 | 7.3 | 7.5 | 10.1 | 11.4 | 10.2 | 15.8 | 15.4 | 9.7 | 3.6 | 11.4 | 13.4 |
| Thailand | 13.2 | 7.5 | 8.9 | 6.7 | 14.6 | 11.0 | 15.5 | 16.7 | 10.1 | 13.4 | 7.3 | 7.2 | 8.6 |
| Japan | 10.7 | 13.5 | 14.0 | 10.4 | 14.1 | 19.4 | 10.9 | 13.8 | 12.3 | 9.4 | 12.9 | 9.5 | 8.4 |
| Austria | 4.6 | 8.6 | 5.7 | 4.4 | 9.7 | 8.5 | 6.0 | 7.4 | 7.3 | 11.0 | 2.2 | 4.8 | 6.7 |
| Italy | 9.8 | 6.6 | 4.7 | 6.1 | 8.4 | 12.1 | 13.9 | 11.1 | 9.9 | 10.2 | 5.7 | 5.5 | 6.5 |
| France | 2.1 | 2.6 | 1.2 | 0.9 | 1.1 | 1.8 | 2.6 | 2.7 | 2.9 | 1.9 | 1.4 | 0.9 | 1.9 |
| China | 6.0 | 3.7 | 2.1 | 3.7 | 4.6 | 2.4 | 2.5 | 5.5 | 5.0 | 3.4 | 3.9 | 2.9 | 1.3 |
| Others | 4.2 | 5.7 | 5.1 | 7.2 | 12.4 | 12.0 | 7.9 | 10.2 | 6.9 | 6.8 | 5.5 | 7.1 | 6.0 |
| Total | 58.1 | 61.2 | 49.1 | 47.0 | 75.1 | 78.7 | 69.5 | 83.3 | 69.9 | 65.6 | 42.6 | 49.4 | 52.6 |
Imports by Country
China (1.8K units), Thailand (1.6K units) and Japan (1.2K units) were the main suppliers of motorcycle and scooter imports to the UK, together accounting for 42% of total imports. Italy, Germany, Austria and France lagged somewhat behind, together accounting for a further 28%.
From October 2022 to October 2023, the biggest increases were in Germany (with a CAGR of +3.5%), while purchases for the other leaders experienced more modest paces of growth.
In value terms, Germany ($13M), Thailand ($8.6M) and Japan ($8.4M) appeared to be the largest motorcycle and scooter suppliers to the UK, with a combined 58% share of total imports.
Germany, with a CAGR of +5.1%, recorded the highest rates of growth with regard to the value of imports, among the main suppliers over the period under review, while purchases for the other leaders experienced mixed trend patterns.
Imports by Type
In October 2023, motorcycles (including mopeds) and cycles; fitted with an auxiliary motor, reciprocating internal combustion piston engine, of cylinder capacity exceeding 50cc but not exceeding 250cc, with or without side-cars; side-cars (6.4K units) constituted the largest type of motorcycle and scooter supplied to the UK, with a 58% share of total imports. Moreover, motorcycles (including mopeds) and cycles; fitted with an auxiliary motor, reciprocating internal combustion piston engine, of cylinder capacity exceeding 50cc but not exceeding 250cc, with or without side-cars; side-cars exceeded the figures recorded for the second-largest type, motorcycles (including mopeds) and cycles; fitted with auxiliary motor, with reciprocating internal combustion piston engine of a cylinder capacity exceeding 800cc, with or without side-cars; side-cars (2K units), threefold. The third position in this ranking was taken by motorcycles (including mopeds) and cycles; fitted with an auxiliary motor, reciprocating internal combustion piston engine, of cylinder capacity exceeding 250cc but not exceeding 500cc, with or without side-cars; side-cars (1.5K units), with a 14% share.
From October 2022 to October 2023, the average monthly growth rate of the volume of import of motorcycles (including mopeds) and cycles; fitted with an auxiliary motor, reciprocating internal combustion piston engine, of cylinder capacity exceeding 50cc but not exceeding 250cc, with or without side-cars; side-cars amounted to -1.3%. With regard to the other supplied products, the following average monthly rates of growth were recorded: motorcycles (including mopeds) and cycles; fitted with auxiliary motor, with reciprocating internal combustion piston engine of a cylinder capacity exceeding 800cc, with or without side-cars; side-cars (-2.9% per month) and motorcycles (including mopeds) and cycles; fitted with an auxiliary motor, reciprocating internal combustion piston engine, of cylinder capacity exceeding 250cc but not exceeding 500cc, with or without side-cars; side-cars (+0.9% per month).
In value terms, motorcycles (including mopeds) and cycles; fitted with auxiliary motor, with reciprocating internal combustion piston engine of a cylinder capacity exceeding 800cc, with or without side-cars; side-cars ($25M) constituted the largest type of motorcycle and scooter supplied to the UK, comprising 48% of total imports. The second position in the ranking was held by motorcycles (including mopeds) and cycles; fitted with an auxiliary motor, reciprocating internal combustion piston engine, of cylinder capacity exceeding 50cc but not exceeding 250cc, with or without side-cars; side-cars ($12M), with a 22% share of total imports. It was followed by motorcycles (including mopeds) and cycles; fitted with an auxiliary motor, reciprocating internal combustion piston engine, of cylinder capacity exceeding 250cc but not exceeding 500cc, with or without side-cars; side-cars, with a 17% share.
Import Prices by Country
In October 2023, the motorcycle and scooter price amounted to $4,741 per unit (CIF, United Kingdom), with a decrease of -6.8% against the previous month. In general, the import price, however, saw a relatively flat trend pattern. The growth pace was the most rapid in December 2022 when the average import price increased by 75% against the previous month. Over the period under review, average import prices reached the maximum at $6,097 per unit in March 2023; however, from April 2023 to October 2023, import prices remained at a lower figure.
Prices varied noticeably by the country of origin: the country with the highest price was Germany ($14,523 per unit), while the price for China ($706 per unit) was amongst the lowest.
From October 2022 to October 2023, the most notable rate of growth in terms of prices was attained by Italy (+3.6%), while the prices for the other major suppliers experienced more modest paces of growth.
This report provides an in-depth analysis of the motorcycle and scooter market in the UK. Within it, you will discover the latest data on market trends and opportunities by country, consumption, production and price developments, as well as the global trade (imports and exports). The forecast exhibits the market prospects through 2030.
Product coverage:
- Prodcom 30911200 - Motorcycles with reciprocating internal combustion piston engine > .50 cm.
Country coverage:
- United Kingdom
Data coverage:
- Market volume and value
- Per Capita consumption
- Forecast of the market dynamics in the medium term
- Trade (exports and imports) in the UK
- Export and import prices
- Market trends, drivers and restraints
- Key market players and their profiles
Reasons to buy this report:
- Take advantage of the latest data
- Find deeper insights into current market developments
- Discover vital success factors affecting the market
This report is designed for manufacturers, distributors, importers, and wholesalers, as well as for investors, consultants and advisors.
In this report, you can find information that helps you to make informed decisions on the following issues:
- How to diversify your business and benefit from new market opportunities
- How to load your idle production capacity
- How to boost your sales on overseas markets
- How to increase your profit margins
- How to make your supply chain more sustainable
- How to reduce your production and supply chain costs
- How to outsource production to other countries
- How to prepare your business for global expansion
While doing this research, we combine the accumulated expertise of our analysts and the capabilities of artificial intelligence. The AI-based platform, developed by our data scientists, constitutes the key working tool for business analysts, empowering them to discover deep insights and ideas from the marketing data.
-
1. INTRODUCTION
Making Data-Driven Decisions to Grow Your Business
- REPORT DESCRIPTION
- RESEARCH METHODOLOGY AND AI PLATFORM
- DATA-DRIVEN DECISIONS FOR YOUR BUSINESS
- GLOSSARY AND SPECIFIC TERMS
-
2. EXECUTIVE SUMMARY
A Quick Overview of Market Performance
- KEY FINDINGS
- MARKET TRENDS This Chapter is Available Only for the Professional Edition PRO
-
3. MARKET OVERVIEW
Understanding the Current State of The Market and Its Prospects
- MARKET SIZE
- MARKET STRUCTURE
- TRADE BALANCE
- PER CAPITA CONSUMPTION
- MARKET FORECAST TO 2030
-
4. MOST PROMISING PRODUCT
Finding New Products to Diversify Your Business
This Chapter is Available Only for the Professional Edition PRO- TOP PRODUCTS TO DIVERSIFY YOUR BUSINESS
- BEST-SELLING PRODUCTS
- MOST CONSUMED PRODUCT
- MOST TRADED PRODUCT
- MOST PROFITABLE PRODUCT FOR EXPORT
-
5. MOST PROMISING SUPPLYING COUNTRIES
Choosing the Best Countries to Establish Your Sustainable Supply Chain
This Chapter is Available Only for the Professional Edition PRO- TOP COUNTRIES TO SOURCE YOUR PRODUCT
- TOP PRODUCING COUNTRIES
- TOP EXPORTING COUNTRIES
- LOW-COST EXPORTING COUNTRIES
-
6. MOST PROMISING OVERSEAS MARKETS
Choosing the Best Countries to Boost Your Exports
This Chapter is Available Only for the Professional Edition PRO- TOP OVERSEAS MARKETS FOR EXPORTING YOUR PRODUCT
- TOP CONSUMING MARKETS
- UNSATURATED MARKETS
- TOP IMPORTING MARKETS
- MOST PROFITABLE MARKETS
7. PRODUCTION
The Latest Trends and Insights into The Industry
- PRODUCTION VOLUME AND VALUE
8. IMPORTS
The Largest Import Supplying Countries
- IMPORTS FROM 2012–2023
- IMPORTS BY COUNTRY
- IMPORT PRICES BY COUNTRY
9. EXPORTS
The Largest Destinations for Exports
- EXPORTS FROM 2012–2023
- EXPORTS BY COUNTRY
- EXPORT PRICES BY COUNTRY
-
10. PROFILES OF MAJOR PRODUCERS
The Largest Producers on The Market and Their Profiles
This Chapter is Available Only for the Professional Edition PRO -
LIST OF TABLES
- Key Findings In 2023
- Market Volume, In Physical Terms, 2012–2023
- Market Value, 2012–2023
- Per Capita Consumption In 2012-2023
- Imports, In Physical Terms, By Country, 2012–2023
- Imports, In Value Terms, By Country, 2012–2023
- Import Prices, By Country Of Origin, 2012–2023
- Exports, In Physical Terms, By Country, 2012–2023
- Exports, In Value Terms, By Country, 2012–2023
- Export Prices, By Country Of Destination, 2012–2023
-
LIST OF FIGURES
- Market Volume, In Physical Terms, 2012–2023
- Market Value, 2012–2023
- Market Structure – Domestic Supply vs. Imports, In Physical Terms, 2012-2023
- Market Structure – Domestic Supply vs. Imports, In Value Terms, 2012-2023
- Trade Balance, In Physical Terms, 2012-2023
- Trade Balance, In Value Terms, 2012-2023
- Per Capita Consumption, 2012-2023
- Market Volume Forecast to 2030
- Market Value Forecast to 2030
- Products: Market Size And Growth, By Type
- Products: Average Per Capita Consumption, By Type
- Products: Exports And Growth, By Type
- Products: Export Prices And Growth, By Type
- Production Volume And Growth
- Exports And Growth
- Export Prices And Growth
- Market Size And Growth
- Per Capita Consumption
- Imports And Growth
- Import Prices
- Production, In Physical Terms, 2012–2023
- Production, In Value Terms, 2012–2023
- Imports, In Physical Terms, 2012–2023
- Imports, In Value Terms, 2012–2023
- Imports, In Physical Terms, By Country, 2023
- Imports, In Physical Terms, By Country, 2012–2023
- Imports, In Value Terms, By Country, 2012–2023
- Import Prices, By Country Of Origin, 2012–2023
- Exports, In Physical Terms, 2012–2023
- Exports, In Value Terms, 2012–2023
- Exports, In Physical Terms, By Country, 2023
- Exports, In Physical Terms, By Country, 2012–2023
- Exports, In Value Terms, By Country, 2012–2023
- Export Prices, By Country Of Destination, 2012–2023


