United Kingdom - Leather Footwear - Market Analysis, Forecast, Size, Trends And Insights
Get instant access to more than 2 million reports, dashboards, and datasets on the IndexBox Platform.
View PricingPrice of Leather Footwear in UK Increases by 3% to $31.8 for Every Pair
United Kingdom Leather Footwear Import Price in May 2023
In May 2023, the leather footwear price stood at $31.8 per pair (CIF, United Kingdom), rising by 2.9% against the previous month. Over the period under review, the import price saw a relatively flat trend pattern. The growth pace was the most rapid in August 2022 an increase of 10% m-o-m. Over the period under review, average import prices hit record highs at $32.4 per pair in December 2022; however, from January 2023 to May 2023, import prices stood at a somewhat lower figure.
There were significant differences in the average prices amongst the major supplying countries. In May 2023, the country with the highest price was Italy ($144 per pair), while the price for India ($18.4 per pair) was amongst the lowest.
From May 2022 to May 2023, the most notable rate of growth in terms of prices was attained by Italy (+2.0%), while the prices for the other major suppliers experienced more modest paces of growth.
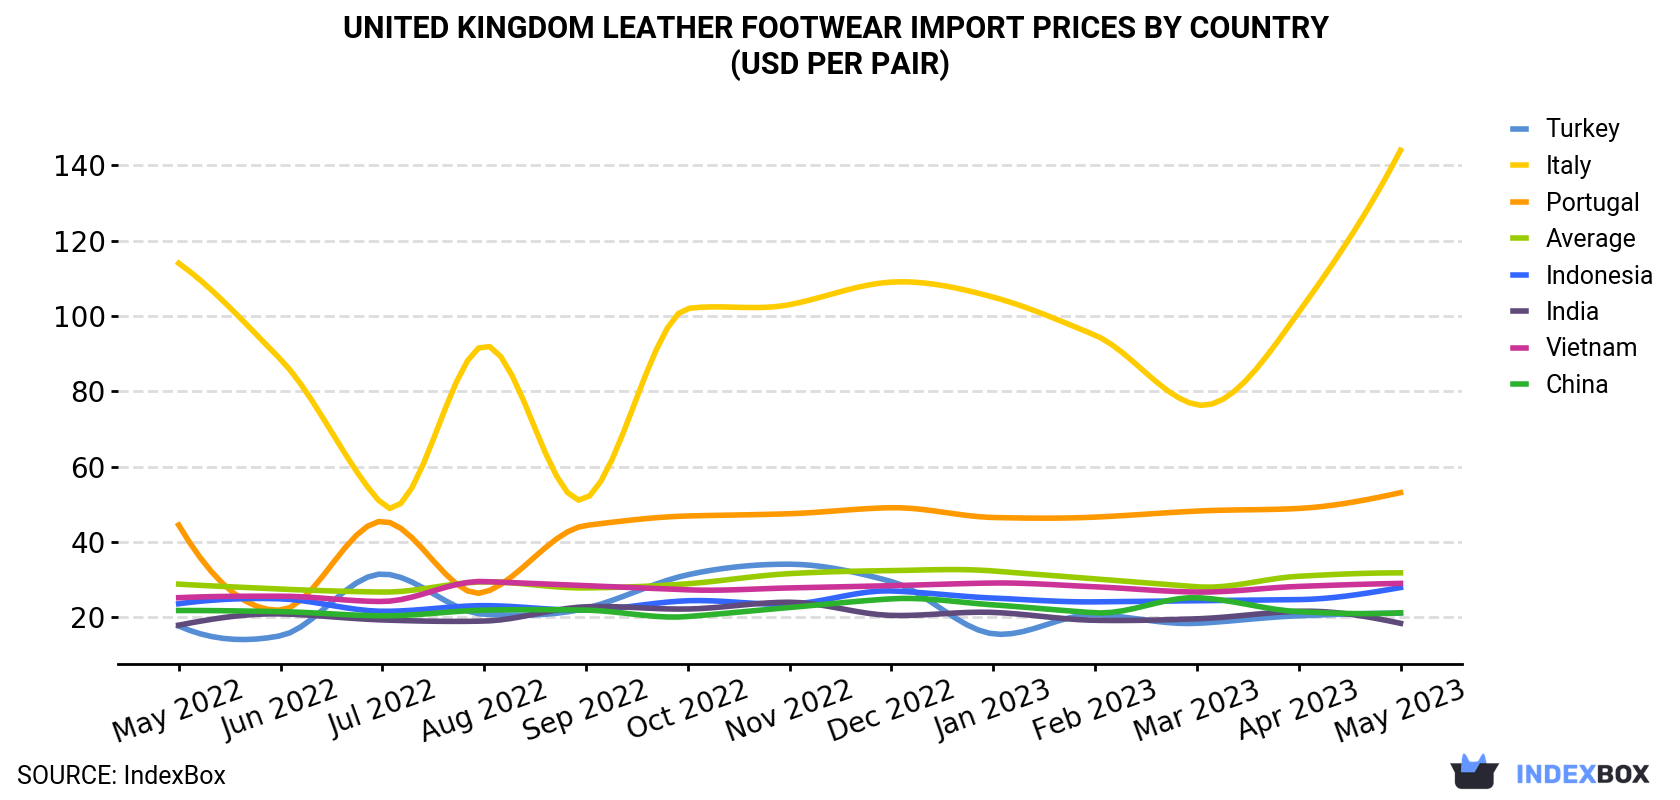
| COUNTRY | Import Price of Leather Footwear in United Kingdom (USD per pair) | ||||||||||||
|---|---|---|---|---|---|---|---|---|---|---|---|---|---|
| May 2022 | Jun 2022 | Jul 2022 | Aug 2022 | Sep 2022 | Oct 2022 | Nov 2022 | Dec 2022 | Jan 2023 | Feb 2023 | Mar 2023 | Apr 2023 | May 2023 | |
| Italy | 114 | 88.5 | 50.0 | 92.1 | 51.5 | 102 | 103 | 109 | 105 | 94.9 | 76.4 | 101 | 144 |
| Portugal | 44.5 | 21.9 | 45.5 | 26.6 | 44.4 | 46.9 | 47.5 | 49.1 | 46.5 | 46.6 | 48.2 | 48.9 | 53.1 |
| Vietnam | 25.2 | 25.6 | 24.2 | 29.5 | 28.4 | 27.3 | 27.8 | 28.4 | 29.1 | 28.1 | 26.7 | 28.2 | 29.0 |
| Indonesia | 23.6 | 24.9 | 21.6 | 23.1 | 21.9 | 24.4 | 23.5 | 27.0 | 25.1 | 24.1 | 24.4 | 24.7 | 27.9 |
| China | 21.8 | 21.5 | 20.4 | 21.9 | 21.9 | 20.2 | 22.6 | 24.9 | 23.3 | 21.2 | 25.2 | 21.5 | 21.2 |
| Turkey | 17.7 | 15.1 | 31.5 | 20.8 | 22.4 | 31.3 | 34.1 | 29.5 | 15.6 | 20.7 | 18.4 | 20.4 | 21.1 |
| India | 17.9 | 20.9 | 19.3 | 19.0 | 22.8 | 22.2 | 24.0 | 20.5 | 21.3 | 19.2 | 19.6 | 21.6 | 18.4 |
| Average | 28.8 | 27.5 | 26.7 | 29.4 | 27.8 | 28.9 | 31.6 | 32.4 | 32.3 | 30.2 | 28.1 | 30.9 | 31.8 |
United Kingdom Leather Footwear Import Prices by Type
Prices varied noticeably by the product type; the product with the highest price was footwear, outer soles and uppers of leather, nes ($94.5 per pair), while the price for footwear, nes, uppers leather ($15.6 per pair) was amongst the lowest.
From May 2022 to May 2023, the most notable rate of growth in terms of prices was attained by footwear; n.e.s. in heading no. 6403, (not covering the ankle), outer soles and uppers of leather (+2.7%), while the prices for the other products experienced more modest paces of growth.
United Kingdom Leather Footwear Imports
In May 2023, the amount of leather footwear imported into the UK surged to 5.4M pairs, with an increase of 17% against April 2023 figures. Overall, imports, however, continue to indicate a relatively flat trend pattern. Imports peaked at 7.1M pairs in October 2022; however, from November 2022 to May 2023, imports remained at a lower figure.
In value terms, leather footwear imports skyrocketed to $172M (IndexBox estimates) in May 2023. Over the period under review, imports, however, showed a relatively flat trend pattern. Over the period under review, imports hit record highs at 216M pairs in November 2022; however, from December 2022 to May 2023, imports failed to regain momentum.
United Kingdom Leather Footwear Imports by Type
In May 2023, footwear, sole rubber, plastics uppers of leather, nes (4.3M pairs) constituted the largest type of leather footwear supplied to the UK, accounting for a 80% share of total imports. Moreover, footwear, sole rubber, plastics uppers of leather, nes exceeded the figures recorded for the second-largest type, boots, sole rubber or plastic upper leather, nes (755K pairs), sixfold. The third position in this ranking was taken by footwear, outer soles and uppers of leather, nes (185K pairs), with a 3.4% share.
From May 2022 to May 2023, the average monthly growth rate of the volume of import of footwear, sole rubber, plastics uppers of leather, nes was relatively modest. With regard to the other supplied products, the following average monthly rates of growth were recorded: boots, sole rubber or plastic upper leather, nes (-2.7% per month) and footwear, outer soles and uppers of leather, nes (-1.3% per month).
In value terms, footwear, sole rubber, plastics uppers of leather, nes ($121M) constituted the largest type of leather footwear supplied to the UK, comprising 70% of total imports. The second position in the ranking was taken by boots, sole rubber or plastic upper leather, nes ($29M), with a 17% share of total imports. It was followed by footwear, outer soles and uppers of leather, nes, with a 10% share.
United Kingdom Leather Footwear Imports by Country
Vietnam (1.4M pairs), India (972K pairs) and China (900K pairs) were the main suppliers of leather footwear imports to the UK, with a combined 60% share of total imports.
From May 2022 to May 2023, the biggest increases were in Vietnam (with a CAGR of +3.2%), while purchases for the other leaders experienced mixed trend patterns.
In value terms, the largest leather footwear suppliers to the UK were Vietnam ($40M), Italy ($31M) and Indonesia ($21M), with a combined 54% share of total imports. China, India, Portugal, Spain, Brazil, Cambodia and Turkey lagged somewhat behind, together comprising a further 36%.
Among the main suppliers, Brazil, with a CAGR of +6.6%, saw the highest growth rate of the value of imports, over the period under review, while purchases for the other leaders experienced more modest paces of growth.
This report provides an in-depth analysis of the leather footwear market in the UK. Within it, you will discover the latest data on market trends and opportunities by country, consumption, production and price developments, as well as the global trade (imports and exports). The forecast exhibits the market prospects through 2030.
Product coverage:
- Prodcom 15201330 - Footwear with a wooden base and leather uppers (including clogs) (excluding with an inner sole or a protective metal toecap)
- Prodcom 15201351 - Men
- Prodcom 15201352 - Women
- Prodcom 15201353 - Children
- Prodcom 15201361 - Men
- Prodcom 15201362 - Women
- Prodcom 15201363 - Children
- Prodcom 15201370 - Slippers and other indoor footwear with rubber, plastic or leather outer soles and leather uppers (including dancing and bedroom slippers, mules)
- Prodcom 15201380 - Footwear with wood, cork or other outer soles and leather uppers (excluding outer soles of rubber, plastics or leather)
Country coverage:
- United Kingdom
Data coverage:
- Market volume and value
- Per Capita consumption
- Forecast of the market dynamics in the medium term
- Trade (exports and imports) in the UK
- Export and import prices
- Market trends, drivers and restraints
- Key market players and their profiles
Reasons to buy this report:
- Take advantage of the latest data
- Find deeper insights into current market developments
- Discover vital success factors affecting the market
This report is designed for manufacturers, distributors, importers, and wholesalers, as well as for investors, consultants and advisors.
In this report, you can find information that helps you to make informed decisions on the following issues:
- How to diversify your business and benefit from new market opportunities
- How to load your idle production capacity
- How to boost your sales on overseas markets
- How to increase your profit margins
- How to make your supply chain more sustainable
- How to reduce your production and supply chain costs
- How to outsource production to other countries
- How to prepare your business for global expansion
While doing this research, we combine the accumulated expertise of our analysts and the capabilities of artificial intelligence. The AI-based platform, developed by our data scientists, constitutes the key working tool for business analysts, empowering them to discover deep insights and ideas from the marketing data.
-
1. INTRODUCTION
Making Data-Driven Decisions to Grow Your Business
- REPORT DESCRIPTION
- RESEARCH METHODOLOGY AND AI PLATFORM
- DATA-DRIVEN DECISIONS FOR YOUR BUSINESS
- GLOSSARY AND SPECIFIC TERMS
-
2. EXECUTIVE SUMMARY
A Quick Overview of Market Performance
- KEY FINDINGS
- MARKET TRENDS This Chapter is Available Only for the Professional Edition PRO
-
3. MARKET OVERVIEW
Understanding the Current State of The Market and Its Prospects
- MARKET SIZE
- MARKET STRUCTURE
- TRADE BALANCE
- PER CAPITA CONSUMPTION
- MARKET FORECAST TO 2030
-
4. MOST PROMISING PRODUCT
Finding New Products to Diversify Your Business
This Chapter is Available Only for the Professional Edition PRO- TOP PRODUCTS TO DIVERSIFY YOUR BUSINESS
- BEST-SELLING PRODUCTS
- MOST CONSUMED PRODUCT
- MOST TRADED PRODUCT
- MOST PROFITABLE PRODUCT FOR EXPORT
-
5. MOST PROMISING SUPPLYING COUNTRIES
Choosing the Best Countries to Establish Your Sustainable Supply Chain
This Chapter is Available Only for the Professional Edition PRO- TOP COUNTRIES TO SOURCE YOUR PRODUCT
- TOP PRODUCING COUNTRIES
- TOP EXPORTING COUNTRIES
- LOW-COST EXPORTING COUNTRIES
-
6. MOST PROMISING OVERSEAS MARKETS
Choosing the Best Countries to Boost Your Exports
This Chapter is Available Only for the Professional Edition PRO- TOP OVERSEAS MARKETS FOR EXPORTING YOUR PRODUCT
- TOP CONSUMING MARKETS
- UNSATURATED MARKETS
- TOP IMPORTING MARKETS
- MOST PROFITABLE MARKETS
7. PRODUCTION
The Latest Trends and Insights into The Industry
- PRODUCTION VOLUME AND VALUE
8. IMPORTS
The Largest Import Supplying Countries
- IMPORTS FROM 2012–2023
- IMPORTS BY COUNTRY
- IMPORT PRICES BY COUNTRY
9. EXPORTS
The Largest Destinations for Exports
- EXPORTS FROM 2012–2023
- EXPORTS BY COUNTRY
- EXPORT PRICES BY COUNTRY
-
10. PROFILES OF MAJOR PRODUCERS
The Largest Producers on The Market and Their Profiles
This Chapter is Available Only for the Professional Edition PRO -
LIST OF TABLES
- Key Findings In 2023
- Market Volume, In Physical Terms, 2012–2023
- Market Value, 2012–2023
- Per Capita Consumption In 2012-2023
- Imports, In Physical Terms, By Country, 2012–2023
- Imports, In Value Terms, By Country, 2012–2023
- Import Prices, By Country Of Origin, 2012–2023
- Exports, In Physical Terms, By Country, 2012–2023
- Exports, In Value Terms, By Country, 2012–2023
- Export Prices, By Country Of Destination, 2012–2023
-
LIST OF FIGURES
- Market Volume, In Physical Terms, 2012–2023
- Market Value, 2012–2023
- Market Structure – Domestic Supply vs. Imports, In Physical Terms, 2012-2023
- Market Structure – Domestic Supply vs. Imports, In Value Terms, 2012-2023
- Trade Balance, In Physical Terms, 2012-2023
- Trade Balance, In Value Terms, 2012-2023
- Per Capita Consumption, 2012-2023
- Market Volume Forecast to 2030
- Market Value Forecast to 2030
- Products: Market Size And Growth, By Type
- Products: Average Per Capita Consumption, By Type
- Products: Exports And Growth, By Type
- Products: Export Prices And Growth, By Type
- Production Volume And Growth
- Exports And Growth
- Export Prices And Growth
- Market Size And Growth
- Per Capita Consumption
- Imports And Growth
- Import Prices
- Production, In Physical Terms, 2012–2023
- Production, In Value Terms, 2012–2023
- Imports, In Physical Terms, 2012–2023
- Imports, In Value Terms, 2012–2023
- Imports, In Physical Terms, By Country, 2023
- Imports, In Physical Terms, By Country, 2012–2023
- Imports, In Value Terms, By Country, 2012–2023
- Import Prices, By Country Of Origin, 2012–2023
- Exports, In Physical Terms, 2012–2023
- Exports, In Value Terms, 2012–2023
- Exports, In Physical Terms, By Country, 2023
- Exports, In Physical Terms, By Country, 2012–2023
- Exports, In Value Terms, By Country, 2012–2023
- Export Prices, By Country Of Destination, 2012–2023


