
United Kingdom - Frozen Fish Meat - Market Analysis, Forecast, Size, Trends and Insights
Get instant access to more than 2 million reports, dashboards, and datasets on the IndexBox Platform.
View PricingAugust 2023 Sees UK Imports of Frozen Fish Meat Surpassing $1.8M
United Kingdom Frozen Fish Meat Imports
In August 2023, approximately 593 tons of frozen fish meat were imported into the UK; increasing by 39% compared with July 2023. Overall, imports enjoyed a tangible expansion. The most prominent rate of growth was recorded in December 2022 with an increase of 61% against the previous month.
In value terms, frozen fish meat imports skyrocketed to $1.8M (IndexBox estimates) in August 2023. In general, imports showed tangible growth. The growth pace was the most rapid in January 2023 when imports increased by 69% against the previous month.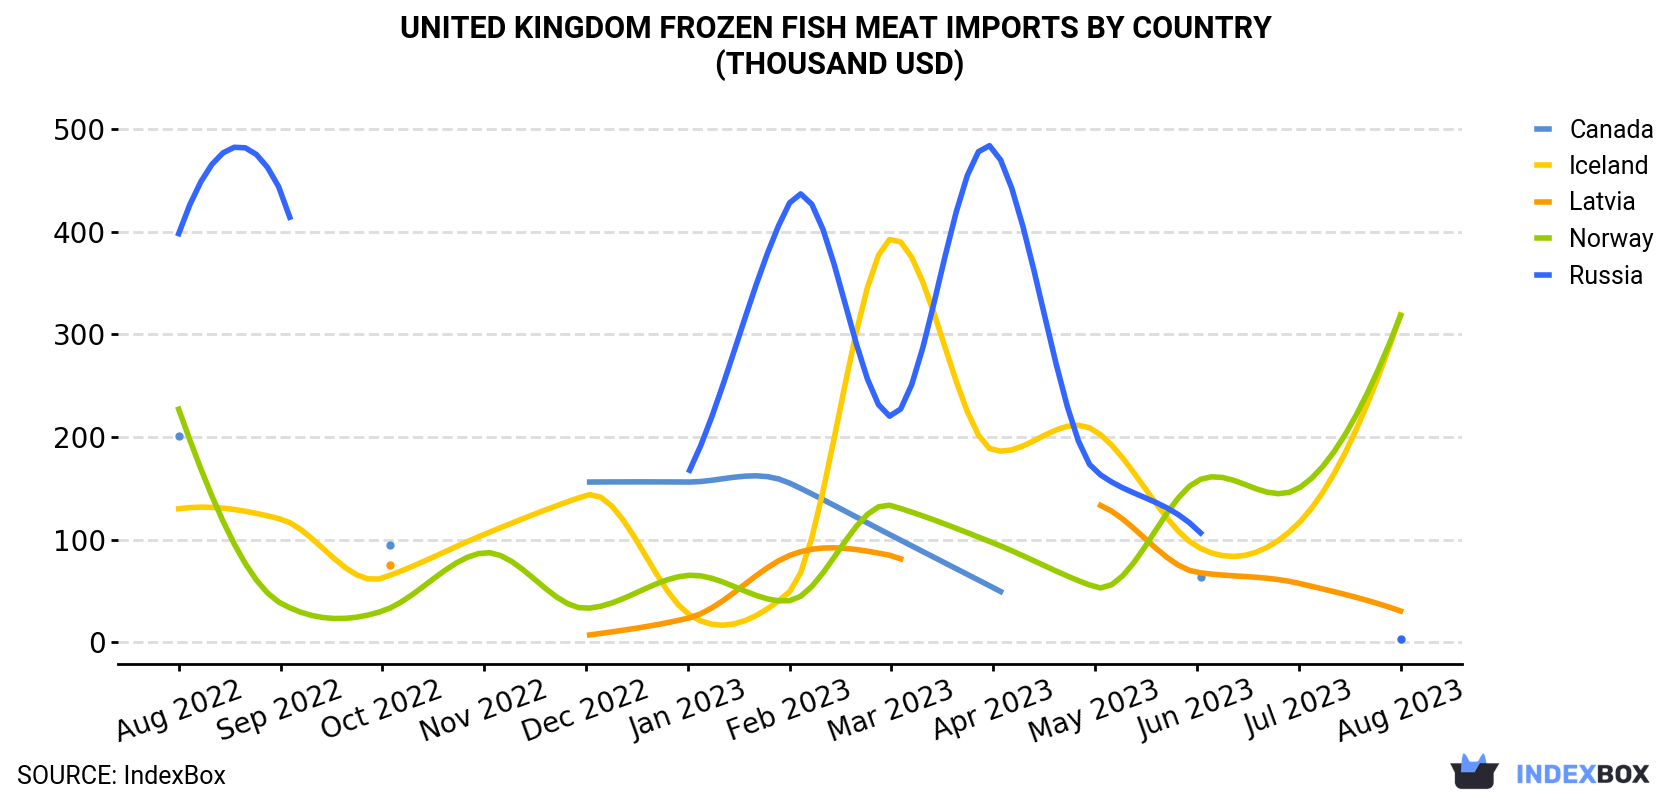
| COUNTRY | Import Value of Frozen Fish Meat in United Kingdom (thousand USD) | ||||||||||||
|---|---|---|---|---|---|---|---|---|---|---|---|---|---|
| Aug 2022 | Sep 2022 | Oct 2022 | Nov 2022 | Dec 2022 | Jan 2023 | Feb 2023 | Mar 2023 | Apr 2023 | May 2023 | Jun 2023 | Jul 2023 | Aug 2023 | |
| Iceland | 130 | 120 | 62.5 | 105 | 143 | 27.9 | 49.1 | 393 | 187 | 206 | 93.3 | 116 | 319 |
| Norway | 227 | 38.1 | 30.3 | 87.2 | 33.0 | 65.1 | 40.4 | 133 | 96.7 | 53.8 | 157 | 150 | 318 |
| Latvia | N/A | N/A | 75.5 | N/A | 6.6 | 23.3 | 84.5 | 84.4 | N/A | 135 | 68.1 | 57.4 | 30.4 |
| Russia | 398 | 440 | N/A | N/A | N/A | 164 | 428 | 220 | 481 | 167 | 110 | N/A | 2.8 |
| Canada | 201 | N/A | 94.5 | N/A | 156 | 156 | 155 | 104 | 53.1 | N/A | 63.9 | N/A | N/A |
| Others | 325 | 822 | 750 | 527 | 361 | 744 | 746 | 1,270 | 1,747 | 1,281 | 1,641 | 1,193 | 1,161 |
| Total | 1,280 | 1,420 | 1,012 | 719 | 700 | 1,181 | 1,504 | 2,203 | 2,566 | 1,842 | 2,134 | 1,516 | 1,831 |
Imports by Country
Norway (113 tons), Iceland (110 tons) and Latvia (9.3 tons) were the main suppliers of frozen fish meat imports to the UK, with a combined 39% share of total imports.
From August 2022 to August 2023, the most notable rate of growth in terms of purchases, amongst the main suppliers, was attained by Iceland (with a CAGR of +7.3%), while imports for the other leaders experienced mixed trend patterns.
In value terms, the largest frozen fish meat suppliers to the UK were Iceland ($319K), Norway ($318K) and Latvia ($30K), together accounting for 36% of total imports.
Iceland, with a CAGR of +7.8%, recorded the highest growth rate of the value of imports, among the main suppliers over the period under review, while purchases for the other leaders experienced mixed trend patterns.
Import Prices by Country
In August 2023, the frozen fish meat price stood at $3,087 per ton (CIF, United Kingdom), with a decrease of -12.9% against the previous month. Overall, the import price, however, saw a relatively flat trend pattern. The pace of growth was the most pronounced in November 2022 an increase of 34% m-o-m. As a result, import price attained the peak level of $4,698 per ton. From December 2022 to August 2023, the average import prices remained at a lower figure.
There were significant differences in the average prices amongst the major supplying countries. In August 2023, the country with the highest price was Vietnam ($5,164 per ton), while the price for Russia ($985 per ton) was amongst the lowest.
From August 2022 to August 2023, the most notable rate of growth in terms of prices was attained by Latvia (+5.9%), while the prices for the other major suppliers experienced more modest paces of growth.
This report provides an in-depth analysis of the frozen fish meat market in the UK. Within it, you will discover the latest data on market trends and opportunities by country, consumption, production and price developments, as well as the global trade (imports and exports). The forecast exhibits the market prospects through 2030.
Product coverage:
- Prodcom 10201500 - Frozen fish meat without bones (excluding fillets)
Country coverage:
- United Kingdom
Data coverage:
- Market volume and value
- Per Capita consumption
- Forecast of the market dynamics in the medium term
- Trade (exports and imports) in the UK
- Export and import prices
- Market trends, drivers and restraints
- Key market players and their profiles
Reasons to buy this report:
- Take advantage of the latest data
- Find deeper insights into current market developments
- Discover vital success factors affecting the market
This report is designed for manufacturers, distributors, importers, and wholesalers, as well as for investors, consultants and advisors.
In this report, you can find information that helps you to make informed decisions on the following issues:
- How to diversify your business and benefit from new market opportunities
- How to load your idle production capacity
- How to boost your sales on overseas markets
- How to increase your profit margins
- How to make your supply chain more sustainable
- How to reduce your production and supply chain costs
- How to outsource production to other countries
- How to prepare your business for global expansion
While doing this research, we combine the accumulated expertise of our analysts and the capabilities of artificial intelligence. The AI-based platform, developed by our data scientists, constitutes the key working tool for business analysts, empowering them to discover deep insights and ideas from the marketing data.
-
1. INTRODUCTION
Making Data-Driven Decisions to Grow Your Business
- REPORT DESCRIPTION
- RESEARCH METHODOLOGY AND AI PLATFORM
- DATA-DRIVEN DECISIONS FOR YOUR BUSINESS
- GLOSSARY AND SPECIFIC TERMS
-
2. EXECUTIVE SUMMARY
A Quick Overview of Market Performance
- KEY FINDINGS
- MARKET TRENDS This Chapter is Available Only for the Professional Edition PRO
-
3. MARKET OVERVIEW
Understanding the Current State of The Market and Its Prospects
- MARKET SIZE
- MARKET STRUCTURE
- TRADE BALANCE
- PER CAPITA CONSUMPTION
- MARKET FORECAST TO 2030
-
4. MOST PROMISING PRODUCT
Finding New Products to Diversify Your Business
This Chapter is Available Only for the Professional Edition PRO- TOP PRODUCTS TO DIVERSIFY YOUR BUSINESS
- BEST-SELLING PRODUCTS
- MOST CONSUMED PRODUCT
- MOST TRADED PRODUCT
- MOST PROFITABLE PRODUCT FOR EXPORT
-
5. MOST PROMISING SUPPLYING COUNTRIES
Choosing the Best Countries to Establish Your Sustainable Supply Chain
This Chapter is Available Only for the Professional Edition PRO- TOP COUNTRIES TO SOURCE YOUR PRODUCT
- TOP PRODUCING COUNTRIES
- TOP EXPORTING COUNTRIES
- LOW-COST EXPORTING COUNTRIES
-
6. MOST PROMISING OVERSEAS MARKETS
Choosing the Best Countries to Boost Your Exports
This Chapter is Available Only for the Professional Edition PRO- TOP OVERSEAS MARKETS FOR EXPORTING YOUR PRODUCT
- TOP CONSUMING MARKETS
- UNSATURATED MARKETS
- TOP IMPORTING MARKETS
- MOST PROFITABLE MARKETS
7. PRODUCTION
The Latest Trends and Insights into The Industry
- PRODUCTION VOLUME AND VALUE
8. IMPORTS
The Largest Import Supplying Countries
- IMPORTS FROM 2012–2023
- IMPORTS BY COUNTRY
- IMPORT PRICES BY COUNTRY
9. EXPORTS
The Largest Destinations for Exports
- EXPORTS FROM 2012–2023
- EXPORTS BY COUNTRY
- EXPORT PRICES BY COUNTRY
-
10. PROFILES OF MAJOR PRODUCERS
The Largest Producers on The Market and Their Profiles
This Chapter is Available Only for the Professional Edition PRO -
LIST OF TABLES
- Key Findings In 2023
- Market Volume, In Physical Terms, 2012–2023
- Market Value, 2012–2023
- Per Capita Consumption In 2012-2023
- Imports, In Physical Terms, By Country, 2012–2023
- Imports, In Value Terms, By Country, 2012–2023
- Import Prices, By Country Of Origin, 2012–2023
- Exports, In Physical Terms, By Country, 2012–2023
- Exports, In Value Terms, By Country, 2012–2023
- Export Prices, By Country Of Destination, 2012–2023
-
LIST OF FIGURES
- Market Volume, In Physical Terms, 2012–2023
- Market Value, 2012–2023
- Market Structure – Domestic Supply vs. Imports, In Physical Terms, 2012-2023
- Market Structure – Domestic Supply vs. Imports, In Value Terms, 2012-2023
- Trade Balance, In Physical Terms, 2012-2023
- Trade Balance, In Value Terms, 2012-2023
- Per Capita Consumption, 2012-2023
- Market Volume Forecast to 2030
- Market Value Forecast to 2030
- Products: Market Size And Growth, By Type
- Products: Average Per Capita Consumption, By Type
- Products: Exports And Growth, By Type
- Products: Export Prices And Growth, By Type
- Production Volume And Growth
- Exports And Growth
- Export Prices And Growth
- Market Size And Growth
- Per Capita Consumption
- Imports And Growth
- Import Prices
- Production, In Physical Terms, 2012–2023
- Production, In Value Terms, 2012–2023
- Imports, In Physical Terms, 2012–2023
- Imports, In Value Terms, 2012–2023
- Imports, In Physical Terms, By Country, 2023
- Imports, In Physical Terms, By Country, 2012–2023
- Imports, In Value Terms, By Country, 2012–2023
- Import Prices, By Country Of Origin, 2012–2023
- Exports, In Physical Terms, 2012–2023
- Exports, In Value Terms, 2012–2023
- Exports, In Physical Terms, By Country, 2023
- Exports, In Physical Terms, By Country, 2012–2023
- Exports, In Value Terms, By Country, 2012–2023
- Export Prices, By Country Of Destination, 2012–2023


