
Thailand - Nails, Tacks, Drawing Pins, Corrugated Nails, Staples - Market Analysis, Forecast, Size, Trends And Insights
Get instant access to more than 2 million reports, dashboards, and datasets on the IndexBox Platform.
View PricingExport of Nails and Tacks From Thailand Reaches An Average of $742K in July 2023.
Thailand Nails And Tacks Exports
In July 2023, overseas shipments of nails, tacks, drawing pins, corrugated nails, staples increased by 7.4% to 496 tons, rising for the second month in a row after two months of decline. In general, exports, however, recorded a drastic downturn. The most prominent rate of growth was recorded in March 2023 when exports increased by 191% against the previous month.
In value terms, nails and tacks exports dropped modestly to $742K (IndexBox estimates) in July 2023. Overall, exports, however, continue to indicate a abrupt downturn. The pace of growth was the most pronounced in March 2023 with an increase of 140% month-to-month. 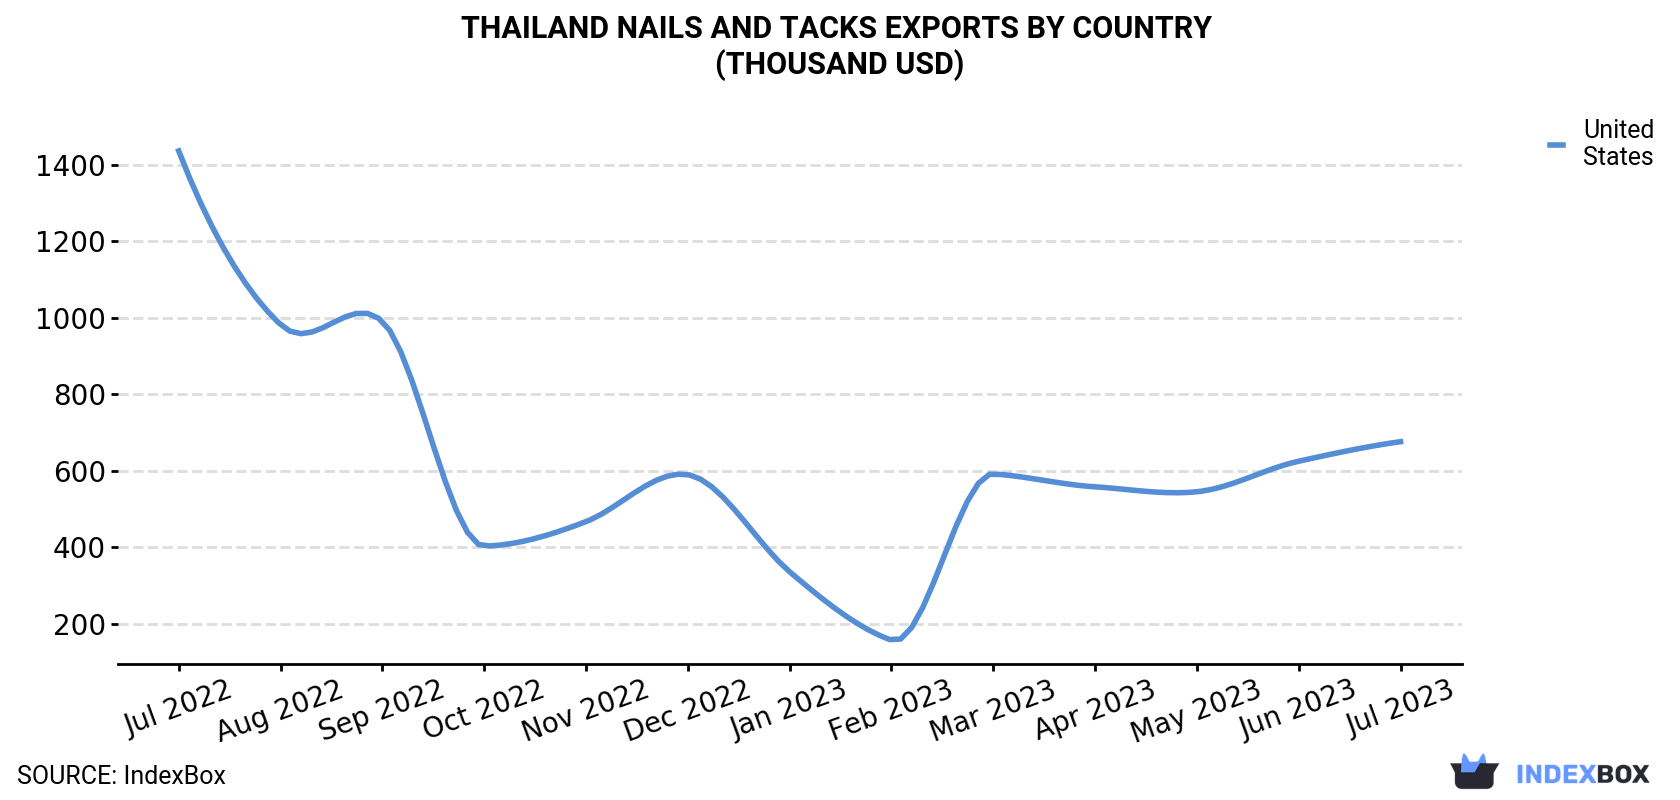
| COUNTRY | Export Value of Nails And Tacks in Thailand (thousand USD) | ||||||||||||
|---|---|---|---|---|---|---|---|---|---|---|---|---|---|
| Jul 2022 | Aug 2022 | Sep 2022 | Oct 2022 | Nov 2022 | Dec 2022 | Jan 2023 | Feb 2023 | Mar 2023 | Apr 2023 | May 2023 | Jun 2023 | Jul 2023 | |
| United States | 1,436 | 982 | 991 | 403 | 467 | 590 | 336 | 157 | 592 | 558 | 545 | 625 | 676 |
| Others | 142 | 162 | 94.3 | 170 | 117 | 129 | 62.9 | 153 | 152 | 99.1 | 123 | 118 | 65.3 |
| Total | 1,577 | 1,144 | 1,085 | 573 | 584 | 719 | 399 | 310 | 744 | 657 | 667 | 743 | 742 |
Exports by Country
The United States (474 tons) was the main destination for nails and tacks exports from Thailand, with a approximately 95% share of total exports.
From July 2022 to July 2023, the average monthly growth rate of volume to the United States stood at -5.8%.
In value terms, the United States ($676K) also remains the key foreign market for nails and tacks exports from Thailand.
From July 2022 to July 2023, the average monthly growth rate of value to the United States totaled -6.1%.
Exports by Type
Base metal staples in strips for use in offices (495 tons) was the largest type of nails and tacks exported from Thailand, with a 100% share of total exports. It was followed by letter clips, letter corners of base metal (1.6 tons), with a 0.3% share of total exports.
From July 2022 to July 2023, the average monthly rate of growth in terms of the volume of export of base metal staples in strips for use in offices totaled -6.0%. With regard to the other exported products, the following average monthly rates of growth were recorded: letter clips, letter corners of base metal (-12.9% per month) and base metal fittings for loose-leaf binders or files (-27.4% per month).
In value terms, base metal staples in strips for use in offices ($729K) remains the largest type of nails and tacks exported from Thailand, comprising 98% of total exports. The second position in the ranking was taken by letter clips, letter corners of base metal ($12K), with a 1.6% share of total exports.
From July 2022 to July 2023, the average monthly rate of growth in terms of the export volume of base metal staples in strips for use in offices amounted to -6.1%. With regard to the other exported products, the following average monthly rates of growth were recorded: letter clips, letter corners of base metal (-7.9% per month) and base metal fittings for loose-leaf binders or files (-33.8% per month).
Export Prices by Country
In July 2023, the nails and tacks price stood at $1,495 per ton (FOB, Thailand), reducing by -7% against the previous month. Over the period under review, the export price showed a relatively flat trend pattern. The most prominent rate of growth was recorded in February 2023 when the average export price increased by 23% against the previous month. The export price peaked at $1,710 per ton in August 2022; however, from September 2022 to July 2023, the export prices remained at a lower figure.
Average prices varied noticeably for the major overseas markets. In July 2023, the country with the highest price was Japan ($1,744 per ton), while the average price for exports to the United States totaled $1,428 per ton.
From July 2022 to July 2023, the most notable rate of growth in terms of prices was recorded for supplies to Japan (-0.0%).
This report provides an in-depth analysis of the nails and tacks market in Thailand. Within it, you will discover the latest data on market trends and opportunities by country, consumption, production and price developments, as well as the global trade (imports and exports). The forecast exhibits the market prospects through 2030.
Product coverage:
- Prodcom 25931400 - Nails, tacks, drawing pins, corrugated nails, staples (other than those of HS
- Prodcom 25992330 - Base metal fittings for loose-leaf binders or files
- Prodcom 25992350 - Base metal staples in strips for use in offices, upholstery and packaging
- Prodcom 25992370 - Office articles such as letter clips, letter corners... of base metal
Country coverage:
- Thailand
Data coverage:
- Market volume and value
- Per Capita consumption
- Forecast of the market dynamics in the medium term
- Trade (exports and imports) in Thailand
- Export and import prices
- Market trends, drivers and restraints
- Key market players and their profiles
Reasons to buy this report:
- Take advantage of the latest data
- Find deeper insights into current market developments
- Discover vital success factors affecting the market
This report is designed for manufacturers, distributors, importers, and wholesalers, as well as for investors, consultants and advisors.
In this report, you can find information that helps you to make informed decisions on the following issues:
- How to diversify your business and benefit from new market opportunities
- How to load your idle production capacity
- How to boost your sales on overseas markets
- How to increase your profit margins
- How to make your supply chain more sustainable
- How to reduce your production and supply chain costs
- How to outsource production to other countries
- How to prepare your business for global expansion
While doing this research, we combine the accumulated expertise of our analysts and the capabilities of artificial intelligence. The AI-based platform, developed by our data scientists, constitutes the key working tool for business analysts, empowering them to discover deep insights and ideas from the marketing data.
-
1. INTRODUCTION
Making Data-Driven Decisions to Grow Your Business
- REPORT DESCRIPTION
- RESEARCH METHODOLOGY AND AI PLATFORM
- DATA-DRIVEN DECISIONS FOR YOUR BUSINESS
- GLOSSARY AND SPECIFIC TERMS
-
2. EXECUTIVE SUMMARY
A Quick Overview of Market Performance
- KEY FINDINGS
- MARKET TRENDS This Chapter is Available Only for the Professional Edition PRO
-
3. MARKET OVERVIEW
Understanding the Current State of The Market and Its Prospects
- MARKET SIZE
- MARKET STRUCTURE
- TRADE BALANCE
- PER CAPITA CONSUMPTION
- MARKET FORECAST TO 2030
-
4. MOST PROMISING PRODUCT
Finding New Products to Diversify Your Business
This Chapter is Available Only for the Professional Edition PRO- TOP PRODUCTS TO DIVERSIFY YOUR BUSINESS
- BEST-SELLING PRODUCTS
- MOST CONSUMED PRODUCT
- MOST TRADED PRODUCT
- MOST PROFITABLE PRODUCT FOR EXPORT
-
5. MOST PROMISING SUPPLYING COUNTRIES
Choosing the Best Countries to Establish Your Sustainable Supply Chain
This Chapter is Available Only for the Professional Edition PRO- TOP COUNTRIES TO SOURCE YOUR PRODUCT
- TOP PRODUCING COUNTRIES
- TOP EXPORTING COUNTRIES
- LOW-COST EXPORTING COUNTRIES
-
6. MOST PROMISING OVERSEAS MARKETS
Choosing the Best Countries to Boost Your Exports
This Chapter is Available Only for the Professional Edition PRO- TOP OVERSEAS MARKETS FOR EXPORTING YOUR PRODUCT
- TOP CONSUMING MARKETS
- UNSATURATED MARKETS
- TOP IMPORTING MARKETS
- MOST PROFITABLE MARKETS
7. PRODUCTION
The Latest Trends and Insights into The Industry
- PRODUCTION VOLUME AND VALUE
8. IMPORTS
The Largest Import Supplying Countries
- IMPORTS FROM 2012–2023
- IMPORTS BY COUNTRY
- IMPORT PRICES BY COUNTRY
9. EXPORTS
The Largest Destinations for Exports
- EXPORTS FROM 2012–2023
- EXPORTS BY COUNTRY
- EXPORT PRICES BY COUNTRY
-
10. PROFILES OF MAJOR PRODUCERS
The Largest Producers on The Market and Their Profiles
This Chapter is Available Only for the Professional Edition PRO -
LIST OF TABLES
- Key Findings In 2023
- Market Volume, In Physical Terms, 2012–2023
- Market Value, 2012–2023
- Per Capita Consumption In 2012-2023
- Imports, In Physical Terms, By Country, 2012–2023
- Imports, In Value Terms, By Country, 2012–2023
- Import Prices, By Country Of Origin, 2012–2023
- Exports, In Physical Terms, By Country, 2012–2023
- Exports, In Value Terms, By Country, 2012–2023
- Export Prices, By Country Of Destination, 2012–2023
-
LIST OF FIGURES
- Market Volume, In Physical Terms, 2012–2023
- Market Value, 2012–2023
- Market Structure – Domestic Supply vs. Imports, In Physical Terms, 2012-2023
- Market Structure – Domestic Supply vs. Imports, In Value Terms, 2012-2023
- Trade Balance, In Physical Terms, 2012-2023
- Trade Balance, In Value Terms, 2012-2023
- Per Capita Consumption, 2012-2023
- Market Volume Forecast to 2030
- Market Value Forecast to 2030
- Products: Market Size And Growth, By Type
- Products: Average Per Capita Consumption, By Type
- Products: Exports And Growth, By Type
- Products: Export Prices And Growth, By Type
- Production Volume And Growth
- Exports And Growth
- Export Prices And Growth
- Market Size And Growth
- Per Capita Consumption
- Imports And Growth
- Import Prices
- Production, In Physical Terms, 2012–2023
- Production, In Value Terms, 2012–2023
- Imports, In Physical Terms, 2012–2023
- Imports, In Value Terms, 2012–2023
- Imports, In Physical Terms, By Country, 2023
- Imports, In Physical Terms, By Country, 2012–2023
- Imports, In Value Terms, By Country, 2012–2023
- Import Prices, By Country Of Origin, 2012–2023
- Exports, In Physical Terms, 2012–2023
- Exports, In Value Terms, 2012–2023
- Exports, In Physical Terms, By Country, 2023
- Exports, In Physical Terms, By Country, 2012–2023
- Exports, In Value Terms, By Country, 2012–2023
- Export Prices, By Country Of Destination, 2012–2023


