
Spain - Table Flatware - Market Analysis, Forecast, Size, Trends and Insights
Get instant access to more than 2 million reports, dashboards, and datasets on the IndexBox Platform.
View PricingSpain's Cutlery Imports Increase by 36% to $6.4M in October 2023
Spain Table Flatware Imports
In October 2023, imports of table flatware into Spain skyrocketed to 602 tons, rising by 20% on the month before. Overall, imports, however, showed a noticeable decline. The most prominent rate of growth was recorded in May 2023 with an increase of 55% against the previous month.
In value terms, table flatware imports surged to $6.4M (IndexBox estimates) in October 2023. Over the period under review, imports, however, showed a slight decline. The most prominent rate of growth was recorded in May 2023 with an increase of 49% m-o-m.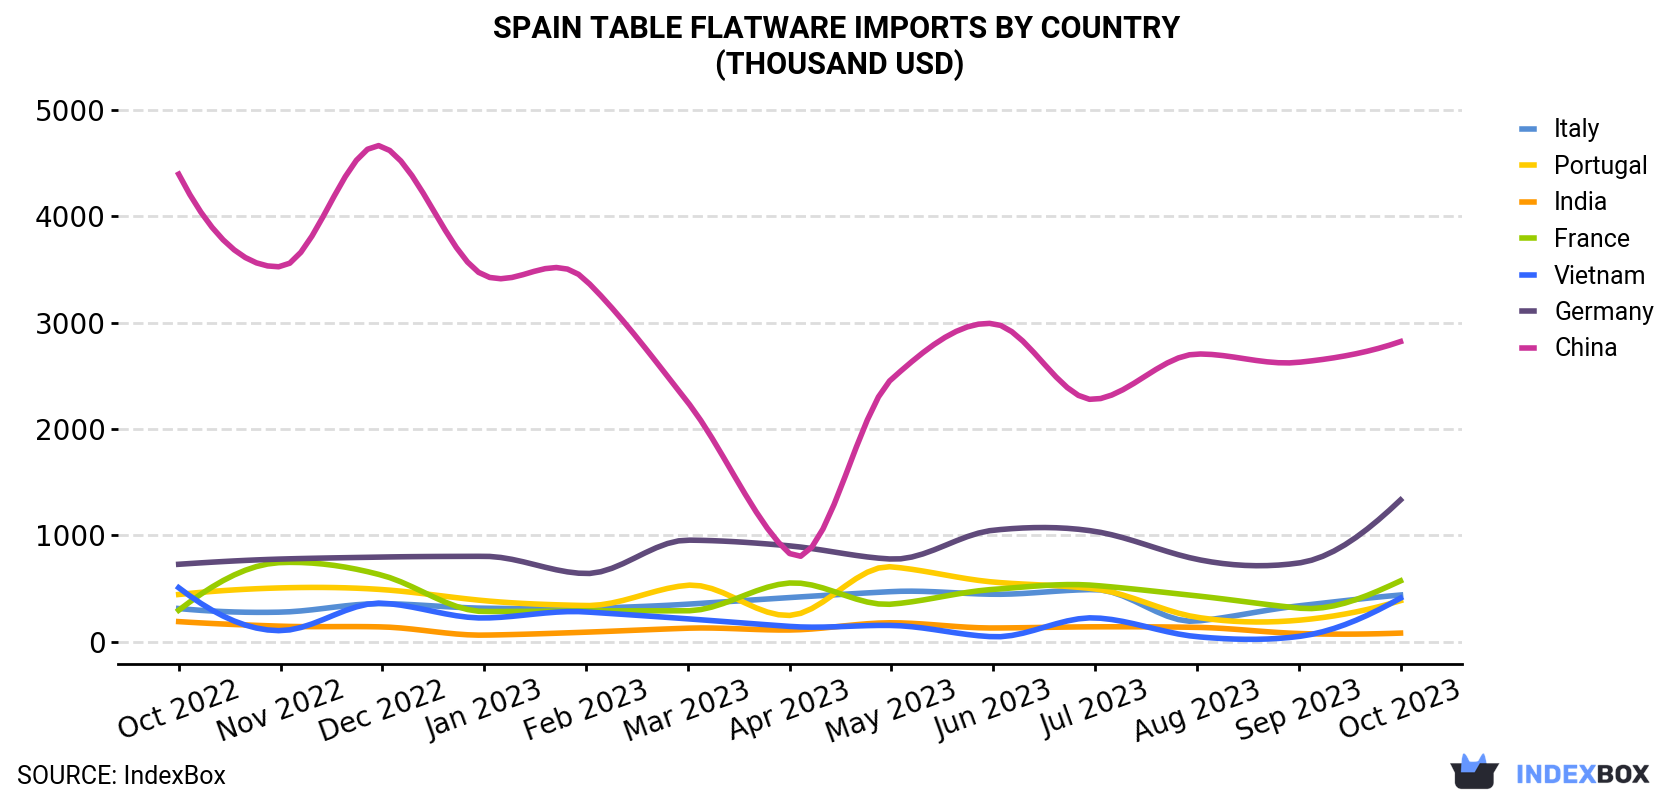
| COUNTRY | Import Value of Table Flatware in Spain (thousand USD) | ||||||||||||
|---|---|---|---|---|---|---|---|---|---|---|---|---|---|
| Oct 2022 | Nov 2022 | Dec 2022 | Jan 2023 | Feb 2023 | Mar 2023 | Apr 2023 | May 2023 | Jun 2023 | Jul 2023 | Aug 2023 | Sep 2023 | Oct 2023 | |
| China | 4,396 | 3,526 | 4,657 | 3,443 | 3,397 | 2,251 | 829 | 2,468 | 2,991 | 2,278 | 2,705 | 2,627 | 2,822 |
| Germany | 728 | 777 | 796 | 803 | 641 | 955 | 901 | 777 | 1,048 | 1,037 | 775 | 740 | 1,333 |
| France | 296 | 744 | 624 | 284 | 290 | 291 | 552 | 353 | 492 | 529 | 431 | 316 | 572 |
| Italy | 312 | 278 | 358 | 315 | 314 | 353 | 415 | 471 | 446 | 490 | 194 | 337 | 439 |
| Vietnam | 508 | 104 | 362 | 223 | 280 | 215 | 144 | 153 | 46.5 | 224 | 47.5 | 49.3 | 410 |
| Portugal | 444 | 506 | 490 | 386 | 340 | 531 | 247 | 704 | 561 | 496 | 230 | 202 | 386 |
| India | 189 | 146 | 139 | 61.9 | 89.6 | 127 | 110 | 178 | 129 | 140 | 135 | 77.3 | 81.0 |
| Others | 471 | 498 | 316 | 323 | 289 | 504 | 486 | 366 | 539 | 376 | 318 | 373 | 383 |
| Total | 7,343 | 6,579 | 7,743 | 5,840 | 5,641 | 5,228 | 3,683 | 5,469 | 6,252 | 5,571 | 4,836 | 4,722 | 6,424 |
Imports by Country
In October 2023, China (330 tons) constituted the largest supplier of table flatware to Spain, accounting for a 55% share of total imports. Moreover, table flatware imports from China exceeded the figures recorded by the second-largest supplier, Germany (77 tons), fourfold. Portugal (73 tons) ranked third in terms of total imports with a 12% share.
From October 2022 to October 2023, the average monthly growth rate of volume from China amounted to -4.9%. The remaining supplying countries recorded the following average monthly rates of imports growth: Germany (+3.0% per month) and Portugal (+6.3% per month).
In value terms, China ($2.8M) constituted the largest supplier of table flatware to Spain, comprising 44% of total imports. The second position in the ranking was taken by Germany ($1.3M), with a 21% share of total imports. It was followed by France, with an 8.9% share.
From October 2022 to October 2023, the average monthly growth rate of value from China amounted to -3.6%. The remaining supplying countries recorded the following average monthly rates of imports growth: Germany (+5.2% per month) and France (+5.6% per month).
Imports by Type
Cutlery; other than plated with precious metal (290 tons), cutlery; sets of assorted articles (eg spoons, forks, ladles, skimmers, cake-servers, fish-knives, butter knives, sugar tongs and similar), not plated with precious metal (186 tons) and cutlery; sets of assorted articles (eg spoons, forks, ladles, skimmers, cake-servers, fish-knives, butter-knives, sugar tongs and similar), with at least one article plated with precious metal (119 tons) were the main products of table flatware imports to Spain, with a combined 99% share of total imports. Cutlery; (eg spoons, forks, ladles, skimmers, cake-servers, fish-knives, butter-knives, sugar tongs and similar), plated with precious metal, not in sets lagged somewhat behind, comprising a further 1.1%.
From October 2022 to October 2023, the biggest increases were in cutlery; (eg spoons, forks, ladles, skimmers, cake-servers, fish-knives, butter-knives, sugar tongs and similar), plated with precious metal, not in sets (with a CAGR of +15.3%), while purchases for the other products experienced mixed trend patterns.
In value terms, the most traded types of table flatware in Spain were cutlery; other than plated with precious metal ($3.3M), cutlery; sets of assorted articles (eg spoons, forks, ladles, skimmers, cake-servers, fish-knives, butter knives, sugar tongs and similar), not plated with precious metal ($2.1M) and cutlery; sets of assorted articles (eg spoons, forks, ladles, skimmers, cake-servers, fish-knives, butter-knives, sugar tongs and similar), with at least one article plated with precious metal ($921K), together accounting for 98% of total imports. Cutlery; (eg spoons, forks, ladles, skimmers, cake-servers, fish-knives, butter-knives, sugar tongs and similar), plated with precious metal, not in sets lagged somewhat behind, comprising a further 1.9%.
Import Prices by Country
In October 2023, the table flatware price stood at $10,678 per ton (CIF, Spain), picking up by 14% against the previous month. Over the last twelve-month period, it increased at an average monthly rate of +1.6%. The most prominent rate of growth was recorded in March 2023 when the average import price increased by 18% m-o-m. The import price peaked at $11,642 per ton in July 2023; however, from August 2023 to October 2023, import prices remained at a lower figure.
There were significant differences in the average prices amongst the major supplying countries. In October 2023, the country with the highest price was Germany ($17,393 per ton), while the price for Portugal ($5,277 per ton) was amongst the lowest.
From October 2022 to October 2023, the most notable rate of growth in terms of prices was attained by France (+3.2%), while the prices for the other major suppliers experienced more modest paces of growth.
This report provides an in-depth analysis of the table flatware market in Spain. Within it, you will discover the latest data on market trends and opportunities by country, consumption, production and price developments, as well as the global trade (imports and exports). The forecast exhibits the market prospects through 2030.
Product coverage:
- Prodcom 25711430 - Table flatware (excluding table knives, including fish-knives and butter-knives) and similar tableware of stainless steel or other base metal
- Prodcom 25711480 - Table flatware (excluding table knives, including fish-knives and butter-knives) and similar tableware of base metal, silver- , gold- or platinum plated
Country coverage:
- Spain
Data coverage:
- Market volume and value
- Per Capita consumption
- Forecast of the market dynamics in the medium term
- Trade (exports and imports) in Spain
- Export and import prices
- Market trends, drivers and restraints
- Key market players and their profiles
Reasons to buy this report:
- Take advantage of the latest data
- Find deeper insights into current market developments
- Discover vital success factors affecting the market
This report is designed for manufacturers, distributors, importers, and wholesalers, as well as for investors, consultants and advisors.
In this report, you can find information that helps you to make informed decisions on the following issues:
- How to diversify your business and benefit from new market opportunities
- How to load your idle production capacity
- How to boost your sales on overseas markets
- How to increase your profit margins
- How to make your supply chain more sustainable
- How to reduce your production and supply chain costs
- How to outsource production to other countries
- How to prepare your business for global expansion
While doing this research, we combine the accumulated expertise of our analysts and the capabilities of artificial intelligence. The AI-based platform, developed by our data scientists, constitutes the key working tool for business analysts, empowering them to discover deep insights and ideas from the marketing data.
-
1. INTRODUCTION
Making Data-Driven Decisions to Grow Your Business
- REPORT DESCRIPTION
- RESEARCH METHODOLOGY AND AI PLATFORM
- DATA-DRIVEN DECISIONS FOR YOUR BUSINESS
- GLOSSARY AND SPECIFIC TERMS
-
2. EXECUTIVE SUMMARY
A Quick Overview of Market Performance
- KEY FINDINGS
- MARKET TRENDS This Chapter is Available Only for the Professional Edition PRO
-
3. MARKET OVERVIEW
Understanding the Current State of The Market and Its Prospects
- MARKET SIZE
- MARKET STRUCTURE
- TRADE BALANCE
- PER CAPITA CONSUMPTION
- MARKET FORECAST TO 2030
-
4. MOST PROMISING PRODUCT
Finding New Products to Diversify Your Business
This Chapter is Available Only for the Professional Edition PRO- TOP PRODUCTS TO DIVERSIFY YOUR BUSINESS
- BEST-SELLING PRODUCTS
- MOST CONSUMED PRODUCT
- MOST TRADED PRODUCT
- MOST PROFITABLE PRODUCT FOR EXPORT
-
5. MOST PROMISING SUPPLYING COUNTRIES
Choosing the Best Countries to Establish Your Sustainable Supply Chain
This Chapter is Available Only for the Professional Edition PRO- TOP COUNTRIES TO SOURCE YOUR PRODUCT
- TOP PRODUCING COUNTRIES
- TOP EXPORTING COUNTRIES
- LOW-COST EXPORTING COUNTRIES
-
6. MOST PROMISING OVERSEAS MARKETS
Choosing the Best Countries to Boost Your Exports
This Chapter is Available Only for the Professional Edition PRO- TOP OVERSEAS MARKETS FOR EXPORTING YOUR PRODUCT
- TOP CONSUMING MARKETS
- UNSATURATED MARKETS
- TOP IMPORTING MARKETS
- MOST PROFITABLE MARKETS
7. PRODUCTION
The Latest Trends and Insights into The Industry
- PRODUCTION VOLUME AND VALUE
8. IMPORTS
The Largest Import Supplying Countries
- IMPORTS FROM 2012–2023
- IMPORTS BY COUNTRY
- IMPORT PRICES BY COUNTRY
9. EXPORTS
The Largest Destinations for Exports
- EXPORTS FROM 2012–2023
- EXPORTS BY COUNTRY
- EXPORT PRICES BY COUNTRY
-
10. PROFILES OF MAJOR PRODUCERS
The Largest Producers on The Market and Their Profiles
This Chapter is Available Only for the Professional Edition PRO -
LIST OF TABLES
- Key Findings In 2023
- Market Volume, In Physical Terms, 2012–2023
- Market Value, 2012–2023
- Per Capita Consumption In 2012-2023
- Imports, In Physical Terms, By Country, 2012–2023
- Imports, In Value Terms, By Country, 2012–2023
- Import Prices, By Country Of Origin, 2012–2023
- Exports, In Physical Terms, By Country, 2012–2023
- Exports, In Value Terms, By Country, 2012–2023
- Export Prices, By Country Of Destination, 2012–2023
-
LIST OF FIGURES
- Market Volume, In Physical Terms, 2012–2023
- Market Value, 2012–2023
- Market Structure – Domestic Supply vs. Imports, In Physical Terms, 2012-2023
- Market Structure – Domestic Supply vs. Imports, In Value Terms, 2012-2023
- Trade Balance, In Physical Terms, 2012-2023
- Trade Balance, In Value Terms, 2012-2023
- Per Capita Consumption, 2012-2023
- Market Volume Forecast to 2030
- Market Value Forecast to 2030
- Products: Market Size And Growth, By Type
- Products: Average Per Capita Consumption, By Type
- Products: Exports And Growth, By Type
- Products: Export Prices And Growth, By Type
- Production Volume And Growth
- Exports And Growth
- Export Prices And Growth
- Market Size And Growth
- Per Capita Consumption
- Imports And Growth
- Import Prices
- Production, In Physical Terms, 2012–2023
- Production, In Value Terms, 2012–2023
- Imports, In Physical Terms, 2012–2023
- Imports, In Value Terms, 2012–2023
- Imports, In Physical Terms, By Country, 2023
- Imports, In Physical Terms, By Country, 2012–2023
- Imports, In Value Terms, By Country, 2012–2023
- Import Prices, By Country Of Origin, 2012–2023
- Exports, In Physical Terms, 2012–2023
- Exports, In Value Terms, 2012–2023
- Exports, In Physical Terms, By Country, 2023
- Exports, In Physical Terms, By Country, 2012–2023
- Exports, In Value Terms, By Country, 2012–2023
- Export Prices, By Country Of Destination, 2012–2023


