
South Africa - Automatic Circuit Breakers - Market Analysis, Forecast, Size, Trends and Insights
Get instant access to more than 2 million reports, dashboards, and datasets on the IndexBox Platform.
View PricingSouth Africa's Imports of Circuit Breakers Surge by 11% to $7.3M in October 2023
South Africa Circuit Breaker Imports
In October 2023, approximately 397K units of automatic circuit breakers were imported into South Africa; increasing by 35% compared with September 2023 figures. The total import volume increased at an average monthly rate of +3.2% over the period from October 2022 to October 2023; however, the trend pattern indicated some noticeable fluctuations being recorded in certain months. Over the period under review, imports hit record highs at 473K units in May 2023; however, from June 2023 to October 2023, imports stood at a somewhat lower figure.
In value terms, circuit breaker imports expanded significantly to $7.3M (IndexBox estimates) in October 2023. The total import value increased at an average monthly rate of +1.5% from October 2022 to October 2023; however, the trend pattern remained relatively stable, with only minor fluctuations being recorded throughout the analyzed period. The pace of growth was the most pronounced in August 2023 with an increase of 16% m-o-m. As a result, imports reached the peak of $8.7M. From September 2023 to October 2023, the growth of imports remained at a lower figure.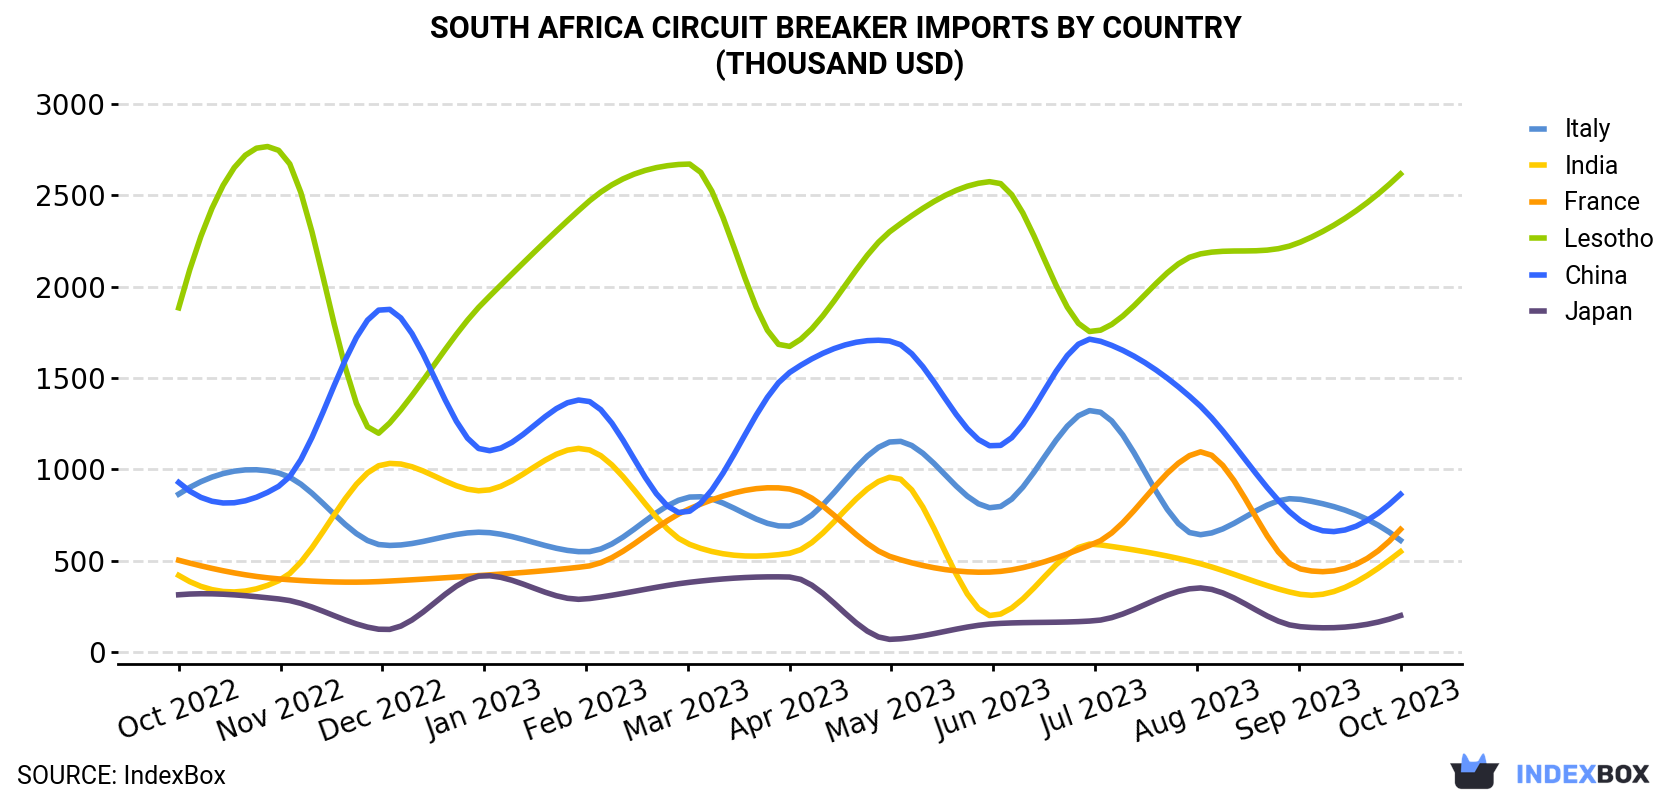
| COUNTRY | Import Value of Circuit Breaker in South Africa (thousand USD) | ||||||||||||
|---|---|---|---|---|---|---|---|---|---|---|---|---|---|
| Oct 2022 | Nov 2022 | Dec 2022 | Jan 2023 | Feb 2023 | Mar 2023 | Apr 2023 | May 2023 | Jun 2023 | Jul 2023 | Aug 2023 | Sep 2023 | Oct 2023 | |
| Lesotho | 1,884 | 2,740 | 1,211 | 1,918 | 2,453 | 2,672 | 1,673 | 2,308 | 2,576 | 1,753 | 2,175 | 2,240 | 2,617 |
| China | 928 | 913 | 1,879 | 1,103 | 1,377 | 766 | 1,530 | 1,701 | 1,125 | 1,710 | 1,364 | 725 | 863 |
| France | 502 | 399 | 386 | 420 | 468 | 780 | 892 | 520 | 438 | 595 | 1,092 | 457 | 671 |
| Italy | 864 | 977 | 585 | 655 | 548 | 846 | 689 | 1,152 | 788 | 1,322 | 642 | 837 | 611 |
| India | 419 | 395 | 1,026 | 883 | 1,111 | 593 | 540 | 958 | 198 | 590 | 488 | 317 | 549 |
| Japan | 313 | 289 | 122 | 418 | 290 | 380 | 410 | 68.8 | 154 | 171 | 350 | 139 | 199 |
| Others | 1,156 | 1,171 | 1,300 | 1,641 | 1,030 | 1,765 | 1,853 | 1,510 | 1,461 | 1,324 | 2,548 | 1,807 | 1,741 |
| Total | 6,067 | 6,885 | 6,508 | 7,039 | 7,278 | 7,801 | 7,587 | 8,218 | 6,740 | 7,466 | 8,658 | 6,522 | 7,251 |
Imports by Country
Lesotho (98K units), China (68K units) and India (59K units) were the main suppliers of circuit breaker imports to South Africa, with a combined 57% share of total imports. France, Italy and Japan lagged somewhat behind, together accounting for a further 16%.
From October 2022 to October 2023, the most notable rate of growth in terms of purchases, amongst the main suppliers, was attained by France (with a CAGR of +4.1%), while imports for the other leaders experienced more modest paces of growth.
In value terms, Lesotho ($2.6M) constituted the largest supplier of circuit breaker to South Africa, comprising 36% of total imports. The second position in the ranking was taken by China ($863K), with a 12% share of total imports. It was followed by France, with a 9.3% share.
From October 2022 to October 2023, the average monthly rate of growth in terms of value from Lesotho stood at +2.8%. The remaining supplying countries recorded the following average monthly rates of imports growth: China (-0.6% per month) and France (+2.4% per month).
Imports by Type
In October 2023, electrical apparatus; automatic circuit breakers, for a voltage not exceeding 1000 volts (268K units) constituted the largest type of circuit breaker supplied to South Africa, with a 67% share of total imports. Moreover, electrical apparatus; automatic circuit breakers, for a voltage not exceeding 1000 volts exceeded the figures recorded for the second-largest type, electrical apparatus; automatic circuit breakers, for a voltage exceeding 1000 volts but less than 72.5kV (91K units), threefold.
From October 2022 to October 2023, the average monthly rate of growth in terms of the volume of import of electrical apparatus; automatic circuit breakers, for a voltage not exceeding 1000 volts amounted to +2.0%. With regard to the other supplied products, the following average monthly rates of growth were recorded: electrical apparatus; automatic circuit breakers, for a voltage exceeding 1000 volts but less than 72.5kV (+5.8% per month) and electrical apparatus; automatic circuit breakers, for a voltage of 72.5kV or more (+8.2% per month).
In value terms, electrical apparatus; automatic circuit breakers, for a voltage not exceeding 1000 volts ($6M) constituted the largest type of circuit breaker supplied to South Africa, comprising 82% of total imports. The second position in the ranking was taken by electrical apparatus; automatic circuit breakers, for a voltage exceeding 1000 volts but less than 72.5kV ($893K), with a 12% share of total imports.
Import Prices by Country
In October 2023, the circuit breaker price amounted to $18.3 per unit (CIF, South Africa), declining by -17.4% against the previous month. Over the period under review, the import price recorded a slight decrease. The most prominent rate of growth was recorded in June 2023 when the average import price increased by 26% against the previous month. The import price peaked at $22.2 per unit in October 2022; however, from November 2022 to October 2023, import prices failed to regain momentum.
Prices varied noticeably by the country of origin: the country with the highest price was Italy ($30.2 per unit), while the price for India ($9.2 per unit) was amongst the lowest.
From October 2022 to October 2023, the most notable rate of growth in terms of prices was attained by Japan (+2.4%), while the prices for the other major suppliers experienced mixed trend patterns.
This report provides an in-depth analysis of the circuit breaker market in South Africa. Within it, you will discover the latest data on market trends and opportunities by country, consumption, production and price developments, as well as the global trade (imports and exports). The forecast exhibits the market prospects through 2030.
Product coverage:
- Prodcom 27121020 - Automatic circuit breakers
- Prodcom 27122230 - Automatic circuit breakers for a voltage . 1 kV and for a current . .63 A
- Prodcom 27122250 - Automatic circuit breakers for a voltage . 1 kV and for a current > .63 A
- Prodcom 27122230 - Automatic circuit breakers for a voltage . 1 kV and for a current . .63 A
Country coverage:
- South Africa
Data coverage:
- Market volume and value
- Per Capita consumption
- Forecast of the market dynamics in the medium term
- Trade (exports and imports) in South Africa
- Export and import prices
- Market trends, drivers and restraints
- Key market players and their profiles
Reasons to buy this report:
- Take advantage of the latest data
- Find deeper insights into current market developments
- Discover vital success factors affecting the market
This report is designed for manufacturers, distributors, importers, and wholesalers, as well as for investors, consultants and advisors.
In this report, you can find information that helps you to make informed decisions on the following issues:
- How to diversify your business and benefit from new market opportunities
- How to load your idle production capacity
- How to boost your sales on overseas markets
- How to increase your profit margins
- How to make your supply chain more sustainable
- How to reduce your production and supply chain costs
- How to outsource production to other countries
- How to prepare your business for global expansion
While doing this research, we combine the accumulated expertise of our analysts and the capabilities of artificial intelligence. The AI-based platform, developed by our data scientists, constitutes the key working tool for business analysts, empowering them to discover deep insights and ideas from the marketing data.
-
1. INTRODUCTION
Making Data-Driven Decisions to Grow Your Business
- REPORT DESCRIPTION
- RESEARCH METHODOLOGY AND AI PLATFORM
- DATA-DRIVEN DECISIONS FOR YOUR BUSINESS
- GLOSSARY AND SPECIFIC TERMS
-
2. EXECUTIVE SUMMARY
A Quick Overview of Market Performance
- KEY FINDINGS
- MARKET TRENDS This Chapter is Available Only for the Professional Edition PRO
-
3. MARKET OVERVIEW
Understanding the Current State of The Market and Its Prospects
- MARKET SIZE
- MARKET STRUCTURE
- TRADE BALANCE
- PER CAPITA CONSUMPTION
- MARKET FORECAST TO 2030
-
4. MOST PROMISING PRODUCT
Finding New Products to Diversify Your Business
This Chapter is Available Only for the Professional Edition PRO- TOP PRODUCTS TO DIVERSIFY YOUR BUSINESS
- BEST-SELLING PRODUCTS
- MOST CONSUMED PRODUCT
- MOST TRADED PRODUCT
- MOST PROFITABLE PRODUCT FOR EXPORT
-
5. MOST PROMISING SUPPLYING COUNTRIES
Choosing the Best Countries to Establish Your Sustainable Supply Chain
This Chapter is Available Only for the Professional Edition PRO- TOP COUNTRIES TO SOURCE YOUR PRODUCT
- TOP PRODUCING COUNTRIES
- TOP EXPORTING COUNTRIES
- LOW-COST EXPORTING COUNTRIES
-
6. MOST PROMISING OVERSEAS MARKETS
Choosing the Best Countries to Boost Your Exports
This Chapter is Available Only for the Professional Edition PRO- TOP OVERSEAS MARKETS FOR EXPORTING YOUR PRODUCT
- TOP CONSUMING MARKETS
- UNSATURATED MARKETS
- TOP IMPORTING MARKETS
- MOST PROFITABLE MARKETS
7. PRODUCTION
The Latest Trends and Insights into The Industry
- PRODUCTION VOLUME AND VALUE
8. IMPORTS
The Largest Import Supplying Countries
- IMPORTS FROM 2012–2023
- IMPORTS BY COUNTRY
- IMPORT PRICES BY COUNTRY
9. EXPORTS
The Largest Destinations for Exports
- EXPORTS FROM 2012–2023
- EXPORTS BY COUNTRY
- EXPORT PRICES BY COUNTRY
-
10. PROFILES OF MAJOR PRODUCERS
The Largest Producers on The Market and Their Profiles
This Chapter is Available Only for the Professional Edition PRO -
LIST OF TABLES
- Key Findings In 2023
- Market Volume, In Physical Terms, 2012–2023
- Market Value, 2012–2023
- Per Capita Consumption In 2012-2023
- Imports, In Physical Terms, By Country, 2012–2023
- Imports, In Value Terms, By Country, 2012–2023
- Import Prices, By Country Of Origin, 2012–2023
- Exports, In Physical Terms, By Country, 2012–2023
- Exports, In Value Terms, By Country, 2012–2023
- Export Prices, By Country Of Destination, 2012–2023
-
LIST OF FIGURES
- Market Volume, In Physical Terms, 2012–2023
- Market Value, 2012–2023
- Market Structure – Domestic Supply vs. Imports, In Physical Terms, 2012-2023
- Market Structure – Domestic Supply vs. Imports, In Value Terms, 2012-2023
- Trade Balance, In Physical Terms, 2012-2023
- Trade Balance, In Value Terms, 2012-2023
- Per Capita Consumption, 2012-2023
- Market Volume Forecast to 2030
- Market Value Forecast to 2030
- Products: Market Size And Growth, By Type
- Products: Average Per Capita Consumption, By Type
- Products: Exports And Growth, By Type
- Products: Export Prices And Growth, By Type
- Production Volume And Growth
- Exports And Growth
- Export Prices And Growth
- Market Size And Growth
- Per Capita Consumption
- Imports And Growth
- Import Prices
- Production, In Physical Terms, 2012–2023
- Production, In Value Terms, 2012–2023
- Imports, In Physical Terms, 2012–2023
- Imports, In Value Terms, 2012–2023
- Imports, In Physical Terms, By Country, 2023
- Imports, In Physical Terms, By Country, 2012–2023
- Imports, In Value Terms, By Country, 2012–2023
- Import Prices, By Country Of Origin, 2012–2023
- Exports, In Physical Terms, 2012–2023
- Exports, In Value Terms, 2012–2023
- Exports, In Physical Terms, By Country, 2023
- Exports, In Physical Terms, By Country, 2012–2023
- Exports, In Value Terms, By Country, 2012–2023
- Export Prices, By Country Of Destination, 2012–2023


