
Qatar - Sawnwood - Market Analysis, Forecast, Size, Trends and Insights
Get instant access to more than 2 million reports, dashboards, and datasets on the IndexBox Platform.
View PricingAugust 2023 Sees Steep Decline in Qatar's Sawnwood Import, Plunging to $2.4M
Qatar Sawnwood Imports
In August 2023, the amount of sawnwood imported into Qatar fell notably to 5.5K cubic meters, reducing by -70.8% against July 2023 figures. Over the period under review, imports continue to indicate a deep setback. The growth pace was the most rapid in October 2022 with an increase of 119% month-to-month. Imports peaked at 25K cubic meters in August 2022; however, from September 2022 to August 2023, imports failed to regain momentum.
In value terms, sawnwood imports contracted dramatically to $2.4M (IndexBox estimates) in August 2023. In general, imports saw a deep reduction. The most prominent rate of growth was recorded in October 2022 with an increase of 95% month-to-month. As a result, imports attained the peak of $9.7M. From November 2022 to August 2023, the growth of imports remained at a somewhat lower figure.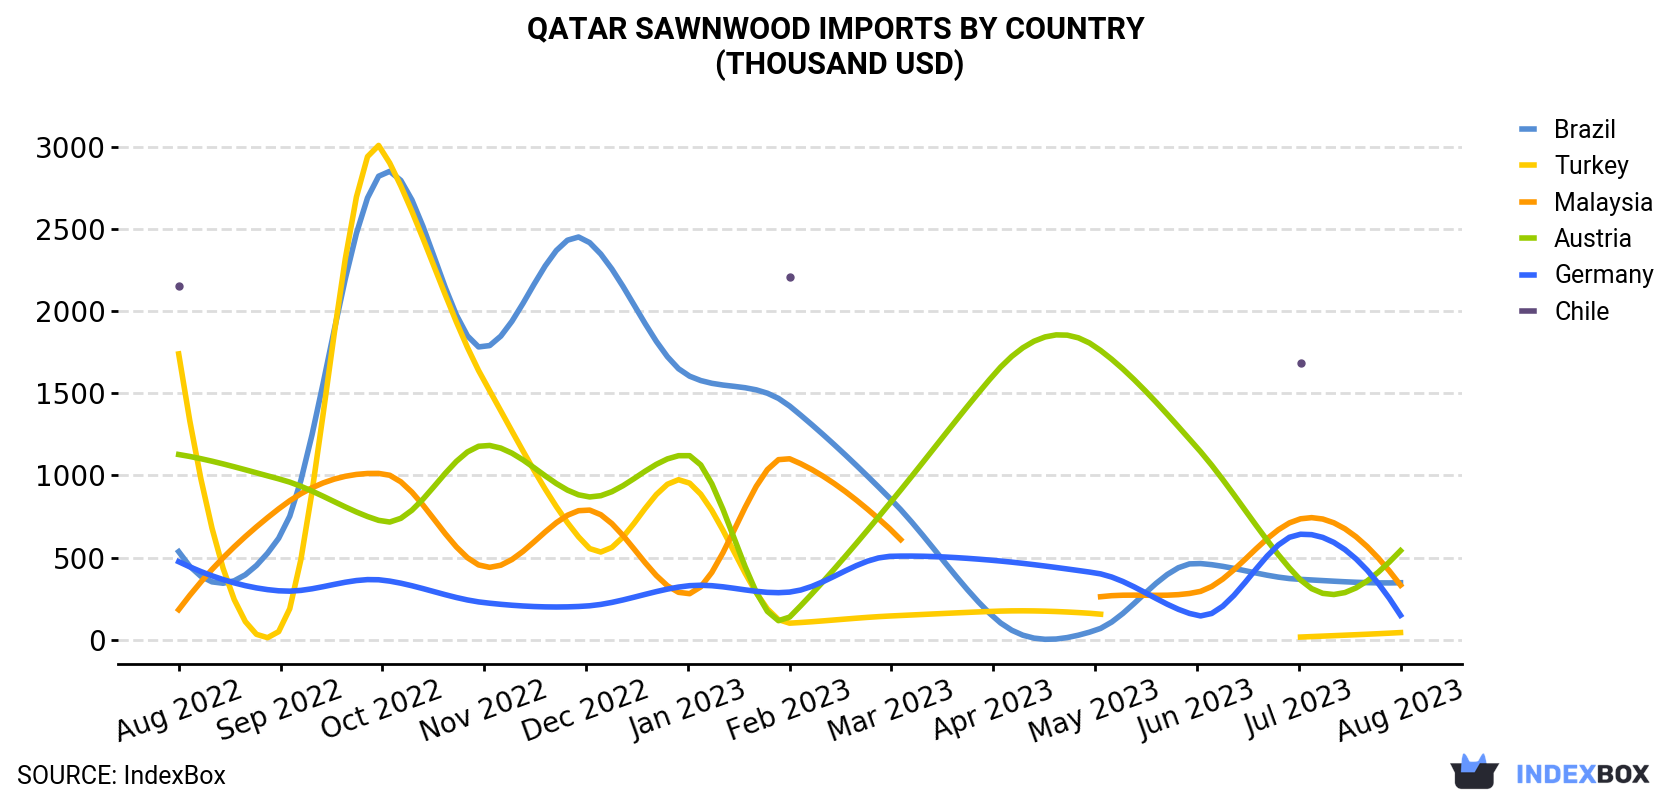
| COUNTRY | Import Value of Sawnwood in Qatar (thousand USD) | ||||||||||||
|---|---|---|---|---|---|---|---|---|---|---|---|---|---|
| Aug 2022 | Sep 2022 | Oct 2022 | Nov 2022 | Dec 2022 | Jan 2023 | Feb 2023 | Mar 2023 | Apr 2023 | May 2023 | Jun 2023 | Jul 2023 | Aug 2023 | |
| Austria | 1,127 | 976 | 720 | 1,183 | 871 | 1,122 | 138 | 842 | 1,609 | 1,784 | 1,170 | 375 | 542 |
| Brazil | 536 | 634 | 2,841 | 1,777 | 2,433 | 1,609 | 1,422 | 851 | 140 | 56.4 | 465 | 368 | 347 |
| Malaysia | 183 | 805 | 1,011 | 444 | 791 | 279 | 1,101 | 666 | N/A | 257 | 289 | 733 | 332 |
| Germany | 475 | 297 | 363 | 226 | 205 | 328 | 290 | 508 | 483 | 407 | 148 | 641 | 149 |
| Turkey | 1,739 | 61.3 | 2,982 | 1,575 | 575 | 960 | 101 | 145 | 173 | 159 | N/A | 16.0 | 43.8 |
| Chile | 2,153 | N/A | N/A | N/A | N/A | N/A | 2,207 | N/A | N/A | N/A | N/A | 1,684 | N/A |
| Others | 2,328 | 2,225 | 1,816 | 1,481 | 1,588 | 1,291 | 1,080 | 1,599 | 1,634 | 1,519 | 1,165 | 802 | 991 |
| Total | 8,541 | 4,998 | 9,733 | 6,686 | 6,464 | 5,589 | 6,340 | 4,611 | 4,040 | 4,181 | 3,238 | 4,620 | 2,405 |
Imports by Country
Austria (1.4K cubic meters), Brazil (1.1K cubic meters) and Malaysia (568 cubic meters) were the main suppliers of sawnwood imports to Qatar, together comprising 57% of total imports.
From August 2022 to August 2023, the biggest increases were in Malaysia (with a CAGR of +7.4%), while purchases for the other leaders experienced a decline.
In value terms, Austria ($542K), Brazil ($347K) and Malaysia ($332K) constituted the largest sawnwood suppliers to Qatar, with a combined 51% share of total imports.
In terms of the main suppliers, Malaysia, with a CAGR of +5.1%, recorded the highest growth rate of the value of imports, over the period under review, while purchases for the other leaders experienced a decline.
Imports by Type
In August 2023, sawnwood (coniferous) (4.2K cubic meters) constituted the largest type of sawnwood supplied to Qatar, with a 76% share of total imports. Moreover, sawnwood (coniferous) exceeded the figures recorded for the second-largest type, sawnwood (non-coniferous) (1.3K cubic meters), threefold.
From August 2022 to August 2023, the average monthly growth rate of the volume of import of sawnwood (coniferous) totaled -13.4%.
In value terms, the most traded types of sawnwood in Qatar were sawnwood (coniferous) ($1.4M) and sawnwood (non-coniferous) ($998K).
Import Prices by Country
In August 2023, the sawnwood price amounted to $438 per cubic meter (CIF, Qatar), picking up by 78% against the previous month. Overall, import price indicated a temperate increase from August 2022 to August 2023: its price increased at an average monthly rate of +2.2% over the last twelve-month period. The trend pattern, however, indicated some noticeable fluctuations being recorded throughout the analyzed period. Based on August 2023 figures, sawnwood import price increased by +78.2% against July 2023 indices. Over the period under review, average import prices hit record highs at $470 per cubic meter in September 2022; however, from October 2022 to August 2023, import prices stood at a somewhat lower figure.
Prices varied noticeably by the country of origin: the country with the highest price was Malaysia ($585 per cubic meter), while the price for Croatia ($245 per cubic meter) was amongst the lowest.
From August 2022 to August 2023, the most notable rate of growth in terms of prices was attained by Romania (+1.3%), while the prices for the other major suppliers experienced mixed trend patterns.
This report provides an in-depth analysis of the sawnwood market in Qatar. Within it, you will discover the latest data on market trends and opportunities by country, consumption, production and price developments, as well as the global trade (imports and exports). The forecast exhibits the market prospects through 2030.
Product coverage:
- FCL 1632 - Sawnwood, coniferous
- FCL 1633 - Sawnwood, non-coniferous all
Country coverage:
- Qatar
Data coverage:
- Market volume and value
- Per Capita consumption
- Forecast of the market dynamics in the medium term
- Trade (exports and imports) in Qatar
- Export and import prices
- Market trends, drivers and restraints
- Key market players and their profiles
Reasons to buy this report:
- Take advantage of the latest data
- Find deeper insights into current market developments
- Discover vital success factors affecting the market
This report is designed for manufacturers, distributors, importers, and wholesalers, as well as for investors, consultants and advisors.
In this report, you can find information that helps you to make informed decisions on the following issues:
- How to diversify your business and benefit from new market opportunities
- How to load your idle production capacity
- How to boost your sales on overseas markets
- How to increase your profit margins
- How to make your supply chain more sustainable
- How to reduce your production and supply chain costs
- How to outsource production to other countries
- How to prepare your business for global expansion
While doing this research, we combine the accumulated expertise of our analysts and the capabilities of artificial intelligence. The AI-based platform, developed by our data scientists, constitutes the key working tool for business analysts, empowering them to discover deep insights and ideas from the marketing data.
-
1. INTRODUCTION
Making Data-Driven Decisions to Grow Your Business
- REPORT DESCRIPTION
- RESEARCH METHODOLOGY AND AI PLATFORM
- DATA-DRIVEN DECISIONS FOR YOUR BUSINESS
- GLOSSARY AND SPECIFIC TERMS
-
2. EXECUTIVE SUMMARY
A Quick Overview of Market Performance
- KEY FINDINGS
- MARKET TRENDS This Chapter is Available Only for the Professional Edition PRO
-
3. MARKET OVERVIEW
Understanding the Current State of The Market and Its Prospects
- MARKET SIZE
- MARKET STRUCTURE
- TRADE BALANCE
- PER CAPITA CONSUMPTION
- MARKET FORECAST TO 2030
-
4. MOST PROMISING PRODUCT
Finding New Products to Diversify Your Business
This Chapter is Available Only for the Professional Edition PRO- TOP PRODUCTS TO DIVERSIFY YOUR BUSINESS
- BEST-SELLING PRODUCTS
- MOST CONSUMED PRODUCT
- MOST TRADED PRODUCT
- MOST PROFITABLE PRODUCT FOR EXPORT
-
5. MOST PROMISING SUPPLYING COUNTRIES
Choosing the Best Countries to Establish Your Sustainable Supply Chain
This Chapter is Available Only for the Professional Edition PRO- TOP COUNTRIES TO SOURCE YOUR PRODUCT
- TOP PRODUCING COUNTRIES
- TOP EXPORTING COUNTRIES
- LOW-COST EXPORTING COUNTRIES
-
6. MOST PROMISING OVERSEAS MARKETS
Choosing the Best Countries to Boost Your Exports
This Chapter is Available Only for the Professional Edition PRO- TOP OVERSEAS MARKETS FOR EXPORTING YOUR PRODUCT
- TOP CONSUMING MARKETS
- UNSATURATED MARKETS
- TOP IMPORTING MARKETS
- MOST PROFITABLE MARKETS
7. PRODUCTION
The Latest Trends and Insights into The Industry
- PRODUCTION VOLUME AND VALUE
8. IMPORTS
The Largest Import Supplying Countries
- IMPORTS FROM 2012–2023
- IMPORTS BY COUNTRY
- IMPORT PRICES BY COUNTRY
9. EXPORTS
The Largest Destinations for Exports
- EXPORTS FROM 2012–2023
- EXPORTS BY COUNTRY
- EXPORT PRICES BY COUNTRY
-
10. PROFILES OF MAJOR PRODUCERS
The Largest Producers on The Market and Their Profiles
This Chapter is Available Only for the Professional Edition PRO -
LIST OF TABLES
- Key Findings In 2023
- Market Volume, In Physical Terms, 2012–2023
- Market Value, 2012–2023
- Per Capita Consumption In 2012-2023
- Imports, In Physical Terms, By Country, 2012–2023
- Imports, In Value Terms, By Country, 2012–2023
- Import Prices, By Country Of Origin, 2012–2023
- Exports, In Physical Terms, By Country, 2012–2023
- Exports, In Value Terms, By Country, 2012–2023
- Export Prices, By Country Of Destination, 2012–2023
-
LIST OF FIGURES
- Market Volume, In Physical Terms, 2012–2023
- Market Value, 2012–2023
- Market Structure – Domestic Supply vs. Imports, In Physical Terms, 2012-2023
- Market Structure – Domestic Supply vs. Imports, In Value Terms, 2012-2023
- Trade Balance, In Physical Terms, 2012-2023
- Trade Balance, In Value Terms, 2012-2023
- Per Capita Consumption, 2012-2023
- Market Volume Forecast to 2030
- Market Value Forecast to 2030
- Products: Market Size And Growth, By Type
- Products: Average Per Capita Consumption, By Type
- Products: Exports And Growth, By Type
- Products: Export Prices And Growth, By Type
- Production Volume And Growth
- Exports And Growth
- Export Prices And Growth
- Market Size And Growth
- Per Capita Consumption
- Imports And Growth
- Import Prices
- Production, In Physical Terms, 2012–2023
- Production, In Value Terms, 2012–2023
- Imports, In Physical Terms, 2012–2023
- Imports, In Value Terms, 2012–2023
- Imports, In Physical Terms, By Country, 2023
- Imports, In Physical Terms, By Country, 2012–2023
- Imports, In Value Terms, By Country, 2012–2023
- Import Prices, By Country Of Origin, 2012–2023
- Exports, In Physical Terms, 2012–2023
- Exports, In Value Terms, 2012–2023
- Exports, In Physical Terms, By Country, 2023
- Exports, In Physical Terms, By Country, 2012–2023
- Exports, In Value Terms, By Country, 2012–2023
- Export Prices, By Country Of Destination, 2012–2023


