
Poland - Insulated Wire And Cable - Market Analysis, Forecast, Size, Trends and Insights
Get instant access to more than 2 million reports, dashboards, and datasets on the IndexBox Platform.
View PricingPoland's Price for Wire and Cable Drops to $13.3/kg
Poland Wire And Cable Export Price in May 2023
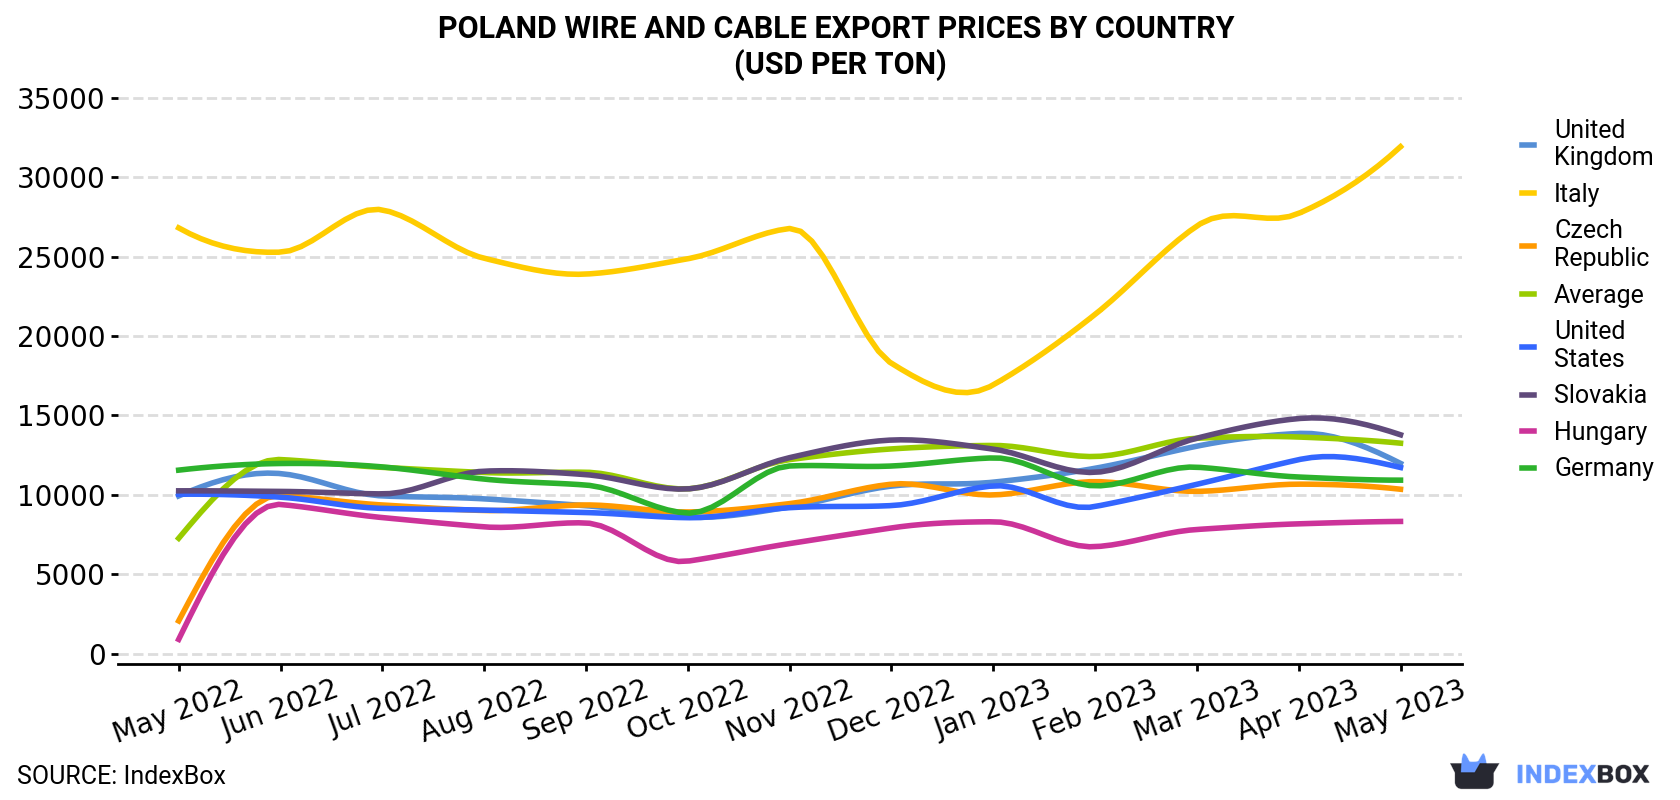
In May 2023, the wire and cable price stood at $13,255 per ton (FOB, Poland), reducing by -2.8% against the previous month. Over the period from May 2022 to May 2023, it increased at an average monthly rate of +5.1%. The pace of growth appeared the most rapid in June 2022 an increase of 68% m-o-m. The export price peaked at $13,642 per ton in April 2023, and then dropped modestly in the following month.
There were significant differences in the average prices for the major foreign markets. In May 2023, the country with the highest price was Italy ($31,929 per ton), while the average price for exports to Hungary ($8,326 per ton) was amongst the lowest.
From May 2022 to May 2023, the most notable rate of growth in terms of prices was recorded for supplies to Hungary (+20.4%), while the prices for the other major destinations experienced more modest paces of growth.
| COUNTRY | Export Price of Wire And Cable in Poland (USD per ton) | ||||||||||||
|---|---|---|---|---|---|---|---|---|---|---|---|---|---|
| May 2022 | Jun 2022 | Jul 2022 | Aug 2022 | Sep 2022 | Oct 2022 | Nov 2022 | Dec 2022 | Jan 2023 | Feb 2023 | Mar 2023 | Apr 2023 | May 2023 | |
| Italy | 26,815 | 25,288 | 27,950 | 24,901 | 23,906 | 24,871 | 26,777 | 18,286 | 16,926 | 21,366 | 26,937 | 27,727 | 31,929 |
| Slovakia | 10,254 | 10,217 | 10,061 | 11,492 | 11,272 | 10,374 | 12,344 | 13,452 | 12,881 | 11,417 | 13,570 | 14,806 | 13,784 |
| United Kingdom | 9,933 | 11,340 | 9,932 | 9,747 | 9,315 | 8,597 | 9,241 | 10,553 | 10,799 | 11,674 | 13,066 | 13,867 | 11,982 |
| United States | 10,037 | 9,854 | 9,147 | 9,038 | 8,886 | 8,561 | 9,192 | 9,324 | 10,565 | 9,264 | 10,665 | 12,216 | 11,724 |
| Germany | 11,557 | 11,975 | 11,759 | 10,993 | 10,617 | 8,853 | 11,819 | 11,816 | 12,328 | 10,567 | 11,742 | 11,123 | 10,926 |
| Czech Republic | 2,061 | 9,963 | 9,362 | 9,014 | 9,365 | 8,922 | 9,447 | 10,671 | 9,994 | 10,833 | 10,220 | 10,674 | 10,354 |
| Hungary | 898 | 9,395 | 8,569 | 7,985 | 8,230 | 5,822 | 6,931 | 7,916 | 8,305 | 6,735 | 7,819 | 8,175 | 8,326 |
| Average | 7,264 | 12,224 | 11,732 | 11,407 | 11,424 | 10,380 | 12,220 | 12,893 | 13,112 | 12,414 | 13,565 | 13,642 | 13,255 |
Poland Wire And Cable Export Prices by Type
Prices varied noticeably by the product type; the product with the highest price was insulated coaxial cables ($44,047 per ton), while the average price for exports of insulated electric conductors for a voltage under 80 v, not fitted with connectors ($8,075 per ton) was amongst the lowest.
From May 2022 to May 2023, the most notable rate of growth in terms of prices was recorded for the following types: insulated electric conductors for a voltage under 80 v, not fitted with connectors (+8.3%), while the prices for the other products experienced more modest paces of growth.
Poland Wire And Cable Exports
Wire and cable exports from Poland expanded sharply to 25K tons in May 2023, increasing by 8% against the previous month. Overall, exports, however, recorded a pronounced curtailment. The pace of growth appeared the most rapid in January 2023 when exports increased by 41% month-to-month.
In value terms, wire and cable exports rose slightly to $338M (IndexBox estimates) in May 2023. Over the period under review, exports recorded a relatively flat trend pattern. The most prominent rate of growth was recorded in January 2023 with an increase of 43% m-o-m.
Poland Wire And Cable Exports by Type
Insulated electric conductors for a voltage under 80 v, not fitted with connectors (9.9K tons), wiring sets used in vehicles, aircraft or ships (6.1K tons) and insulated electric conductors for a voltage over 1000 v (5.1K tons) were the main products of wire and cable exports from Poland, together comprising 83% of total exports. These products were followed by insulated electric conductors for a voltage under 1000 v, fitted with connectors, winding wire of copper, insulated coaxial cables and winding wire, other than of copper, which together accounted for a further 17%.
From May 2022 to May 2023, the biggest increases were in winding wire, other than of copper (with a CAGR of +14.4%), while shipments for the other products experienced more modest paces of growth.
In value terms, the most traded types of insulated wire and cable in Poland were wiring sets used in vehicles, aircraft or ships ($124M), insulated electric conductors for a voltage under 80 v, not fitted with connectors ($80M) and insulated electric conductors for a voltage under 1000 v, fitted with connectors ($69M), together accounting for 81% of total exports. These products were followed by insulated electric conductors for a voltage over 1000 v, winding wire of copper, insulated coaxial cables and winding wire, other than of copper, which together accounted for a further 19%.
Winding wire, other than of copper, with a CAGR of +2.7%, saw the highest growth rate of the value of exports, among the main product categories over the period under review, while shipments for the other products experienced more modest paces of growth.
Poland Wire And Cable Exports by Country
Germany (10K tons) was the main destination for wire and cable exports from Poland, accounting for a 40% share of total exports. Moreover, wire and cable exports to Germany exceeded the volume sent to the second major destination, the Czech Republic (2.3K tons), fourfold. The third position in this ranking was held by the United States (1.4K tons), with a 5.5% share.
From May 2022 to May 2023, the average monthly growth rate of volume to Germany was relatively modest. Exports to the other major destinations recorded the following average monthly rates of exports growth: the Czech Republic (-12.7% per month) and the United States (-5.1% per month).
In value terms, Germany ($112M) remains the key foreign market for wire and cable exports from Poland, comprising 33% of total exports. The second position in the ranking was taken by the Netherlands ($24M), with a 7.1% share of total exports. It was followed by the Czech Republic, with a 7% share.
From May 2022 to May 2023, the average monthly growth rate of value to Germany was relatively modest. Exports to the other major destinations recorded the following average monthly rates of exports growth: the Netherlands (+2.4% per month) and the Czech Republic (-0.2% per month).
This report provides an in-depth analysis of the wire and cable market in Poland. Within it, you will discover the latest data on market trends and opportunities by country, consumption, production and price developments, as well as the global trade (imports and exports). The forecast exhibits the market prospects through 2030.
Product coverage:
- Prodcom 27321130 -
- Prodcom 27321150 -
- Prodcom 27321200 - Insulated coaxial cables and other coaxial electric conductors for data and control purposes whether or not fitted with connectors
- Prodcom 27321340 - Other electric conductors, for a voltage . 1 .000 V, fitted with connectors
- Prodcom 27321380 - Other electric conductors, for a voltage . 1 .000 V, not fitted with connectors
- Prodcom 27321400 - Insulated electric conductors for voltage >1 .000 V (excluding winding wire, coaxial cable and other coaxial electric conductors, ignition and other wiring sets used in vehicles, a ircraft, ships)
- Prodcom 29311000 - Insulated ignition wiring sets and other wiring sets of a kind used in vehicles, aircraft or ships
Country coverage:
- Poland
Data coverage:
- Market volume and value
- Per Capita consumption
- Forecast of the market dynamics in the medium term
- Trade (exports and imports) in Poland
- Export and import prices
- Market trends, drivers and restraints
- Key market players and their profiles
Reasons to buy this report:
- Take advantage of the latest data
- Find deeper insights into current market developments
- Discover vital success factors affecting the market
This report is designed for manufacturers, distributors, importers, and wholesalers, as well as for investors, consultants and advisors.
In this report, you can find information that helps you to make informed decisions on the following issues:
- How to diversify your business and benefit from new market opportunities
- How to load your idle production capacity
- How to boost your sales on overseas markets
- How to increase your profit margins
- How to make your supply chain more sustainable
- How to reduce your production and supply chain costs
- How to outsource production to other countries
- How to prepare your business for global expansion
While doing this research, we combine the accumulated expertise of our analysts and the capabilities of artificial intelligence. The AI-based platform, developed by our data scientists, constitutes the key working tool for business analysts, empowering them to discover deep insights and ideas from the marketing data.
-
1. INTRODUCTION
Making Data-Driven Decisions to Grow Your Business
- REPORT DESCRIPTION
- RESEARCH METHODOLOGY AND AI PLATFORM
- DATA-DRIVEN DECISIONS FOR YOUR BUSINESS
- GLOSSARY AND SPECIFIC TERMS
-
2. EXECUTIVE SUMMARY
A Quick Overview of Market Performance
- KEY FINDINGS
- MARKET TRENDS This Chapter is Available Only for the Professional Edition PRO
-
3. MARKET OVERVIEW
Understanding the Current State of The Market and Its Prospects
- MARKET SIZE
- MARKET STRUCTURE
- TRADE BALANCE
- PER CAPITA CONSUMPTION
- MARKET FORECAST TO 2030
-
4. MOST PROMISING PRODUCT
Finding New Products to Diversify Your Business
This Chapter is Available Only for the Professional Edition PRO- TOP PRODUCTS TO DIVERSIFY YOUR BUSINESS
- BEST-SELLING PRODUCTS
- MOST CONSUMED PRODUCT
- MOST TRADED PRODUCT
- MOST PROFITABLE PRODUCT FOR EXPORT
-
5. MOST PROMISING SUPPLYING COUNTRIES
Choosing the Best Countries to Establish Your Sustainable Supply Chain
This Chapter is Available Only for the Professional Edition PRO- TOP COUNTRIES TO SOURCE YOUR PRODUCT
- TOP PRODUCING COUNTRIES
- TOP EXPORTING COUNTRIES
- LOW-COST EXPORTING COUNTRIES
-
6. MOST PROMISING OVERSEAS MARKETS
Choosing the Best Countries to Boost Your Exports
This Chapter is Available Only for the Professional Edition PRO- TOP OVERSEAS MARKETS FOR EXPORTING YOUR PRODUCT
- TOP CONSUMING MARKETS
- UNSATURATED MARKETS
- TOP IMPORTING MARKETS
- MOST PROFITABLE MARKETS
7. PRODUCTION
The Latest Trends and Insights into The Industry
- PRODUCTION VOLUME AND VALUE
8. IMPORTS
The Largest Import Supplying Countries
- IMPORTS FROM 2012–2023
- IMPORTS BY COUNTRY
- IMPORT PRICES BY COUNTRY
9. EXPORTS
The Largest Destinations for Exports
- EXPORTS FROM 2012–2023
- EXPORTS BY COUNTRY
- EXPORT PRICES BY COUNTRY
-
10. PROFILES OF MAJOR PRODUCERS
The Largest Producers on The Market and Their Profiles
This Chapter is Available Only for the Professional Edition PRO -
LIST OF TABLES
- Key Findings In 2023
- Market Volume, In Physical Terms, 2012–2023
- Market Value, 2012–2023
- Per Capita Consumption In 2012-2023
- Imports, In Physical Terms, By Country, 2012–2023
- Imports, In Value Terms, By Country, 2012–2023
- Import Prices, By Country Of Origin, 2012–2023
- Exports, In Physical Terms, By Country, 2012–2023
- Exports, In Value Terms, By Country, 2012–2023
- Export Prices, By Country Of Destination, 2012–2023
-
LIST OF FIGURES
- Market Volume, In Physical Terms, 2012–2023
- Market Value, 2012–2023
- Market Structure – Domestic Supply vs. Imports, In Physical Terms, 2012-2023
- Market Structure – Domestic Supply vs. Imports, In Value Terms, 2012-2023
- Trade Balance, In Physical Terms, 2012-2023
- Trade Balance, In Value Terms, 2012-2023
- Per Capita Consumption, 2012-2023
- Market Volume Forecast to 2030
- Market Value Forecast to 2030
- Products: Market Size And Growth, By Type
- Products: Average Per Capita Consumption, By Type
- Products: Exports And Growth, By Type
- Products: Export Prices And Growth, By Type
- Production Volume And Growth
- Exports And Growth
- Export Prices And Growth
- Market Size And Growth
- Per Capita Consumption
- Imports And Growth
- Import Prices
- Production, In Physical Terms, 2012–2023
- Production, In Value Terms, 2012–2023
- Imports, In Physical Terms, 2012–2023
- Imports, In Value Terms, 2012–2023
- Imports, In Physical Terms, By Country, 2023
- Imports, In Physical Terms, By Country, 2012–2023
- Imports, In Value Terms, By Country, 2012–2023
- Import Prices, By Country Of Origin, 2012–2023
- Exports, In Physical Terms, 2012–2023
- Exports, In Value Terms, 2012–2023
- Exports, In Physical Terms, By Country, 2023
- Exports, In Physical Terms, By Country, 2012–2023
- Exports, In Value Terms, By Country, 2012–2023
- Export Prices, By Country Of Destination, 2012–2023


