
Poland - Seats - Market Analysis, Forecast, Size, Trends and Insights
Get instant access to more than 2 million reports, dashboards, and datasets on the IndexBox Platform.
View PricingPoland Sees 3% Increase in Seat Price, Reaching $93.6 per Unit.
Poland Seat Export Price in June 2023
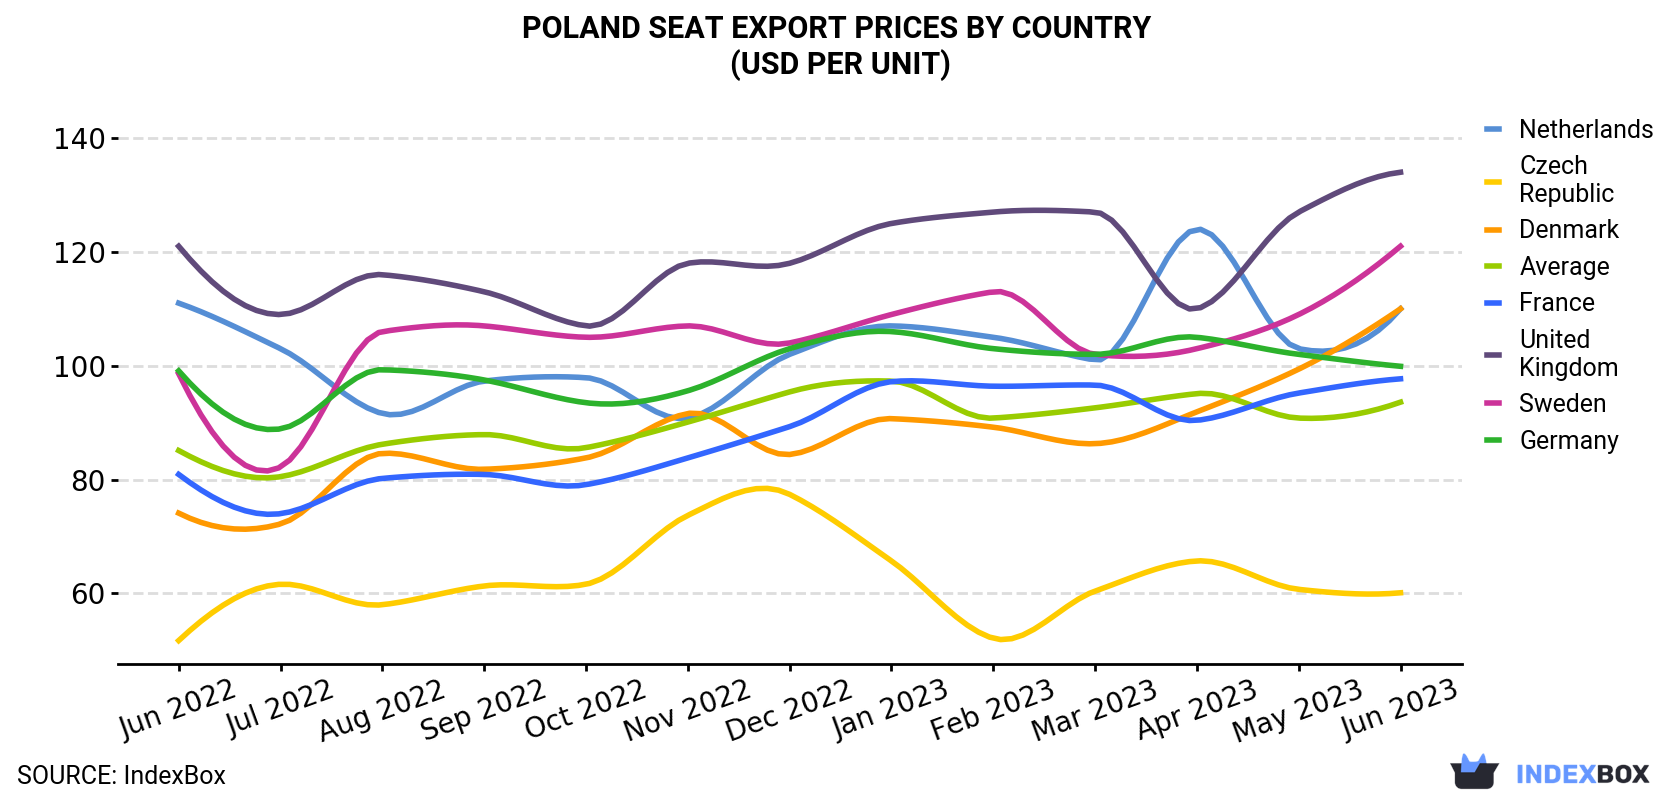
In June 2023, the seat price stood at $93.6 per unit (FOB, Poland), surging by 3.1% against the previous month. In general, the export price continues to indicate a relatively flat trend pattern. The most prominent rate of growth was recorded in August 2022 an increase of 7% against the previous month. Over the period under review, the average export prices reached the maximum at $97.3 per unit in January 2023; however, from February 2023 to June 2023, the export prices remained at a lower figure.
There were significant differences in the average prices for the major overseas markets. In June 2023, the country with the highest price was the UK ($134 per unit), while the average price for exports to the Czech Republic ($60.1 per unit) was amongst the lowest.
From June 2022 to June 2023, the most notable rate of growth in terms of prices was recorded for supplies to Denmark (+3.3%), while the prices for the other major destinations experienced more modest paces of growth.
| COUNTRY | Export Price of Seat in Poland (USD per unit) | ||||||||||||
|---|---|---|---|---|---|---|---|---|---|---|---|---|---|
| Jun 2022 | Jul 2022 | Aug 2022 | Sep 2022 | Oct 2022 | Nov 2022 | Dec 2022 | Jan 2023 | Feb 2023 | Mar 2023 | Apr 2023 | May 2023 | Jun 2023 | |
| United Kingdom | 121 | 109 | 116 | 113 | 107 | 118 | 118 | 125 | 127 | 127 | 110 | 127 | 134 |
| Sweden | 98.6 | 82.2 | 106 | 107 | 105 | 107 | 104 | 109 | 113 | 102 | 103 | 109 | 121 |
| Netherlands | 111 | 103 | 91.6 | 97.3 | 97.9 | 90.8 | 102 | 107 | 105 | 101 | 124 | 103 | 110 |
| Denmark | 74.1 | 72.2 | 84.6 | 81.8 | 83.8 | 91.6 | 84.4 | 90.7 | 89.2 | 86.3 | 91.9 | 99.4 | 110 |
| Germany | 99.1 | 88.9 | 99.3 | 97.5 | 93.5 | 95.6 | 103 | 106 | 103 | 102 | 105 | 102 | 99.9 |
| France | 80.9 | 74.0 | 80.2 | 80.9 | 79.1 | 83.8 | 89.3 | 97.2 | 96.4 | 96.6 | 90.4 | 95.2 | 97.7 |
| Czech Republic | 51.7 | 61.6 | 58.0 | 61.3 | 61.6 | 73.7 | 77.4 | 65.7 | 52.1 | 60.4 | 65.7 | 60.7 | 60.1 |
| Average | 85.1 | 80.5 | 86.2 | 87.9 | 85.6 | 90.1 | 95.4 | 97.3 | 90.8 | 92.6 | 95.1 | 90.8 | 93.6 |
Poland Seat Export Prices by Type
Prices varied noticeably by the product type; the product with the highest price was seats; of a kind used for aircraft ($538 per unit), while the average price for exports of non-upholstered seats with metal frames ($32.2 per unit) was amongst the lowest.
From June 2022 to June 2023, the most notable rate of growth in terms of prices was recorded for the following types: seats; of a kind used for aircraft (+5.9%), while the prices for the other products experienced more modest paces of growth.
Poland Seat Exports
In June 2023, seat exports from Poland dropped to 3.7M units, waning by -6.2% on the month before. Over the period under review, exports continue to indicate a relatively flat trend pattern. The most prominent rate of growth was recorded in January 2023 when exports increased by 16% m-o-m. Over the period under review, the exports hit record highs at 4.4M units in March 2023; however, from April 2023 to June 2023, the exports remained at a lower figure.
In value terms, seat exports reduced slightly to $349M (IndexBox estimates) in June 2023. In general, exports, however, showed a relatively flat trend pattern. The pace of growth appeared the most rapid in January 2023 with an increase of 18% against the previous month. Over the period under review, the exports attained the peak figure at 409M units in March 2023; however, from April 2023 to June 2023, the exports failed to regain momentum.
Poland Seat Exports by Type
Upholstered seats with wooden frames (1.6M units) was the largest type of seat exported from Poland, accounting for a 43% share of total exports. Moreover, upholstered seats with wooden frames exceeded the volume of the second product type, seats for motor vehicles (647K units), twofold. Upholstered seats with metal frames (566K units) ranked third in terms of total exports with a 15% share.
From June 2022 to June 2023, the average monthly growth rate of the volume of export of upholstered seats with wooden frames amounted to -1.1%. With regard to the other exported products, the following average monthly rates of growth were recorded: seats for motor vehicles (+2.4% per month) and upholstered seats with metal frames (-0.2% per month).
In value terms, upholstered seats with wooden frames ($218M) remains the largest type of seat exported from Poland, comprising 63% of total exports. The second position in the ranking was taken by seats for motor vehicles ($58M), with a 17% share of total exports. It was followed by upholstered seats with metal frames, with an 8.8% share.
From June 2022 to June 2023, the average monthly rate of growth in terms of the export volume of upholstered seats with wooden frames was relatively modest. With regard to the other exported products, the following average monthly rates of growth were recorded: seats for motor vehicles (+2.1% per month) and upholstered seats with metal frames (+0.0% per month).
Poland Seat Exports by Country
Germany (1.2M units) was the main destination for seat exports from Poland, with a 32% share of total exports. Moreover, seat exports to Germany exceeded the volume sent to the second major destination, the Netherlands (475K units), threefold. The third position in this ranking was taken by the Czech Republic (411K units), with an 11% share.
From June 2022 to June 2023, the average monthly growth rate of volume to Germany was relatively modest. Exports to the other major destinations recorded the following average monthly rates of exports growth: the Netherlands (+1.6% per month) and the Czech Republic (+0.2% per month).
In value terms, Germany ($120M) remains the key foreign market for seat exports from Poland, comprising 34% of total exports. The second position in the ranking was taken by the Netherlands ($52M), with a 15% share of total exports. It was followed by France, with an 8.1% share.
From June 2022 to June 2023, the average monthly rate of growth in terms of value to Germany was relatively modest. Exports to the other major destinations recorded the following average monthly rates of exports growth: the Netherlands (+1.5% per month) and France (+1.2% per month).
This report provides an in-depth analysis of the seat market in Poland. Within it, you will discover the latest data on market trends and opportunities by country, consumption, production and price developments, as well as the global trade (imports and exports). The forecast exhibits the market prospects through 2030.
Product coverage:
- Prodcom 29321000 - Seats for motor vehicles
- Prodcom 30305010 - Seats for aircraft, parts thereof
- Prodcom 31001155 -
- Prodcom 31001159 -
- Prodcom 31001170 - Upholstered seats with metal frames (excluding swivel seats, m edical, surgical, dental or veterinary seats, barbers
- Prodcom 31001190 - Non-upholstered seats with metal frames (excluding medical, s urgical, dental or veterinary seats, barbers
- Prodcom 31001210 - Seats convertible into beds (excluding garden seats or camping equipment)
- Prodcom 31001230 - Seats of cane, osier, bamboo or similar materials
- Prodcom 31001250 - Upholstered seats with wooden frames (including three piece suites) (excluding swivel seats)
- Prodcom 31001290 - Non-upholstered seats with wooden frames (excluding swivel seats)
- Prodcom 31001300 - Other seats, of HS
Country coverage:
- Poland
Data coverage:
- Market volume and value
- Per Capita consumption
- Forecast of the market dynamics in the medium term
- Trade (exports and imports) in Poland
- Export and import prices
- Market trends, drivers and restraints
- Key market players and their profiles
Reasons to buy this report:
- Take advantage of the latest data
- Find deeper insights into current market developments
- Discover vital success factors affecting the market
This report is designed for manufacturers, distributors, importers, and wholesalers, as well as for investors, consultants and advisors.
In this report, you can find information that helps you to make informed decisions on the following issues:
- How to diversify your business and benefit from new market opportunities
- How to load your idle production capacity
- How to boost your sales on overseas markets
- How to increase your profit margins
- How to make your supply chain more sustainable
- How to reduce your production and supply chain costs
- How to outsource production to other countries
- How to prepare your business for global expansion
While doing this research, we combine the accumulated expertise of our analysts and the capabilities of artificial intelligence. The AI-based platform, developed by our data scientists, constitutes the key working tool for business analysts, empowering them to discover deep insights and ideas from the marketing data.
-
1. INTRODUCTION
Making Data-Driven Decisions to Grow Your Business
- REPORT DESCRIPTION
- RESEARCH METHODOLOGY AND AI PLATFORM
- DATA-DRIVEN DECISIONS FOR YOUR BUSINESS
- GLOSSARY AND SPECIFIC TERMS
-
2. EXECUTIVE SUMMARY
A Quick Overview of Market Performance
- KEY FINDINGS
- MARKET TRENDS This Chapter is Available Only for the Professional Edition PRO
-
3. MARKET OVERVIEW
Understanding the Current State of The Market and Its Prospects
- MARKET SIZE
- MARKET STRUCTURE
- TRADE BALANCE
- PER CAPITA CONSUMPTION
- MARKET FORECAST TO 2030
-
4. MOST PROMISING PRODUCT
Finding New Products to Diversify Your Business
This Chapter is Available Only for the Professional Edition PRO- TOP PRODUCTS TO DIVERSIFY YOUR BUSINESS
- BEST-SELLING PRODUCTS
- MOST CONSUMED PRODUCT
- MOST TRADED PRODUCT
- MOST PROFITABLE PRODUCT FOR EXPORT
-
5. MOST PROMISING SUPPLYING COUNTRIES
Choosing the Best Countries to Establish Your Sustainable Supply Chain
This Chapter is Available Only for the Professional Edition PRO- TOP COUNTRIES TO SOURCE YOUR PRODUCT
- TOP PRODUCING COUNTRIES
- TOP EXPORTING COUNTRIES
- LOW-COST EXPORTING COUNTRIES
-
6. MOST PROMISING OVERSEAS MARKETS
Choosing the Best Countries to Boost Your Exports
This Chapter is Available Only for the Professional Edition PRO- TOP OVERSEAS MARKETS FOR EXPORTING YOUR PRODUCT
- TOP CONSUMING MARKETS
- UNSATURATED MARKETS
- TOP IMPORTING MARKETS
- MOST PROFITABLE MARKETS
7. PRODUCTION
The Latest Trends and Insights into The Industry
- PRODUCTION VOLUME AND VALUE
8. IMPORTS
The Largest Import Supplying Countries
- IMPORTS FROM 2012–2023
- IMPORTS BY COUNTRY
- IMPORT PRICES BY COUNTRY
9. EXPORTS
The Largest Destinations for Exports
- EXPORTS FROM 2012–2023
- EXPORTS BY COUNTRY
- EXPORT PRICES BY COUNTRY
-
10. PROFILES OF MAJOR PRODUCERS
The Largest Producers on The Market and Their Profiles
This Chapter is Available Only for the Professional Edition PRO -
LIST OF TABLES
- Key Findings In 2023
- Market Volume, In Physical Terms, 2012–2023
- Market Value, 2012–2023
- Per Capita Consumption In 2012-2023
- Imports, In Physical Terms, By Country, 2012–2023
- Imports, In Value Terms, By Country, 2012–2023
- Import Prices, By Country Of Origin, 2012–2023
- Exports, In Physical Terms, By Country, 2012–2023
- Exports, In Value Terms, By Country, 2012–2023
- Export Prices, By Country Of Destination, 2012–2023
-
LIST OF FIGURES
- Market Volume, In Physical Terms, 2012–2023
- Market Value, 2012–2023
- Market Structure – Domestic Supply vs. Imports, In Physical Terms, 2012-2023
- Market Structure – Domestic Supply vs. Imports, In Value Terms, 2012-2023
- Trade Balance, In Physical Terms, 2012-2023
- Trade Balance, In Value Terms, 2012-2023
- Per Capita Consumption, 2012-2023
- Market Volume Forecast to 2030
- Market Value Forecast to 2030
- Products: Market Size And Growth, By Type
- Products: Average Per Capita Consumption, By Type
- Products: Exports And Growth, By Type
- Products: Export Prices And Growth, By Type
- Production Volume And Growth
- Exports And Growth
- Export Prices And Growth
- Market Size And Growth
- Per Capita Consumption
- Imports And Growth
- Import Prices
- Production, In Physical Terms, 2012–2023
- Production, In Value Terms, 2012–2023
- Imports, In Physical Terms, 2012–2023
- Imports, In Value Terms, 2012–2023
- Imports, In Physical Terms, By Country, 2023
- Imports, In Physical Terms, By Country, 2012–2023
- Imports, In Value Terms, By Country, 2012–2023
- Import Prices, By Country Of Origin, 2012–2023
- Exports, In Physical Terms, 2012–2023
- Exports, In Value Terms, 2012–2023
- Exports, In Physical Terms, By Country, 2023
- Exports, In Physical Terms, By Country, 2012–2023
- Exports, In Value Terms, By Country, 2012–2023
- Export Prices, By Country Of Destination, 2012–2023


